

Integration of network pharmacology and intestinal flora to investigate the mechanism of action of Chinese herbal Cichorium intybus formula in attenuating adenine and ethambutol hydrochloride-induced hyperuricemic nephropathy in rats
- PMID: 36444935
- PMCID: PMC9897651
- DOI: 10.1080/13880209.2022.2147551
Integration of network pharmacology and intestinal flora to investigate the mechanism of action of Chinese herbal Cichorium intybus formula in attenuating adenine and ethambutol hydrochloride-induced hyperuricemic nephropathy in rats
Abstract
Context: Cichorium intybus L. (Asteraceae) formula (CF) has been applied as a folk medicine to treat hyperuricemic nephropathy (HN). However, the exact mechanism remains unclear.
Objective: To explore the therapeutic effect and mechanism of CF on HN.
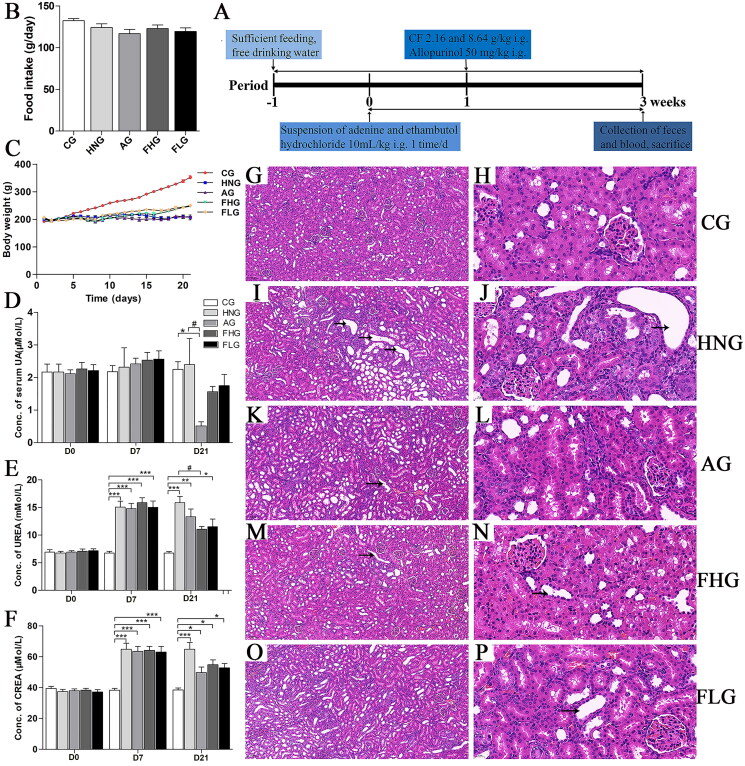
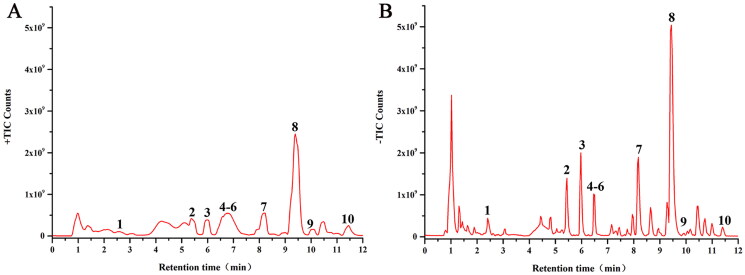
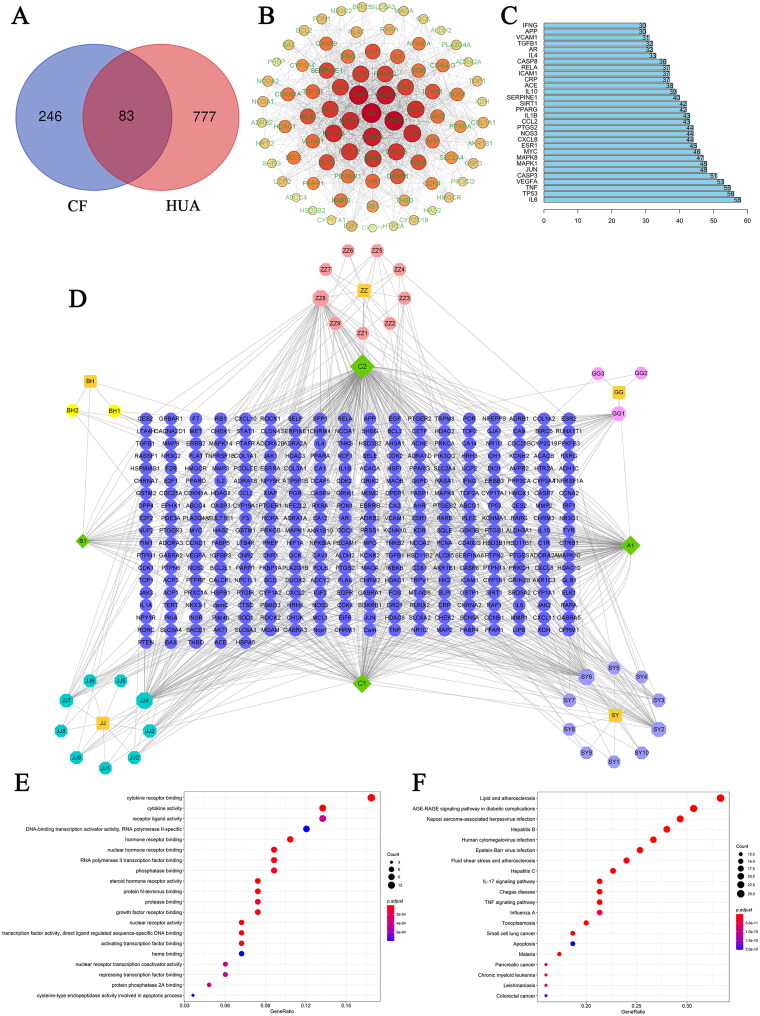
Materials and methods: Through network pharmacological methods, the targets of the active component of CF against HN were obtained. Subsequently, Male Wistar rats were divided into control, HN, allopurinol (50 mg/kg), CF high-dose (8.64 g/kg) and CF low-dose (2.16 g/kg) groups. The HN model was induced via intragastric administration of adenine (100 mg/kg) and ethambutol hydrochloride (250 mg/kg) for 3 weeks. After CF treatment, biochemical indicators including UA, UREA and CREA were measured. Then, HE staining, qRT-PCR and gut microbiota analysis were conducted to further explore the mechanism.
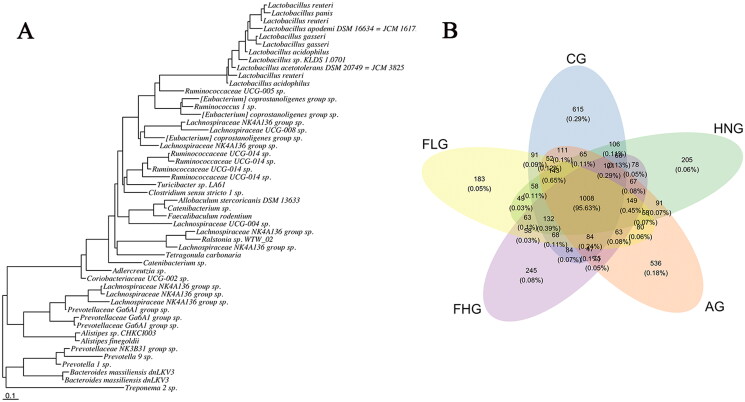
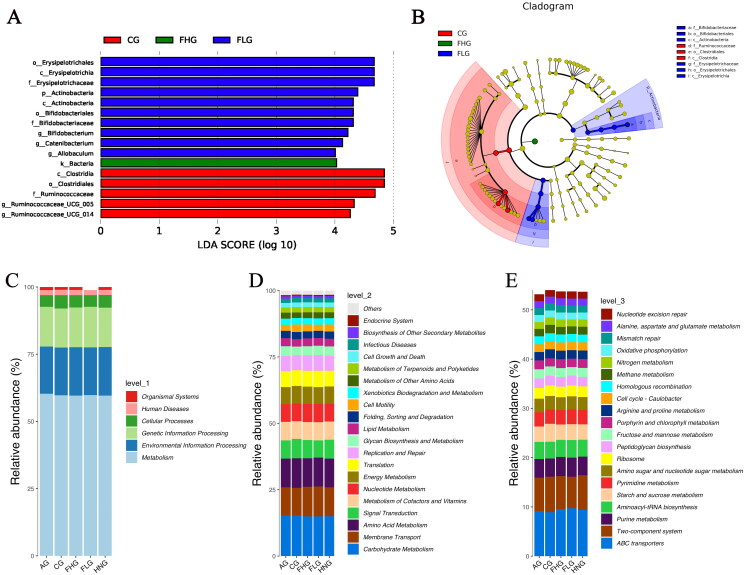
Results: The network pharmacology identified 83 key targets, 6 core genes and 200 signalling pathways involved in the treatment of HN. Compared to the HN group, CF (8.64 g/kg) significantly reduced the levels of UA, UREA and CREA (from 2.4 to 1.57 μMol/L, from 15.87 to 11.05 mMol/L and from 64.83 to 54.83 μMol/L, respectively), and mitigated renal damage. Furthermore, CF inhibited the expression of IL-6, TP53, TNF and JUN. It also altered the composition of gut microbiota, and ameliorated HN by increasing the relative abundance of some probiotics.
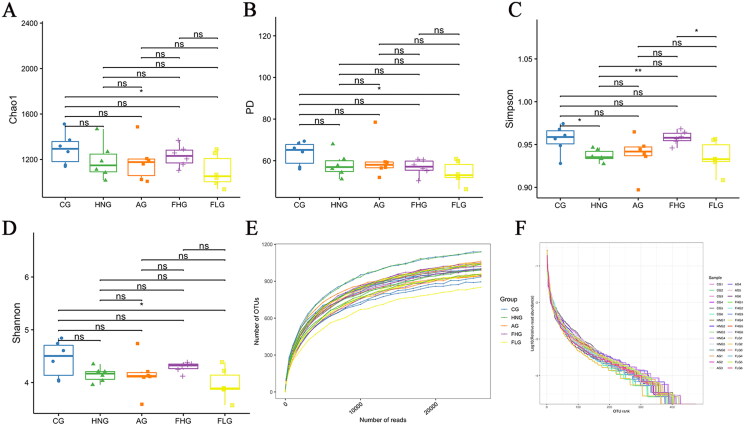
Conclusions: This work elucidated the therapeutic effect and underlying mechanism by which CF protects against HN from the view of the biodiversity of the intestinal flora, thus providing a scientific basis for the usage of CF.
Keywords: gut microorganisms; molecular docking; nephroprotective effect; traditional Chinese medicine formula.
Conflict of interest statement
The authors declare that they have no known competing financial interests or personal relationships that could have appeared to influence the work reported in this paper.
Figures


Similar articles
-
A Novel Approach Based on Gut Microbiota Analysis and Network Pharmacology to Explain the Mechanisms of Action of Cichorium intybus L. Formula in the Improvement of Hyperuricemic Nephropathy in Rats.Drug Des Devel Ther. 2023 Jan 20;17:107-128. doi: 10.2147/DDDT.S389811. eCollection 2023. Drug Des Devel Ther. 2023. PMID: 36712944 Free PMC article.
-
Ethanol extract of Liriodendron chinense (Hemsl.) Sarg barks attenuates hyperuricemic nephropathy by inhibiting renal fibrosis and inflammation in mice.J Ethnopharmacol. 2021 Jan 10;264:113278. doi: 10.1016/j.jep.2020.113278. Epub 2020 Aug 22. J Ethnopharmacol. 2021. PMID: 32841699
-
Xanthoceras sorbifolium leaves alleviate hyperuricemic nephropathy by inhibiting the PI3K/AKT signaling pathway to regulate uric acid transport.J Ethnopharmacol. 2024 Jun 12;327:117946. doi: 10.1016/j.jep.2024.117946. Epub 2024 Mar 4. J Ethnopharmacol. 2024. PMID: 38447615
-
Overview of pharmacodynamical research of traditional Chinese medicine on hyperuricemic nephropathy: from the perspective of dual-regulatory effect on the intestines and kidneys.Front Pharmacol. 2025 Apr 8;16:1517047. doi: 10.3389/fphar.2025.1517047. eCollection 2025. Front Pharmacol. 2025. PMID: 40264662 Free PMC article. Review.
-
Traditional Chinese herbs and natural products in hyperuricemia-induced chronic kidney disease.Front Pharmacol. 2022 Aug 9;13:971032. doi: 10.3389/fphar.2022.971032. eCollection 2022. Front Pharmacol. 2022. PMID: 36016570 Free PMC article. Review.
Cited by
-
Research progress on the mechanism of hyperuricemic nephropathy based on multi-omics technique: A review.Medicine (Baltimore). 2024 Dec 20;103(51):e40975. doi: 10.1097/MD.0000000000040975. Medicine (Baltimore). 2024. PMID: 39705438 Free PMC article. Review.
-
Effects of traditional Chinese medicine Zuo-Gui-Wan on gut microbiota in an osteoporotic mouse model.J Orthop Surg Res. 2025 Feb 1;20(1):128. doi: 10.1186/s13018-025-05504-w. J Orthop Surg Res. 2025. PMID: 39891262 Free PMC article.
-
Multiomics reveals metformin's dual role in gut microbiome remodeling and hepatic metabolic reprogramming for MAFLD intervention.Sci Rep. 2025 Jul 2;15(1):22699. doi: 10.1038/s41598-025-07557-7. Sci Rep. 2025. PMID: 40594788 Free PMC article.
-
Co-delivery of indomethacin and uricase as a new strategy for inflammatory diseases associated with high uric acid.Drug Deliv Transl Res. 2024 Jul;14(7):1820-1838. doi: 10.1007/s13346-023-01487-5. Epub 2023 Dec 21. Drug Deliv Transl Res. 2024. PMID: 38127247
-
Metabolomics combined with intestinal microbiota reveals the mechanism of compound Qilian tablets against diabetic retinopathy.Front Microbiol. 2024 Aug 16;15:1453436. doi: 10.3389/fmicb.2024.1453436. eCollection 2024. Front Microbiol. 2024. PMID: 39220039 Free PMC article.
References
-
- Anderson MJ, Crist TO, Chase JM, Vellend M, Inouye BD, Freestone AL, Sanders NJ, Cornell HV, Comita LS, Davies KF, et al. . 2011. Navigating the multiple meanings of beta diversity: a roadmap for the practicing ecologist. Ecol Lett. 14(1):19–28. - PubMed
-
- Barton BE. 1997. IL-6: insights into novel biological activities. Clin Immunol Immunopathol. 85(1):16–20. - PubMed
-
- Bian M, Wang J, Wang Y, Nie A, Zhu C, Sun Z, Zhou Z, Zhang B.. 2020. Chicory ameliorates hyperuricemia via modulating gut microbiota and alleviating LPS/TLR4 axis in quail. Biomed Pharmacother. 131:110719. - PubMed
MeSH terms
Substances
LinkOut - more resources
Full Text Sources
Research Materials
Miscellaneous