. 2022 Nov 29:11:e79903.
doi: 10.7554/eLife.79903.

Fixation can change the appearance of phase separation in living cells

Affiliations

Fixation can change the appearance of phase separation in living cells

Shawn Irgen-Gioro et al. Elife. .

Abstract

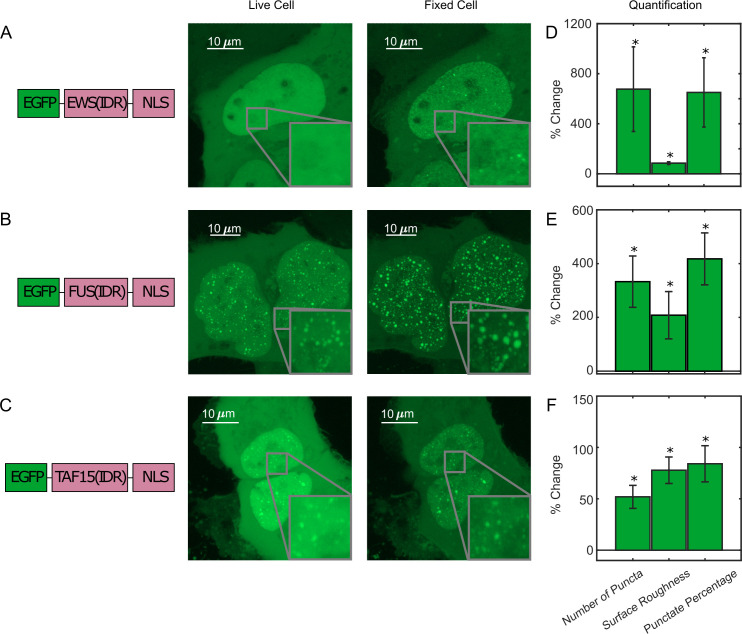
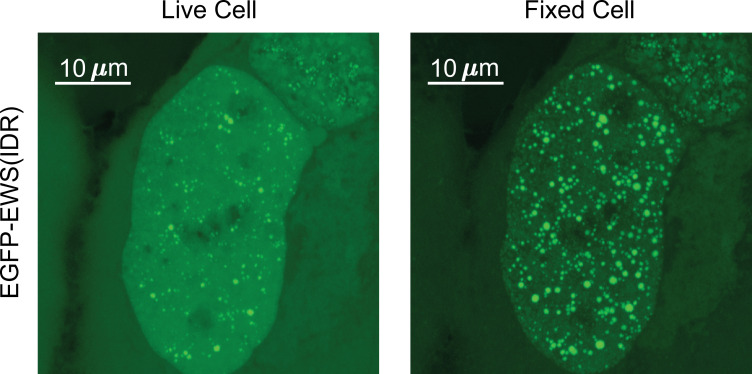
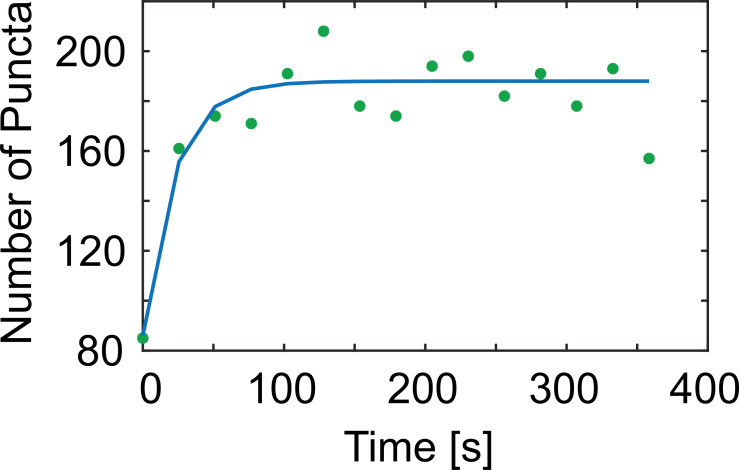
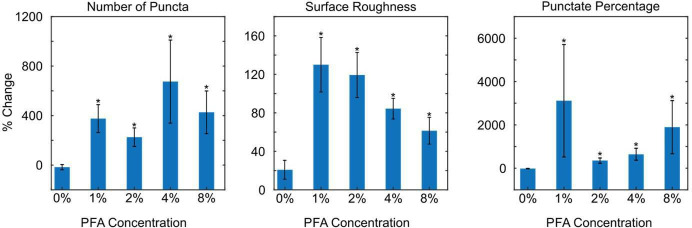
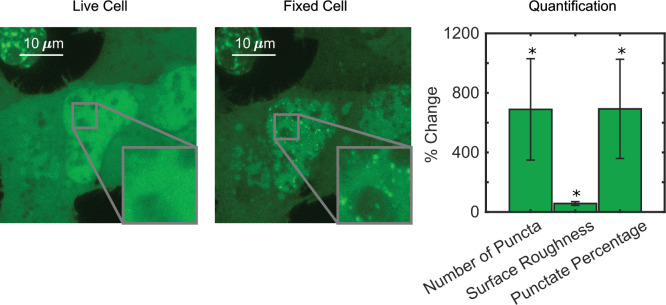
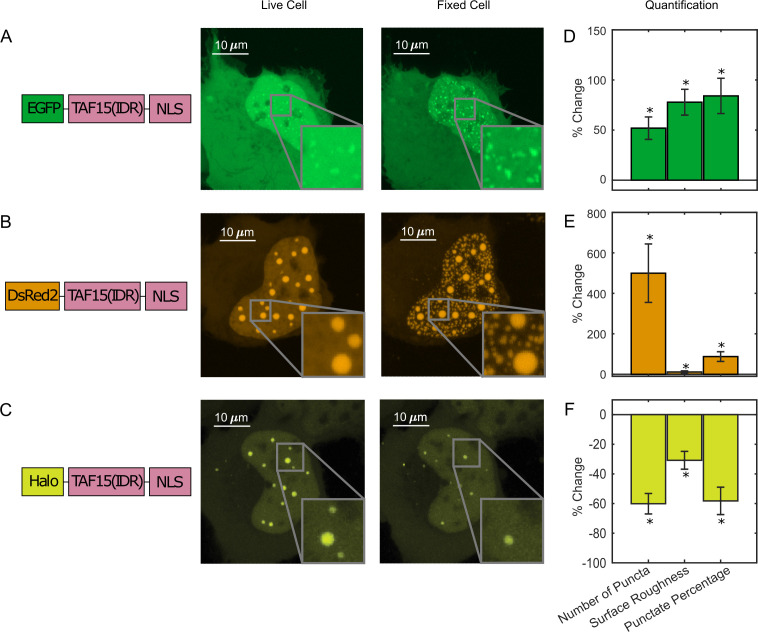
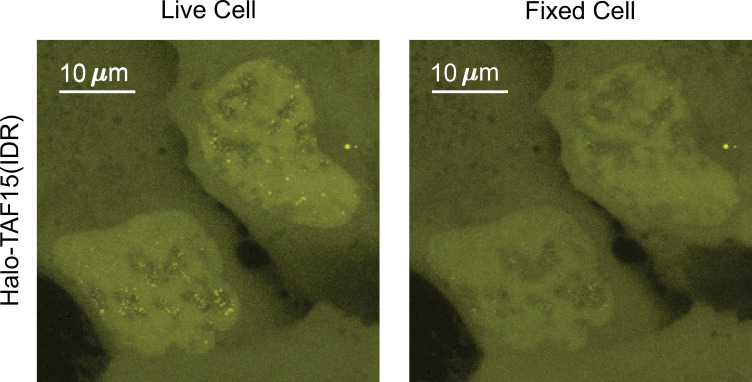
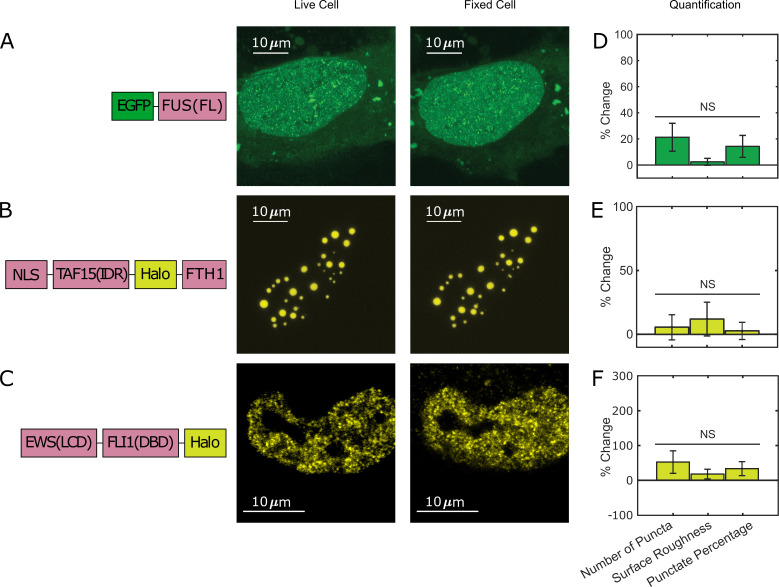
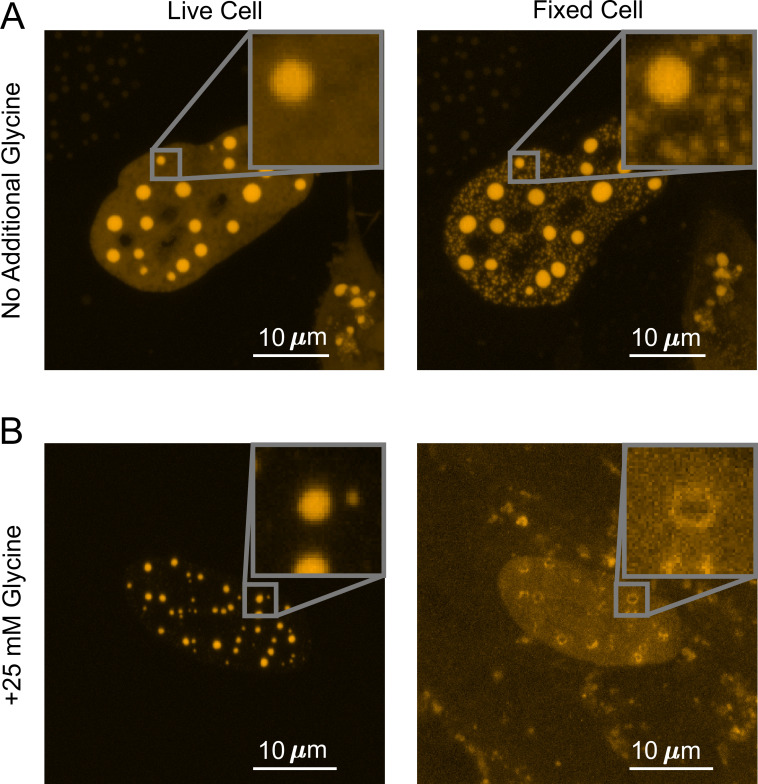
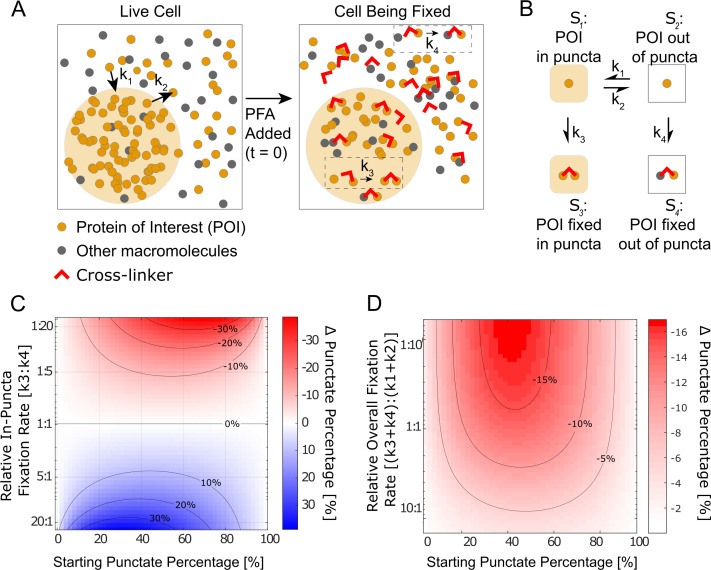
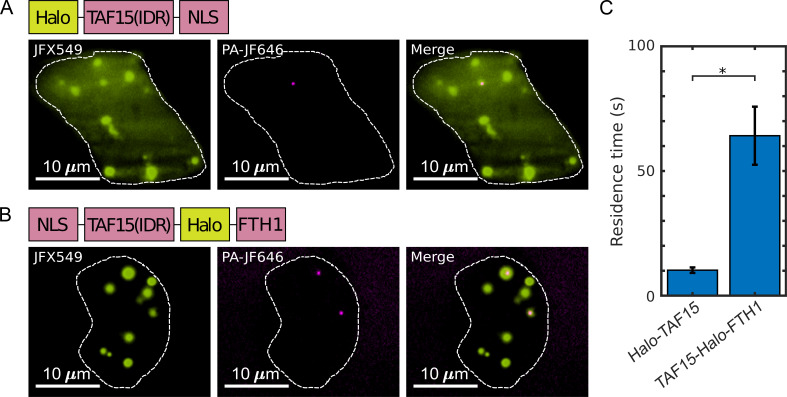
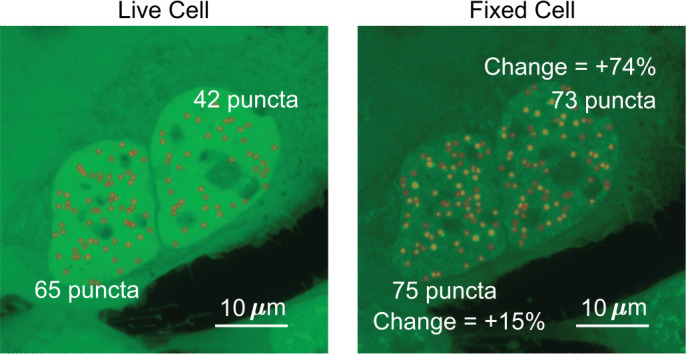
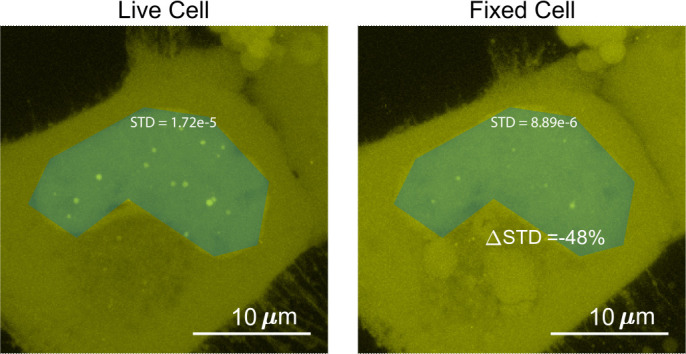
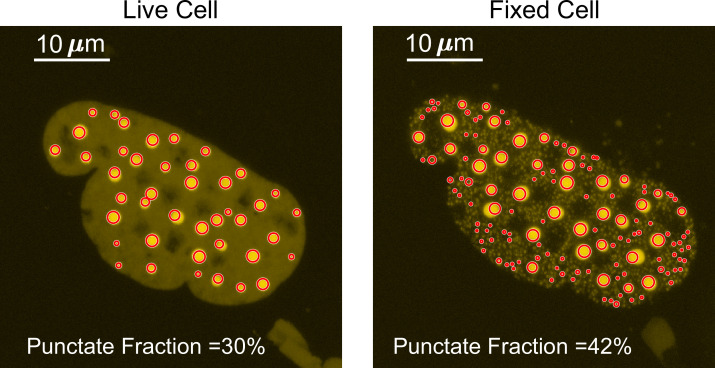
Fixing cells with paraformaldehyde (PFA) is an essential step in numerous biological techniques as it is thought to preserve a snapshot of biomolecular transactions in living cells. Fixed-cell imaging techniques such as immunofluorescence have been widely used to detect liquid-liquid phase separation (LLPS) in vivo. Here, we compared images, before and after fixation, of cells expressing intrinsically disordered proteins that are able to undergo LLPS. Surprisingly, we found that PFA fixation can both enhance and diminish putative LLPS behaviors. For specific proteins, fixation can even cause their droplet-like puncta to artificially appear in cells that do not have any detectable puncta in the live condition. Fixing cells in the presence of glycine, a molecule that modulates fixation rates, can reverse the fixation effect from enhancing to diminishing LLPS appearance. We further established a kinetic model of fixation in the context of dynamic protein-protein interactions. Simulations based on the model suggest that protein localization in fixed cells depends on an intricate balance of protein-protein interaction dynamics, the overall rate of fixation, and notably, the difference between fixation rates of different proteins. Consistent with simulations, live-cell single-molecule imaging experiments showed that a fast overall rate of fixation relative to protein-protein interaction dynamics can minimize fixation artifacts. Our work reveals that PFA fixation changes the appearance of LLPS from living cells, presents a caveat in studying LLPS using fixation-based methods, and suggests a mechanism underlying the fixation artifact.

Keywords: cell biology; cross-linking; fixation; intrinsically disordered proteins; liquid–liquid phase separation; live-cell single-molecule imaging; multivalent protein–protein interactions; none; paraformaldehyde; physics of living systems.

Plain language summary

A typical human cell is a crowded soup of thousands of different proteins. One way that the cell organizes this complex mix of contents is by creating separate droplets within the cell, like oil in water. These droplets can form through a process known as liquid-liquid phase separation, or LLPS, where specific proteins gather in high concentrations to carry out their cellular roles. The critical role of LLPS in cellular organization means that it is widely studied by biologists. To detect LLPS, researchers often subject the cells to treatments designed to hold all the proteins in place, creating a snapshot of their natural state. This process, known as fixing, allows scientists to easily label a protein with a fluorescent tag, take pictures of the cells, and look at whether the protein forms droplets in its natural state. This is often easier to do than imaging cells live, but it relies on LLPS being well-preserved upon fixation. To test if this is true, Irgen-Gioro, Yoshida et al. looked at protein droplets in live cells, and then fixed the cells to check whether the appearance of the droplets had changed. The images taken showed that fixation could alter the size and number of droplets depending on the protein being studied. To explain why the effects of fixing change depending on the protein, Irgen-Gioro, Yoshida et al. hypothesized that a faster fixation – relative to how quickly proteins can bind and unbind to their droplets – can better preserve the LLPS droplets. They verified their idea using a microscopy technique in which they imaged single molecules, allowing them to see how different fixation speeds relative to protein binding affected the droplets. The work of Irgen-Gioro, Yoshida et al. identifies an important caveat to using fixation for the study of LLPS in cells. Their findings suggest that researchers should be cautious when interpreting the results of such studies. Given that LLPS in cells is an area of research with a lot of interest, these results could benefit a broad range of biological and medical fields. In the future, Irgen-Gioro, Yoshida et al.’s findings could prompt scientists to develop new fixing methods that better preserve LLPS in cells.


Conflict of interest statement

SI, SY, VW, SC No competing interests declared

Figures

Figure 1.
Figure 1.. Fixation can change the apparent liquid–liquid phase separation (LLPS) behaviors of proteins.
(A) EGFP-EWS(IDR), (B) EGFP-FUS(IDR), and (C) EGFP-TAF15(IDR) are transiently expressed in U2OS cells and imaged before and after fixation using confocal fluorescence microscopy. A schematic of each protein construct is shown on the left. A maximum z-projection of a representative live cell expressing its respective protein is shown next to that of the same cell after 10 min of fixation with 4% paraformaldehyde (PFA). The inserts show a zoomed-in region of the cell. (D–F) Quantification of percentage change of LLPS parameters after fixation. The values are averaged from 34 (D), 17 (E), or 24 (F) cells measured in 3 (D), 2 (E), or 2 (F) independent transfection and imaging sessions. Error bars represent standard errors. Asterisks indicate a significant difference compared with 0 (p<0.05, Wilcoxon signed-rank test).
Figure 1—figure supplement 1.
Figure 1—figure supplement 1.. EGFP-EWS(IDR) can form droplet-like puncta in living cells, which change appearance upon fixation.
The expression level of EGFP-EWS(IDR) here is significantly higher than in Figure 1A. After paraformaldehyde (PFA) fixation, additional puncta appear, and pre-existing puncta get bigger and brighter relative to the nucleoplasm, consistent with the trend shown in Figure 1A.
Figure 1—figure supplement 2.
Figure 1—figure supplement 2.. Quantification of Video 1 shows the number of EGFP-FUS(IDR) puncta in the cell as a function of the length of paraformaldehyde (PFA) treatment.
Fixation is complete in ~100 s. The green scattered plot represents actual data points, and the blue line plot is to guide the eye.
Figure 1—figure supplement 3.
Figure 1—figure supplement 3.. Fixation at various paraformaldehyde (PFA) concentrations can change the apparent liquid–liquid phase separation (LLPS) behaviors of EGFP-EWS(IDR).
We show the percentage change of LLPS parameters after 10 min of fixation. The values are averaged from 10 (0% PFA, PBS buffer only), 20 (1% PFA), 20 (2% PFA), 34 (4% PFA), or 20 (8% PFA) cells. Error bars represent standard errors. Asterisks indicate a significant difference of the values compared with 0 (p<0.05, Wilcoxon signed-rank test). All the tested concentrations of PFA except for 0% PFA (PBS only) result in a significant change of the LLPS parameters. A quantitative comparison between the results at different PFA concentrations is difficult due to increased fluorescence quenching effects at higher concentrations of PFA. We thus focus on comparing the percentage change of LLPS parameters with 0 and with that upon treatment of PBS only.
Figure 1—figure supplement 4.
Figure 1—figure supplement 4.. Fixation using paraformaldehyde/glutaraldehyde (PFA/GA) in combination still changes the apparent liquid–liquid phase separation (LLPS) behaviors of EGFP-EWS(IDR).
Adding 0.2% GA to 4% PFA does not reduce the fixation artifact. The fixed-cell image was taken 10 min after PFA/GA treatment. Percentage change of LLPS parameters after PFA/GA fixation is significantly different from 0, but not significantly different from the percentage change upon PFA only fixation (Figure 1D). The values here are averaged from 20 cells measured in one transfection and imaging session. Error bars represent standard errors. Asterisks indicate a significant difference compared with 0 (p<0.05, Wilcoxon signed-rank test).
Figure 2.
Figure 2.. Paraformaldehyde (PFA) fixation can both enhance and diminish liquid–liquid phase separation (LLPS) appearance.
U2OS cells expressing (A) EGFP-TAF15(IDR), (B) DsRed2-TAF15(IDR), and (C) Halo-TAF15(IDR), ligated with the JFX549 Halo ligand, are imaged using confocal fluorescence microscopy before and after 10 min of fixation with 4% PFA. Schematics of the protein constructs are shown on the left. Live- and fixed-cell images are compared. (D–F) Quantification of LLPS parameters after fixation. The values are averaged from 24 (D), 23 (E), or 10 (F) cells measured in 2 (D), 2 (E), or 3 (F) independent transfection and imaging sessions. Error bars represent standard errors. Asterisks indicate a significant difference compared with 0 (p<0.05, Wilcoxon signed-rank test).
Figure 2—figure supplement 1.
Figure 2—figure supplement 1.. Fixation can diminish liquid–liquid phase separation (LLPS) appearance.
Two U2OS cells expressing Halo-TAF15(IDR) are side-by-side in the same field of view. Puncta formed in live-cell nuclei disappeared after fixation.
Figure 3.
Figure 3.. Not all puncta-forming proteins show the fixation artifact.
U2OS cells expressing (A) EGFP-FUS(FL) and (B) TAF15(IDR)-Halo-FTH1, and (C) an A673 cell expressing endogenous EWS::FLI1-Halo are imaged using confocal fluorescence microscopy before and after 10 min of fixation with 4% paraformaldehyde (PFA). Halo-tagged proteins are ligated with the JFX549 Halo ligand before imaging. Schematics of the protein constructs are shown on the left. Live- and fixed-cell images are compared. (D–F) Quantification of puncta parameters after fixation. The values are averaged from 21 (D), 16 (E), or 15 (F) cells measured in 1 (D), 4 (E), or 2 (F) independent transfection and imaging sessions. Error bars represent standard errors. NS: not significant difference compared with 0 (p<0.05, Wilcoxon signed-rank test). None of the examined proteins show significant changes in their liquid–liquid phase separation (LLPS) or hub appearance in the fixed-cell image as compared to the live-cell image.
Figure 4.
Figure 4.. Competitive fixation pathway creates a reversed fixation artifact.
(A) Fixing U2OS cells that express DsRed2-TAF15(IDR) in the absence of additional glycine causes many small puncta to appear. (B) Fixing cells in the presence of 25 mM additional glycine results in a reduction in the number of puncta, with large puncta forming ‘donut’ shapes. In both (A) and (B), cells are imaged using confocal fluorescence microscopy before and after 10 min of fixation with 4% paraformaldehyde (PFA).
Figure 5.
Figure 5.. Kinetic simulation explains bifurcating fixation artifacts.
(A) Schematic that describes fixation of a phase-separating protein of interest (POI) in the cell. (B) The four-state kinetic model with associated kinetic rates connecting the different states. (C) Simulation of the fixation artifact as a function of the starting punctate percentage and the relative in-puncta fixation rate k3:k4 , assuming the overall fixation rate as well as overall protein binding and dissociation rates are constant (k3+k4=0.2, k1+k2=1). Faster in-puncta fixation causes liquid–liquid phase separation (LLPS) behavior to be over-represented (blue). Slower in-puncta fixation causes LLPS behavior to be under-represented (red). (D) Simulation of the fixation artifact as a function of the starting punctate percentage and the relative overall fixation rate (k3+k4):(k1+k2), assuming individual fixation rates are constant (k3=1, k4=2). Fast overall fixation rate compared with protein–protein interaction dynamics decreases the fixation artifact. (C) and (D) were simulated over starting punctate percentages ranging from 0% (k1=0, k2=1) to 100% (k1=1, k2=0). Level curves are marked on (C) and (D).
Figure 6.
Figure 6.. The residence times of proteins in their droplet-like puncta vary.
Shown are individual frames from two-color single-molecule movies of (A) Halo-TAF15(IDR) and (B) TAF15(IDR)-Halo-FTH1. Each protein was labeled with a lower concentration of a photoactivatable dye for SPT (20 nM PA-JF646, magenta) and a higher concentration of non-photoactivatable dye for visualization of the droplet-like puncta (100 nM JFX549, yellow). A white dashed line outlines the nucleus. (C) The mean residence time of TAF15(IDR)-Halo-FTH1 in its puncta is significantly longer than that of Halo-TAF15(IDR) in its puncta. The value for each protein is averaged from 20 cells measured in three independent transfection and imaging sessions. Error bars represent standard errors. Asterisk indicates a significant difference between the two proteins (p<0.05, Wilcoxon rank-sum test).
Figure 7.
Figure 7.. Determination of the number of puncta in the cell nucleus.
Two cells expressing EGFP-TAF15(IDR) have the number of puncta before and after fixation compared. The cell on the left shows an increase of 10 puncta, a change of 15%. The cell on the right shows an increase of 31 puncta, a change of 74%.
Figure 8.
Figure 8.. Determination of the surface roughness of a cell nucleus image.
We drew a blue patch that covers the nucleus of a cell expressing Halo-TAF15(IDR) and compared the standard deviation of the pixel intensity within the blue patch before and after fixation. The change in standard deviation between the two images is –48%.
Figure 9.
Figure 9.. Determination of the punctate percentage.
The punctate percentage of DsRed2-TAF15(IDR) is compared before and after fixation. The red circles represent the boundary within which the integrated fluorescence is considered ‘in puncta’.

Comment in

  • When fixation creates fiction.
    Miné-Hattab J. Miné-Hattab J. Elife. 2023 Feb 16;12:e85671. doi: 10.7554/eLife.85671. Elife. 2023. PMID: 36795466 Free PMC article.

Similar articles

Cited by

References

    1. Alberti S, Gladfelter A, Mittag T. Considerations and challenges in studying liquid-liquid phase separation and biomolecular condensates. Cell. 2019;176:419–434. doi: 10.1016/j.cell.2018.12.035. - DOI - PMC - PubMed
    1. Altmeyer M, Neelsen KJ, Teloni F, Pozdnyakova I, Pellegrino S, Grøfte M, Rask M-BD, Streicher W, Jungmichel S, Nielsen ML, Lukas J. Liquid demixing of intrinsically disordered proteins is seeded by poly (ADP-ribose) Nature Communications. 2015;6:1–12. doi: 10.1038/ncomms9088. - DOI - PMC - PubMed
    1. Banani SF, Lee HO, Hyman AA, Rosen MK. Biomolecular condensates: organizers of cellular biochemistry. Nature Reviews. Molecular Cell Biology. 2017;18:285–298. doi: 10.1038/nrm.2017.7. - DOI - PMC - PubMed
    1. Bellapadrona G, Elbaum M. Supramolecular protein assemblies in the nucleus of human cells. Angewandte Chemie. 2014;53:1534–1537. doi: 10.1002/anie.201309163. - DOI - PubMed
    1. Berry J, Weber SC, Vaidya N, Haataja M, Brangwynne CP. Rna transcription modulates phase transition-driven nuclear body assembly. PNAS. 2015;112:E5237–E5245. doi: 10.1073/pnas.1509317112. - DOI - PMC - PubMed

Publication types

MeSH terms

Substances