. 2022 Nov 29:11:e77599.
doi: 10.7554/eLife.77599.

Improving the accuracy of single-trial fMRI response estimates using GLMsingle

Affiliations

Improving the accuracy of single-trial fMRI response estimates using GLMsingle

Jacob S Prince et al. Elife. .

Abstract

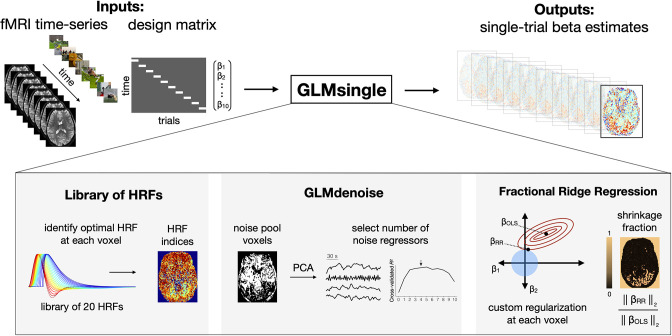
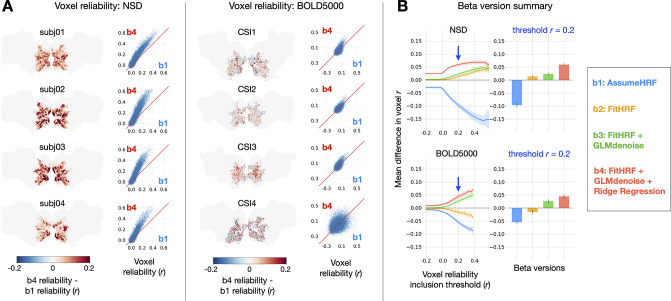
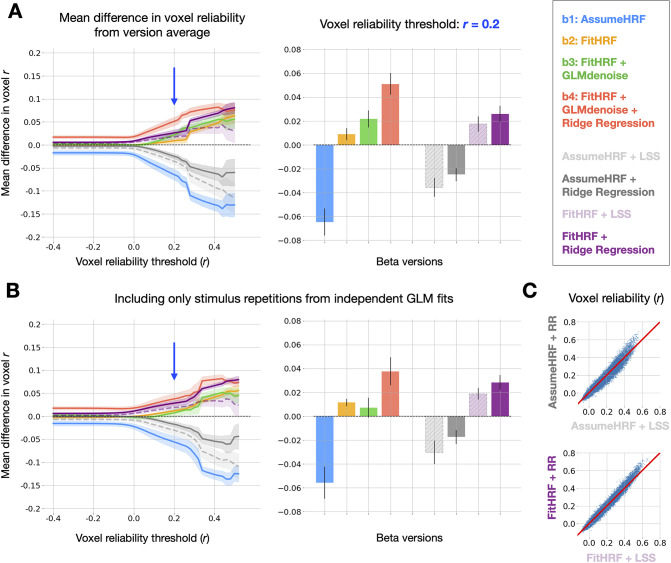
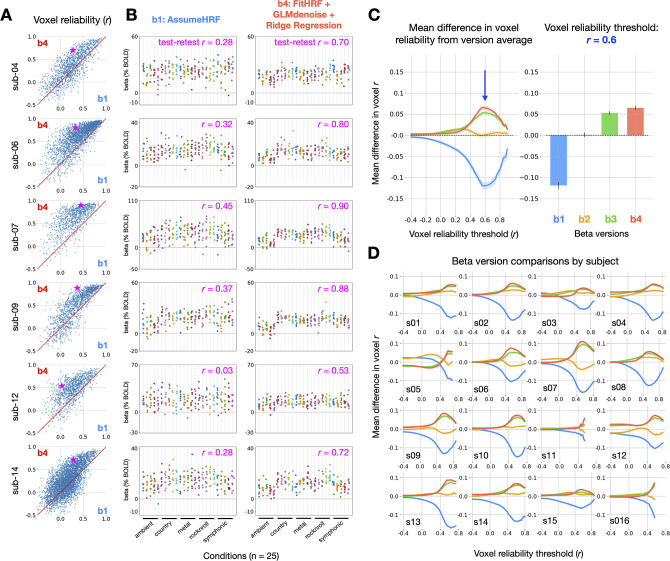
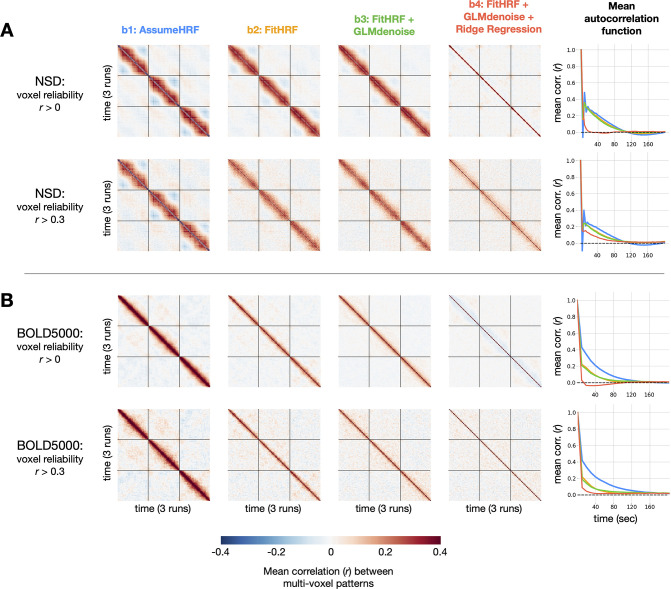
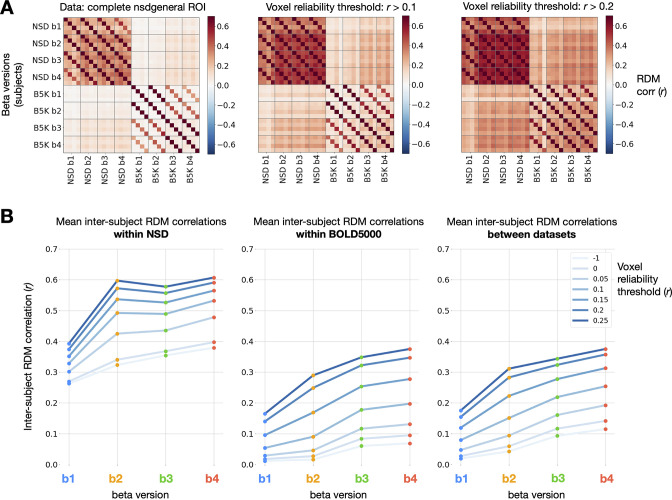
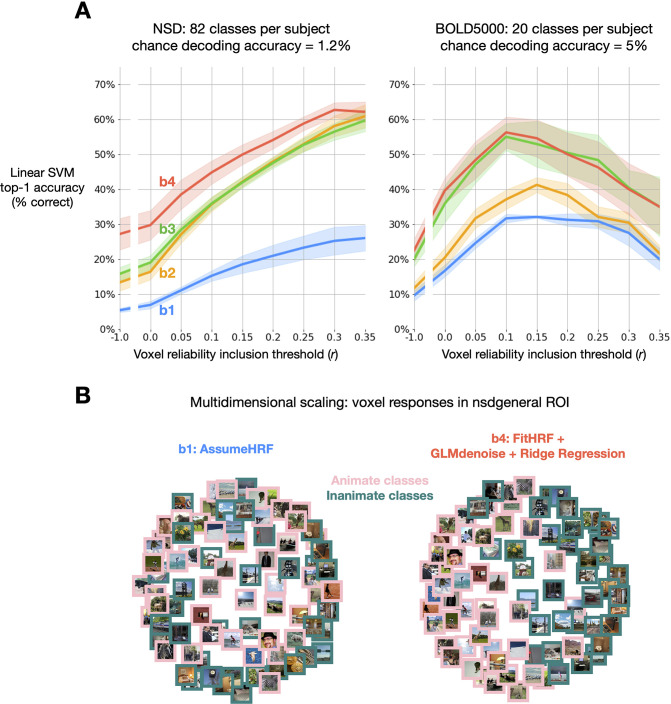
Advances in artificial intelligence have inspired a paradigm shift in human neuroscience, yielding large-scale functional magnetic resonance imaging (fMRI) datasets that provide high-resolution brain responses to thousands of naturalistic visual stimuli. Because such experiments necessarily involve brief stimulus durations and few repetitions of each stimulus, achieving sufficient signal-to-noise ratio can be a major challenge. We address this challenge by introducing GLMsingle, a scalable, user-friendly toolbox available in MATLAB and Python that enables accurate estimation of single-trial fMRI responses (glmsingle.org). Requiring only fMRI time-series data and a design matrix as inputs, GLMsingle integrates three techniques for improving the accuracy of trial-wise general linear model (GLM) beta estimates. First, for each voxel, a custom hemodynamic response function (HRF) is identified from a library of candidate functions. Second, cross-validation is used to derive a set of noise regressors from voxels unrelated to the experiment. Third, to improve the stability of beta estimates for closely spaced trials, betas are regularized on a voxel-wise basis using ridge regression. Applying GLMsingle to the Natural Scenes Dataset and BOLD5000, we find that GLMsingle substantially improves the reliability of beta estimates across visually-responsive cortex in all subjects. Comparable improvements in reliability are also observed in a smaller-scale auditory dataset from the StudyForrest experiment. These improvements translate into tangible benefits for higher-level analyses relevant to systems and cognitive neuroscience. We demonstrate that GLMsingle: (i) helps decorrelate response estimates between trials nearby in time; (ii) enhances representational similarity between subjects within and across datasets; and (iii) boosts one-versus-many decoding of visual stimuli. GLMsingle is a publicly available tool that can significantly improve the quality of past, present, and future neuroimaging datasets sampling brain activity across many experimental conditions.

Keywords: GLM; MVPA; RSA; denoising; fMRI pre-processing; human; large-scale datasets; neuroscience; voxel reliability.


Conflict of interest statement

JP, IC, JK, JP, MT, KK No competing interests declared

Figures

Figure 1.
Figure 1.. Overview of GLMsingle.
GLMsingle takes as input a design matrix (where each column indicates the onset times for a given condition) and fMRI time-series in either volumetric or surface space, and returns as output an estimate of single-trial BOLD response amplitudes (beta weights). GLMsingle incorporates three techniques designed to optimize the quality of beta estimates: first, the use of a library of hemodynamic response functions (HRFs), where the best-fitting HRF from the library is chosen for each voxel; second, an adaptation of GLMdenoise (Kay et al., 2013) to the single-trial GLM framework, where data-derived nuisance regressors are identified and used to remove noise from beta estimates; and third, an efficient re-parameterization of ridge regression (Rokem and Kay, 2020) as a method for dampening the noise inflation caused by correlated single-trial GLM predictors.
Figure 2.
Figure 2.. Impact of GLMsingle on voxel test-retest reliability. To compute reliability for a given voxel, we measure the test-retest Pearson correlation of GLM beta profiles over repeated presentations of the same stimuli (see Materials and methods).
(A) Differences in reliability between b1 (derived from a baseline GLM) and b4 (the final output of GLMsingle) are plotted within a liberal mask of visual cortex (nsdgeneral ROI). Scatter plots show reliability values for individual voxels. (B) Relative differences in mean reliability within the nsdgeneral ROI. For each voxel, we computed the mean reliability value over all beta versions being considered (b1-b4), and then used this as the basis for thresholding voxels (from Pearson r=- –0.2 – 0.6). At each threshold level, for each beta version, we compute the voxel-wise difference between the reliability of that specific beta version and the mean reliability value, and then average these difference values across voxels within the nsdgeneral ROI. The traces in the first column indicate the mean (+/- SEM) across subjects within each dataset (N = 4 for both NSD and BOLD5000). The bars in the second column indicate subject-averaged differences in reliability at threshold r= 0.2. The relative improvement in reliability due to GLMsingle (b1 vs. b4) tends to increase when examining voxels with higher reliability, and each optimization stage within GLMsingle (HRF fitting, GLMdenoise, ridge regression) confers added benefit to voxel reliability.
Figure 2—figure supplement 1.
Figure 2—figure supplement 1.. Inspection of HRF structure across space and time. Here we examine the optimal HRF indices chosen by GLMsingle within a liberal mask of visual cortex (nsdgeneral ROI) from an example subject (NSD subj01).
(A) Maps of R2 values from an ON-OFF GLM, where all conditions are collapsed into a single predictor (see Materials and methods). ON-OFF R2 values are output by GLMsingle for each of the subject’s 10 experimental sessions, and plotted here are the average R2 values. Voxels are thresholded at three different levels: R2<10 (top row), reflecting relatively inactive voxels, including those outside of gray matter; R2>=10 (middle row), reflecting voxels that are active in response to experimental stimuli; and R2>=50 (bottom row), reflecting voxels that are highly active in response to experimental stimuli. (B) Chosen HRF indices from the first scan session. In active voxels (middle and bottom rows), optimal HRF indices exhibit structure in the form of a low-frequency spatial gradient. (C) Stability of chosen HRF indices across sessions at different ON-OFF R2 thresholds. The optimal HRF indices within the nsdgeneral ROI are extracted for each session, thresholded at different ON-OFF R2 levels, and correlated between each pair of sessions. The inset indicates the average r over the lower triangular portion of each matrix. Optimal HRF indices identified using GLMsingle are stable over different experimental sessions in voxels that are active in response to experimental stimuli.
Figure 3.
Figure 3.. Relative quality of GLMsingle and LSS beta versions. (A) Left panel: relative differences in mean reliability between beta versions.
8 beta versions are compared: b1-b4, and the 4 auxiliary beta versions used to compare GLMsingle and Least-Squares Separate (LSS). LSS betas (dashed traces) are compared to those estimated using fractional ridge regression (RR, solid traces), when using a canonical HRF (LSS, light gray vs. RR, dark gray) and when performing HRF optimization (LSS, light purple vs. RR, dark purple). Right panel: summary of performance at threshold level r= 0.2. Error bars reflect the standard error of the mean, computed over the 8 subjects analyzed from NSD and BOLD5000. Fractional ridge regression yields more reliable signal estimates than LSS across voxel reliability levels. (B) Same as Panel (A), except that reliability computations occur only between image repetitions processed in independent partitions of fMRI data. Qualitative patterns are unchanged. (C) Scatter plots comparing voxel reliability between corresponding LSS and GLMsingle beta versions (top: AssumeHRF; bottom: FitHRF). Plotted are results for an example subject (NSD subj01, nsdgeneral ROI). The advantage of ridge regression over LSS is most apparent in the most reliable voxels.
Figure 4.
Figure 4.. Impact of GLMsingle on reliability in the StudyForrest music-listening task. (A) Differences in voxel test-retest reliability (Pearson r) between b1 (a baseline GLM) and b4 (the final output of GLMsingle) are plotted for individual voxels.
Only voxels that are active in response to experimental stimuli (ON-OFF R2>5) are plotted. (B) Estimated beta values (% BOLD change) for b1 and b4 in a hand-selected auditory cortex voxel from 6 representative subjects. Chosen voxels are indicated with pink stars in panel A. Each column represents one of 25 experimental conditions, with each condition presented 8 times. Test-retest reliability values reflect the split-half correlation between groups of 4 trial repetitions, averaged over all possible splits of the available repetitions (70 unique splits). (C) Relative differences in mean reliability between beta versions b1 - b4, computed using the same procedure as used for NSD and BOLD5000 (see Figure 2). Traces indicate the mean (+/- SEM) across subjects (N = 16). The bar graph (right) indicates the subject-averaged differences in reliability at threshold r=0.6. (D) Relative differences in mean reliability over different reliability inclusion thresholds are plotted for each subject.
Figure 5.
Figure 5.. Impact of GLMsingle on temporal autocorrelation. For each dataset, we compute the degree of temporal autocorrelation in each beta version by averaging session-wise representational similarity matrices over subjects.
We plot results arising from analysis of voxels at two different reliability thresholds (r= 0 and r= 0.3) for NSD (A) and BOLD5000 (B). Assuming that ground-truth neural responses to consecutive trials should be uncorrelated on average, positive (or negative) Pearson r values off the diagonal imply suboptimal estimation of BOLD responses. In the right-most column, we plot mean autocorrelation between all pairs of timepoints. Applying GLMsingle (b4) results in a substantial decrease in temporal autocorrelation compared to a baseline GLM approach (b1).
Figure 6.
Figure 6.. Impact of GLMsingle on inter-subject RDM correlations.
(A) Correlations of RDMs across all pairs of subjects and beta versions, at 3 different voxel reliability thresholds. We compute RDMs for each subject and beta version using Pearson dissimilarity (1 - r) over repetition-averaged betas within the nsdgeneral ROI. Grid lines separate beta versions from one another, an individual cell reflects the RDM correlation between one pair of subjects, and cross-dataset comparisons occupy the top-right and bottom-left quadrants of the matrices. (B) Mean inter-subject RDMs correlations within NSD (N = 4; left), within BOLD5000 (N = 4; center), and between the two datasets (N = 16 subject pairs; right). GLMsingle (b4) yields a considerable strengthening of RDM correspondence for each subject pair being considered, within and between datasets.
Figure 7.
Figure 7.. Impact of GLMsingle on image-level MVPA decoding accuracy.
(A) Image-level linear SVM decoding accuracy by beta version. At each reliability threshold, we compute the mean decoding accuracy over subjects within each dataset, as well as the standard error of the mean (N = 4 for NSD; N = 3 for BOLD5000). Classifiers are trained on n-1 available image repetitions, and tested on the held-out repetition, with accuracy averaged over cross-validation folds. Applying GLMsingle (b4) yields dramatic increases in image decodability compared to a baseline GLM (b1). (B) The effect of GLMsingle on animacy representation is shown in an example NSD subject (subj01) using multidimensional scaling. GLMsingle clarifies the division in representational space between stimuli containing animate and inanimate objects.

References

    1. Abdulrahman H, Henson RN. Effect of trial-to-trial variability on optimal event-related fmri design: implications for beta-series correlation and multi-voxel pattern analysis. NeuroImage. 2016;125:756–766. doi: 10.1016/j.neuroimage.2015.11.009. - DOI - PMC - PubMed
    1. Allen EJ, St-Yves G, Wu Y, Breedlove JL, Prince JS, Dowdle LT, Nau M, Caron B, Pestilli F, Charest I, Hutchinson JB, Naselaris T, Kay K. A massive 7T fMRI dataset to bridge cognitive neuroscience and artificial intelligence. Nature Neuroscience. 2022;25:116–126. doi: 10.1038/s41593-021-00962-x. - DOI - PubMed
    1. Bai B, Kantor P. A shape-based finite impulse response model for functional brain images. 2007 4th IEEE International Symposium on Biomedical Imaging: From Nano to Macro; 2007. pp. 440–443. - DOI
    1. Bao P, She L, McGill M, Tsao DY. A map of object space in primate inferotemporal cortex. Nature. 2020;583:103–108. doi: 10.1038/s41586-020-2350-5. - DOI - PMC - PubMed
    1. Blauch NM, Behrmann M, Plaut DC. A connectivity-constrained computational account of topographic organization in primate high-level visual cortex. PNAS. 2022;119:e2112566119. doi: 10.1073/pnas.2112566119. - DOI - PMC - PubMed

Publication types