. 2023 Jan;10(3):e2203718.
doi: 10.1002/advs.202203718. Epub 2022 Nov 29.

STING Suppresses Mitochondrial VDAC2 to Govern RCC Growth Independent of Innate Immunity

Affiliations

STING Suppresses Mitochondrial VDAC2 to Govern RCC Growth Independent of Innate Immunity

Zhichuan Zhu et al. Adv Sci (Weinh). 2023 Jan.

Abstract

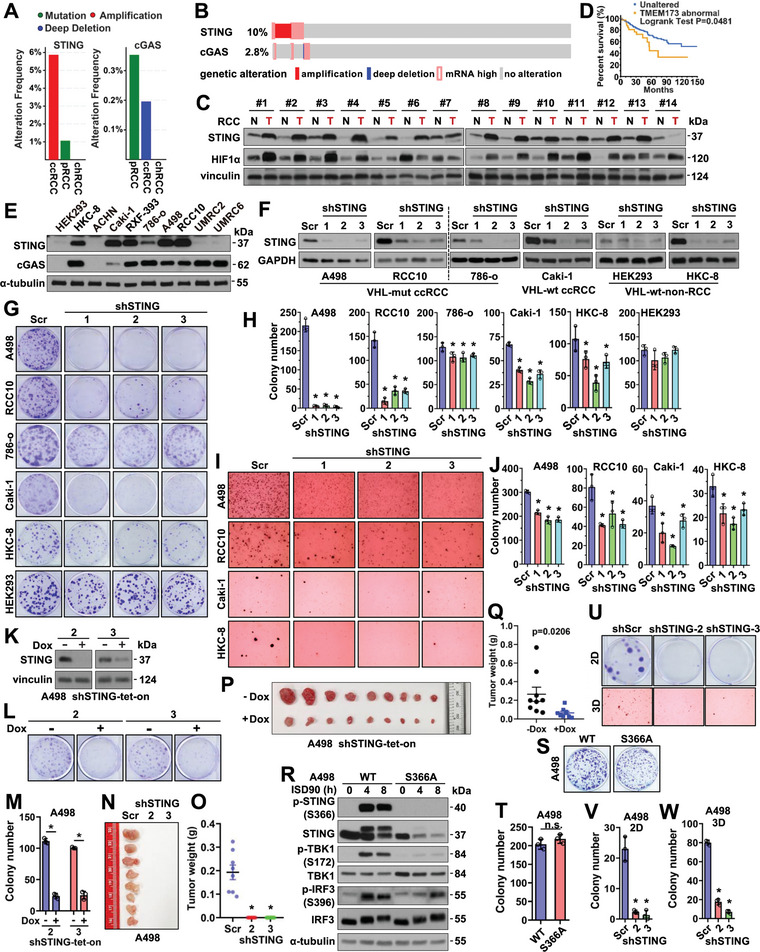
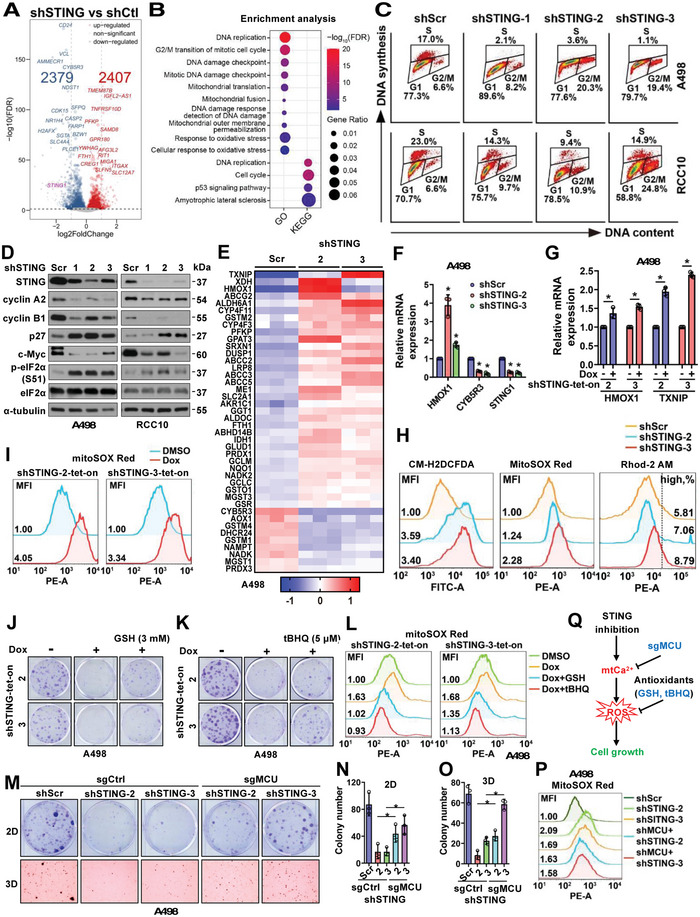
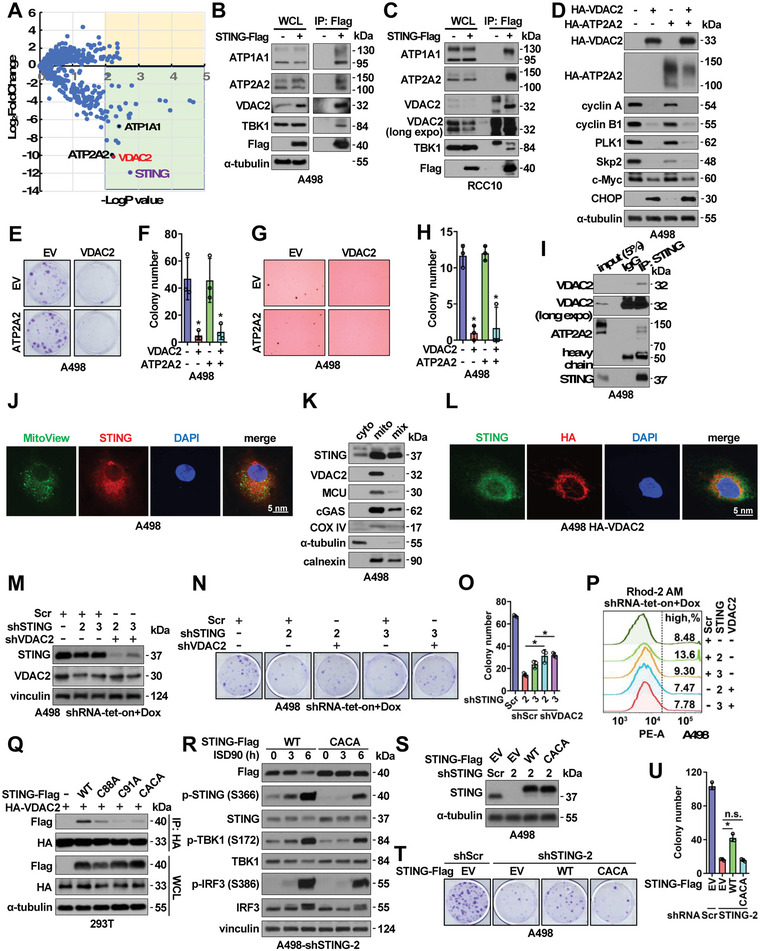
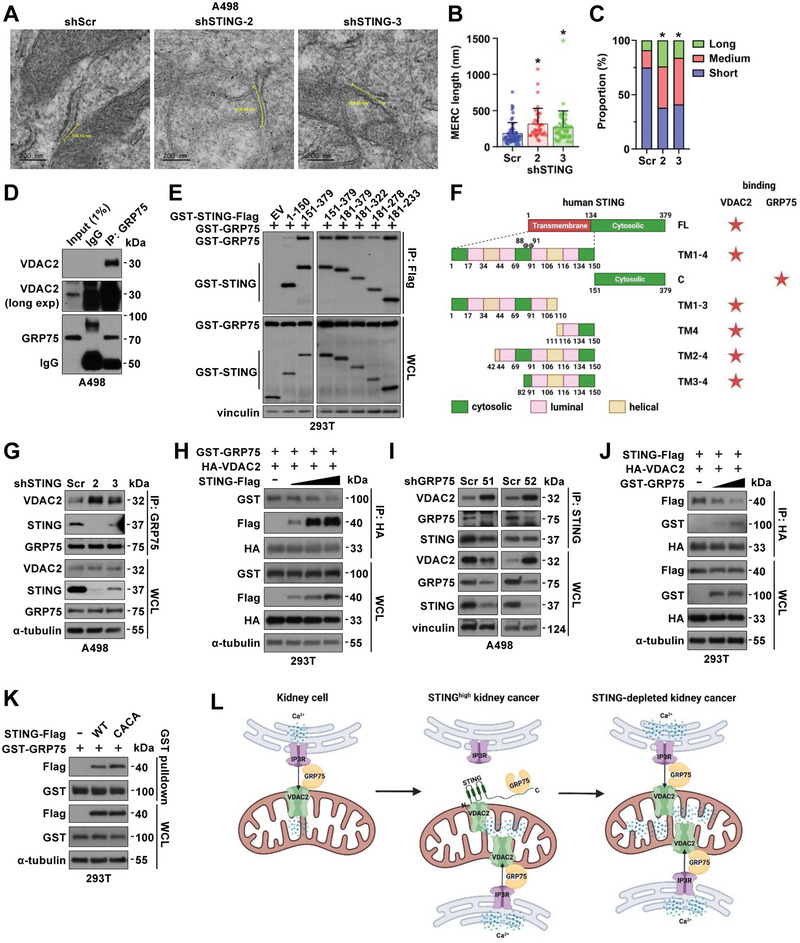
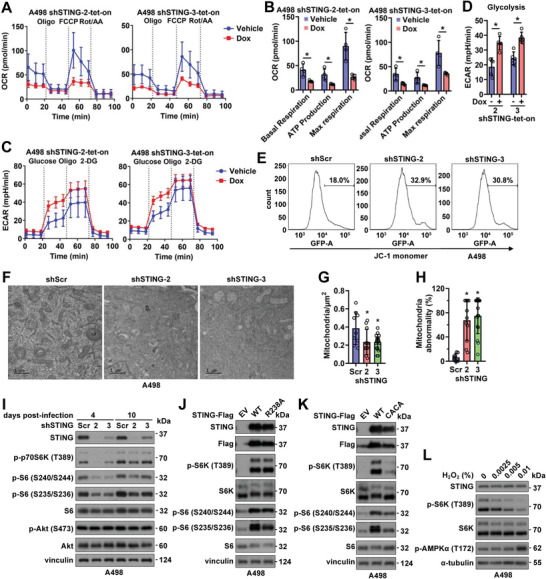
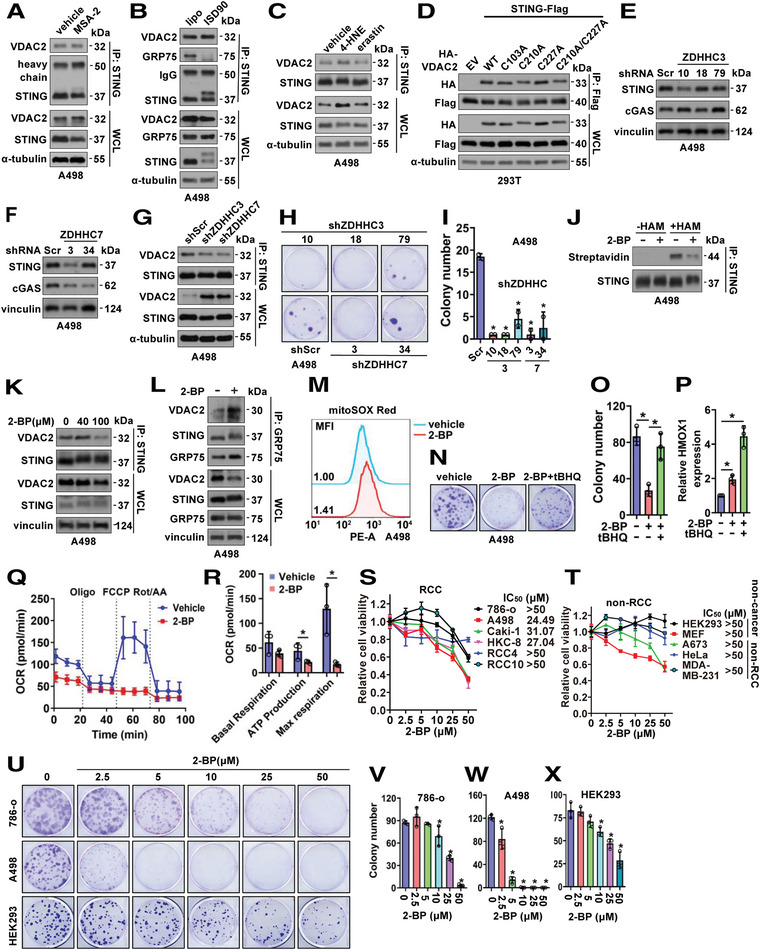
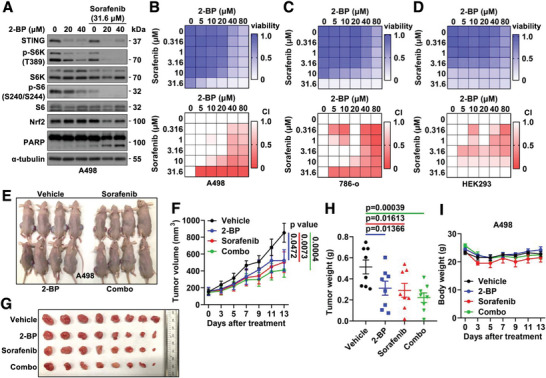
STING is an innate immune sensor for immune surveillance of viral/bacterial infection and maintenance of an immune-friendly microenvironment to prevent tumorigenesis. However, if and how STING exerts innate immunity-independent function remains elusive. Here, the authors report that STING expression is increased in renal cell carcinoma (RCC) patients and governs tumor growth through non-canonical innate immune signaling involving mitochondrial ROS maintenance and calcium homeostasis. Mitochondrial voltage-dependent anion channel VDAC2 is identified as a new STING binding partner. STING depletion potentiates VDAC2/GRP75-mediated MERC (mitochondria-ER contact) formation to increase mitochondrial ROS/calcium levels, impairs mitochondria function, and suppresses mTORC1/S6K signaling leading to RCC growth retardation. STING interaction with VDAC2 occurs through STING-C88/C91 palmitoylation and inhibiting STING palmitoyl-transferases ZDHHCs by 2-BP significantly impedes RCC cell growth alone or in combination with sorafenib. Together, these studies reveal an innate immunity-independent function of STING in regulating mitochondrial function and growth in RCC, providing a rationale to target the STING/VDAC2 interaction in treating RCC.

Keywords: 2-BP; STING; VDAC2; innate immunity-independent; mTORC1; mitochondrial homeostasis.


Conflict of interest statement

The authors declare no conflict of interest.

Figures

Figure 1
Figure 1
Depletion of STING reduces RCC cell growth independent of innate immunity. A) Genetic alteration frequency (mutated, amplified, and deep deleted cases/total cases) of STING or cGAS in indicated RCC patients from the TCGA PanCancer Atlas database. B) Oncoprint showing genetic alteration of STING and cGAS in ccRCC patients from the TCGA PanCancer Atlas database. C) Immuno‐blot (IB) analyses of tumor lysates from normal‐adjacent tissues (N) or RCC tumors (T). D) A Kaplan‐Meier plot showing increased STING expression is associated with worse patient survival in ccRCC. E) IB analyses of WCL derived from indicated RCC cells. F) IB analyses of control and STING‐depleted RCC cells. G) Representative images for 2D colony formation assays using cells from F. H) Quantification of (G). Error bars were calculated as mean+/‐SD, n = 3. *p < 0.05 (one‐way ANOVA test). I, Representative images for 3D soft agar growth assays using cells from (F). J) Quantification of I. Error bars were calculated as mean+/‐SD, n = 3. *p < 0.05 (one‐way ANOVA test). K) IB analysis of WCL derived from shSTING‐tet‐on A498 cells treated with or without 1 µg ml−1 doxycycline. L) Representative images for 2D colony formation from K. M) quantification of L. N,O) Mouse xenograft experiments were performed with indicated A498 cells. 66 days post‐injection, mice were sacrificed, and tumors were dissected (N) and weighed (O). n = 8. *p<0.05 (one‐way ANOVA test). P,Q) Mouse xenograft experiments were performed with teton‐shSTING‐2 A498 cells. Doxycycline was administrated to mice at day 15 post‐injection. 39 days post‐injection, mice were sacrificed, and tumors were dissected (P) and weighed (Q). n = 9. *p<0.05 (one‐way ANOVA test). R) IB analyses of WCL derived from WT or S366A‐knockin A498 cells treated with 5 µg mL−1 ISD90 for indicated periods. S,U) Representative images for 2D colony formation or 3D soft agar growth assays using indicated cells. T,V,W) Quantification of S, U. Error bars were calculated as mean+/‐SD, n = 3. *p < 0.05 (one‐way ANOVA test).
Figure 2
Figure 2
STING depletion in RCC cells increases mitochondria ROS/Ca2+ and cell cycle deregulation. A) A volcano plot indicating 2379 down‐regulated genes and 2407 upregulated genes upon STING depletion in A498 cells by RNA‐Seq analyses. B) Pathway analyses by GO and KEGG as indicated on cellular processes. Fold changes are represented by the sizes of dots and statistical significance is indicated by warm/cold color as indicated. C) Cell cycle analyses by FACS using indicated RCC cells. D) IB analyses of WCL derived from indicated RCC cells depleted of STING. E) A heatmap for indicated statistically significant altered genes associated with Nrf2 signaling from RNA‐Seq analyses in indicated A498 cells. F,G), RT‐PCR analyses of mRNA changes in indicated A498 cells. Error bars were calculated as mean+/‐SD, n = 3. *p < 0.05 (one‐way ANOVA test). H,I) FACS analyses of cellular ROS (CM‐H2DCFDA), mitochondria ROS (MitoSOX Red), and mitochondria Ca2+ (Rhod‐2 AM) in indicated A498 cells. Mean fluorescent intensity (MFI) or high calcium percentage is shown in each histogram panel. J,K,M) Representative images for 2D colony formation assays or 3D soft agar assay using indicated cells. GSH, 3 mM; tBHQ, 5 µM. L,P) FACS analyses of mitochondria ROS (MitoSOX Red) in indicated A498 cells. N,O) Quantification of M. Error bars were calculated as mean+/‐SD, n = 3. *p < 0.05 (one‐way ANOVA test). Q) Schematic model shows that STING inhibition increases mitochondria ROS and suppresses cell growth, which can be rescued by antioxidants like GSH and tBHQ.
Figure 3
Figure 3
STING binds VDAC2 to maintain RCC cell growth. A) A volcano plot showing major STING binding partners from proteomic studies. STING is labeled in purple, and three calcium transporters are as labeled. B,C) IB analyses of Flag‐IP and WCL derived from either A498 (B) or RCC10 (C) stably expressing Flag‐STING through lentiviral infection. D) IB analyses of WCL from A498 cells stably expressing indicated molecules. E–H) Representative images for 2D colony formation assays E or 3D soft agar assays G using cells from D and quantified in F, H. Error bars were calculated as mean+/‐SD, n = 3. *p < 0.05 (one‐way ANOVA test). I) IB analyses of endogenous STING‐IP and inputs from A498 cells. J) Representative immunofluorescent images using A498 cells immune‐stained with an anti‐STING antibody, mitoView, and DAPI. Scale bar represents 5 µm. K) IB analyses of fractionated A498 cell lysates. L) Representative immunofluorescent images using A498 cells stably expressing HA‐VDAC2 by lentiviral infection immune‐stained with an anti‐STING antibody, an anti‐HA antibody, and DAPI. Scale bar represents 5 µm. M) IB analyses of WCL derived from indicated A498 cells depleted of indicated targets by doxycycline treatment. N) Representative images for 2D colony formation assays using cells from M and quantified in O. Error bars were calculated as mean+/‐SD, n = 3. *p < 0.05 (one‐way ANOVA test). P) FACS analyses of mitochondria Ca2+ (Rhod‐2 AM) in indicated A498 cells. Q) IB analyses of HA‐IP and WCL derived from HEK293T cells transfected with indicated DNA constructs. R) IB analyses of WCL derived from ISD90‐treated A498 cells stably expressing WT or CACA (C88A/C91A)‐STING. S) IB analyses of WCL derived from indicated A498 cells. Where indicated, WT or C88A/C91A (CACA)‐STING containing lentiviral viruses were used to generate A498 stable cells, then endogenous STING was depleted by indicated shRNAs via lentiviral infections. T) Representative images for 2D colony formation assays using cells from S and quantified in U. Error bars were calculated as mean+/‐SD, n = 3. *p < 0.05 (one‐way ANOVA test).
Figure 4
Figure 4
STING disrupts MERC and mitochondrial Ca2+ homeostasis through interfering with VDAC2/GRP75 interactions. A) Representative electron microscope images of MERC in shScr and shSTING A498 cells 4 days after virus infection. The scale bar represents 200 nm. Shorter yellow lines between mitochondria outer membrane and ER membrane indicate 30 nm MERC distance. Longer yellow curves or lines between shorter lines indicate MERC length. B,C) Quantification of average MERC length (B) and distribution of MERC length (C) in shScr (n = 56), shSTING‐2 (n = 37), and shSTING‐3 (n = 44) A498 cells. Error bars were calculated as mean+/‐SD. *p < 0.05 (one‐way ANOVA test). Short, medium and long MERC length were defined as length that is <200 nm, 200–400 nm, and >400 nm, respectively. Chi‐square test, shScr versus shSTING‐2, χ 2 = 27.9; shScr versus shSTING‐3, χ 2 = 24.28; df = 2, *p < 0.0001. D) IB analyses of GRP75‐IP and WCL from shSTING A498 cells. E) IB analyses of Flag‐IP and WCL from HEK293T cells transfected with indicated DNA constructs. F) A cartoon illustration to indicate distinct binding domains of VDAC2 and GRP75 on STING. G) IB analyses of GRP75‐IP and WCL from shSTING A498 cells. H,J) IB analyses of HA‐IP and WCL derived from HEK293T cells transfected with indicated DNA constructs. I) IB analyses of STING‐IP and WCL from shGRP75 A498 cells. K) IB analyses of GST‐pulldown and WCL from HEK293T cells transfected with indicated DNA constructs. L) A schematic model showing abundant STING in RCC binds VDAC2 and prevents formation of ER‐mitochondria tethering complex VDAC2‐GRP75, thus maintaining low levels of mitochondria calcium uptake. STING deficiency leads to enhanced VDAC2‐GRP75 interactions to increase MERC facilitating mitochondrial Ca2+ transfer to increase mitochondrial ROS and cellular ROS and leading to RCC cell growth suppression.
Figure 5
Figure 5
STING depletion leads to mitochondrial abnormality, reduced ATP production, and suppression of mTORC1/S6K signaling to inhibit RCC growth. A,C) Normalized OCR (A) and ECAR plots (C) using shSTING‐tet‐on A498 cells with or without 1 mg mL−1 doxycycline treatment for 4 days. Quantifications are shown in B and D. Error bars were calculated as mean+/‐SD, n = 5 or 4. *p < 0.05 (one‐way ANOVA test). E) FACS analyses of mitochondria potential (JC‐1 monomer) in indicated A498 cells. F) Representative images for EM (electron microscopy) analyses of A498 cells 4 days post‐infection by indicated viruses. The scale bar represents 1 µM. G,H) Quantification of the number of mitochondria in each µm2 in G and percentage of abnormal mitochondria in H. Error bars were calculated as mean+/‐SD, n = 9 for shScr, n = 11 for shSTING‐2, n = 16 for shSTING‐3. *p < 0.05 (one‐way ANOVA test). I) IB analysis of WCL derived from A498 cells infected with indicated viruses for either 4 days or 10 days. J,K) IB analysis of WCL from A498 cells stably expressing indicated Flag‐STING by lentiviral infection. L) IB analysis of WCL derived from A498 cells treated with indicated concentrations of H2O2 for 6 h before cell collection.
Figure 6
Figure 6
Inhibition of STING palmitoylation suppresses RCC cell growth. A–C) IB analyses of STING‐IP and WCL derived from A498 cells with indicated treatments. Where indicated, MSA‐2 (50 µM, 24 h in A), ISD90 (5 µg mL−1, 4 h in B), 4‐HNE (50 µM, 24 h in C), erastin (20 µM, 24 h in C) were used to treat A498 cells. D) IB analyses of Flag‐IP and WCL from HEK293T cells transfected with indicated DNA constructs. E,F) IB analyses of A498 cells depleted of indicated ZDHHC by lentiviral infection and selected with 2 µg mL−1 puromycin for 72 h to eliminate non‐infected cells. G) IB analyses of STING‐IP and WCL derived from indicated A498 cells. H) Representative images for 2D colony formation assays using cells from (E,F) and quantified in I. Error bars were calculated as mean+/‐SD, n = 2. *p < 0.05 (one‐way ANOVA test). J) IB analyses of STING immune‐precipitates from control or 2‐BP treated A498 cells. K) IB analyses of STING‐IP and WCL derived from A498 cells treated with indicated doses of 2‐BP for 12 h before cell collection. L) IB analyses of GRP75‐IP and WCL derived from A498 cells treated with 100 µM of 2‐BP for 12 h before cell collection. M) FACS analyses of mitochondria ROS levels (MitoSOX Red) in indicated A498 cells. N) Representative images for 2D colony formation assays using A498 cells treated with 2.5 µM 2‐BP or 10 µM tBHQ and quantified in O. P) RT‐PCR analysis of HMOX1 mRNA expression in A498 cells treated with 40 µM 2‐BP or 10 µM tBHQ for 48 h. Error bars were calculated as mean+/‐SD, n = 3. *p < 0.05 (one‐way ANOVA test). Q) Normalized OCR plots using A498 cells treated with 100 µM 2‐BP for 24 h. Quantification is shown in R. Error bars were calculated as mean+/‐SD, n = 3. *p < 0.05 (one‐way ANOVA test). S,T) Cell viability assays using indicated RCC and non‐RCC cells treated with indicated doses of 2‐BP for 72 h before MTT assays. Error bars were calculated as mean+/‐SD, n = 3. U) Representative images for 2D colony formation assays using A498, 786‐o, and HEK293 cells treated with indicated doses of 2‐BP (one‐time treatment at 24h post cell seeding) and quantified in V–X) Error bars were calculated as mean+/‐SD, n = 3. *p < 0.05 (one‐way ANOVA test).
Figure 7
Figure 7
2‐BP and sorafenib exert a synergy in reducing RCC tumor growth. A) IB analyses of WCL from A498 treated with indicated compounds for 48 h before cell collection. B,C,D) Representative heatmaps for cell viability (upper panels) and combination index (CI, lower panels) in A498 cells (B) treated with indicated doses of compounds for 2 days, in 786‐o cells (C) and HEK293 (D) cells treated with indicated doses of compounds for 4 days. White color units in CI heatmaps indicate no synergistic effects. E) Images for nude mice of indicated treatment groups. F) Tumor volume measurements at indicated days after the start of treatment with indicated compounds. Error bars were calculated as mean+/‐SEM, n = 8. p values are as indicated (two‐way ANOVA followed by Tukey multiple comparison test). G) Isolated tumors from (E) and weighed in H). Error bars were calculated as mean+/‐SEM, n = 8. p values are as indicated (two‐tailed Student t‐test). I) Measurements of mouse body weights at indicated days after treatment of indicated compounds. Error bars were calculated as mean+/‐SEM, n = 4.

References

    1. Akira S., Uematsu S., Takeuchi O., Cell 2006, 124, 783. - PubMed
    1. Sun L., Wu J., Du F., Chen X., Chen Z. J., Science 2013, 339, 786. - PMC - PubMed
    1. Du M., Chen Z. J., Science 2018, 361, 704. - PMC - PubMed
    1. Diner E. J., Burdette D. L., Wilson S. C., Monroe K. M., Kellenberger C. A., Hyodo M., Hayakawa Y., Hammond M. C., Vance R. E., Cell Rep. 2013, 3, 1355. - PMC - PubMed
    1. Ishikawa H., Ma Z., Barber G. N., Nature 2009, 461, 788. - PMC - PubMed

Publication types