Added Value of Next Generation over Sanger Sequencing in Kenyan Youth with Extensive HIV-1 Drug Resistance
- PMID: 36445146
- PMCID: PMC9769539
- DOI: 10.1128/spectrum.03454-22
Added Value of Next Generation over Sanger Sequencing in Kenyan Youth with Extensive HIV-1 Drug Resistance
Abstract
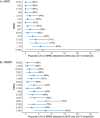
HIV-1 drug resistance testing in children and adolescents in low-resource settings is both important and challenging. New (more sensitive) drug resistance testing technologies may improve clinical care, but evaluation of their added value is limited. We assessed the potential added value of using next-generation sequencing (NGS) over Sanger sequencing for detecting nucleoside reverse transcriptase inhibitor (NRTI) and nonnucleoside reverse transcriptase inhibitor (NNRTI) drug resistance mutations (DRMs). Participants included 132 treatment-experienced Kenyan children and adolescents with diverse HIV-1 subtypes and with already high levels of drug resistance detected by Sanger sequencing. We examined overall and DRM-specific resistance and its predicted impact on antiretroviral therapy and evaluated the discrepancy between Sanger sequencing and six NGS thresholds (1%, 2%, 5%, 10%, 15%, and 20%). Depending on the NGS threshold, agreement between the two technologies was 62% to 88% for any DRM, 83% to 92% for NRTI DRMs, and 73% to 94% for NNRTI DRMs, with more DRMs detected at low NGS thresholds. NGS identified 96% to 100% of DRMs detected by Sanger sequencing, while Sanger identified 83% to 99% of DRMs detected by NGS. Higher discrepancy between technologies was associated with higher DRM prevalence. Even in this resistance-saturated cohort, 12% of participants had higher, potentially clinically relevant predicted resistance detected only by NGS. These findings, in a young, vulnerable Kenyan population with diverse HIV-1 subtypes and already high resistance levels, suggest potential benefits of more sensitive NGS over existing technology. Good agreement between technologies at high NGS thresholds supports their interchangeable use; however, the significance of DRMs identified at lower thresholds to patient care should be explored further. IMPORTANCE HIV-1 drug resistance in children and adolescents remains a significant problem in countries facing the highest burden of the HIV epidemic. Surveillance of HIV-1 drug resistance in children and adolescents is an important public health strategy, particularly in resource-limited settings, and yet, it is limited due mostly to cost and infrastructure constraints. Whether newer and more sensitive next-generation sequencing (NGS) adds substantial value beyond traditional Sanger sequencing in detecting HIV-1 drug resistance in real life settings remains an open and debatable question. In this paper, we attempt to address this issue by performing a comprehensive comparison of drug resistance identified by Sanger sequencing and six NGS thresholds. We conducted this study in a well-characterized, vulnerable cohort of children and adolescents living with diverse HIV-1 subtypes in Kenya and, importantly, failing antiretroviral therapy (ART) with already extensive drug resistance. Our findings suggest a potential added value of NGS over Sanger even in this unique cohort.
Keywords: HIV-1; Sanger sequencing; drug resistance testing; next-generation sequencing.
Conflict of interest statement
The authors declare no conflict of interest.
Figures


References
-
- UNAIDS. 2021. Global AIDS strategy 2021–2026—end inequalities. End AIDS. https://www.unaids.org/sites/default/files/media_asset/global-AIDS-strat.... Accessed 25 July 2022.
-
- WHO. 2021. HIV drug resistance. https://www.who.int/news-room/fact-sheets/detail/hiv-drug-resistance. Accessed 26 July 2022.
-
- WHO. 2021. HIV drug resistance report 2021. https://www.who.int/publications/i/item/9789240038608. Accessed 26 July 2022.
-
- Vermund SH, Blevins M, Moon TD, Jose E, Moiane L, Tique JA, Sidat M, Ciampa PJ, Shepherd BE, Vaz LM. 2014. Poor clinical outcomes for HIV infected children on antiretroviral therapy in rural Mozambique: need for program quality improvement and community engagement. PLoS One 9:e110116. doi:10.1371/journal.pone.0110116. - DOI - PMC - PubMed
Publication types
MeSH terms
Substances
Grants and funding
LinkOut - more resources
Full Text Sources
Medical

