. 2022 Nov 1;6(11):779-789.
doi: 10.4049/immunohorizons.2100065.

B Cell Activation Results in IKK-Dependent, but Not c-Rel- or RelA-Dependent, Decreases in Transcription of the B Cell Tolerance-Inducing Gene Ets1

Affiliations

B Cell Activation Results in IKK-Dependent, but Not c-Rel- or RelA-Dependent, Decreases in Transcription of the B Cell Tolerance-Inducing Gene Ets1

Alyssa Kearly et al. Immunohorizons. .

Abstract

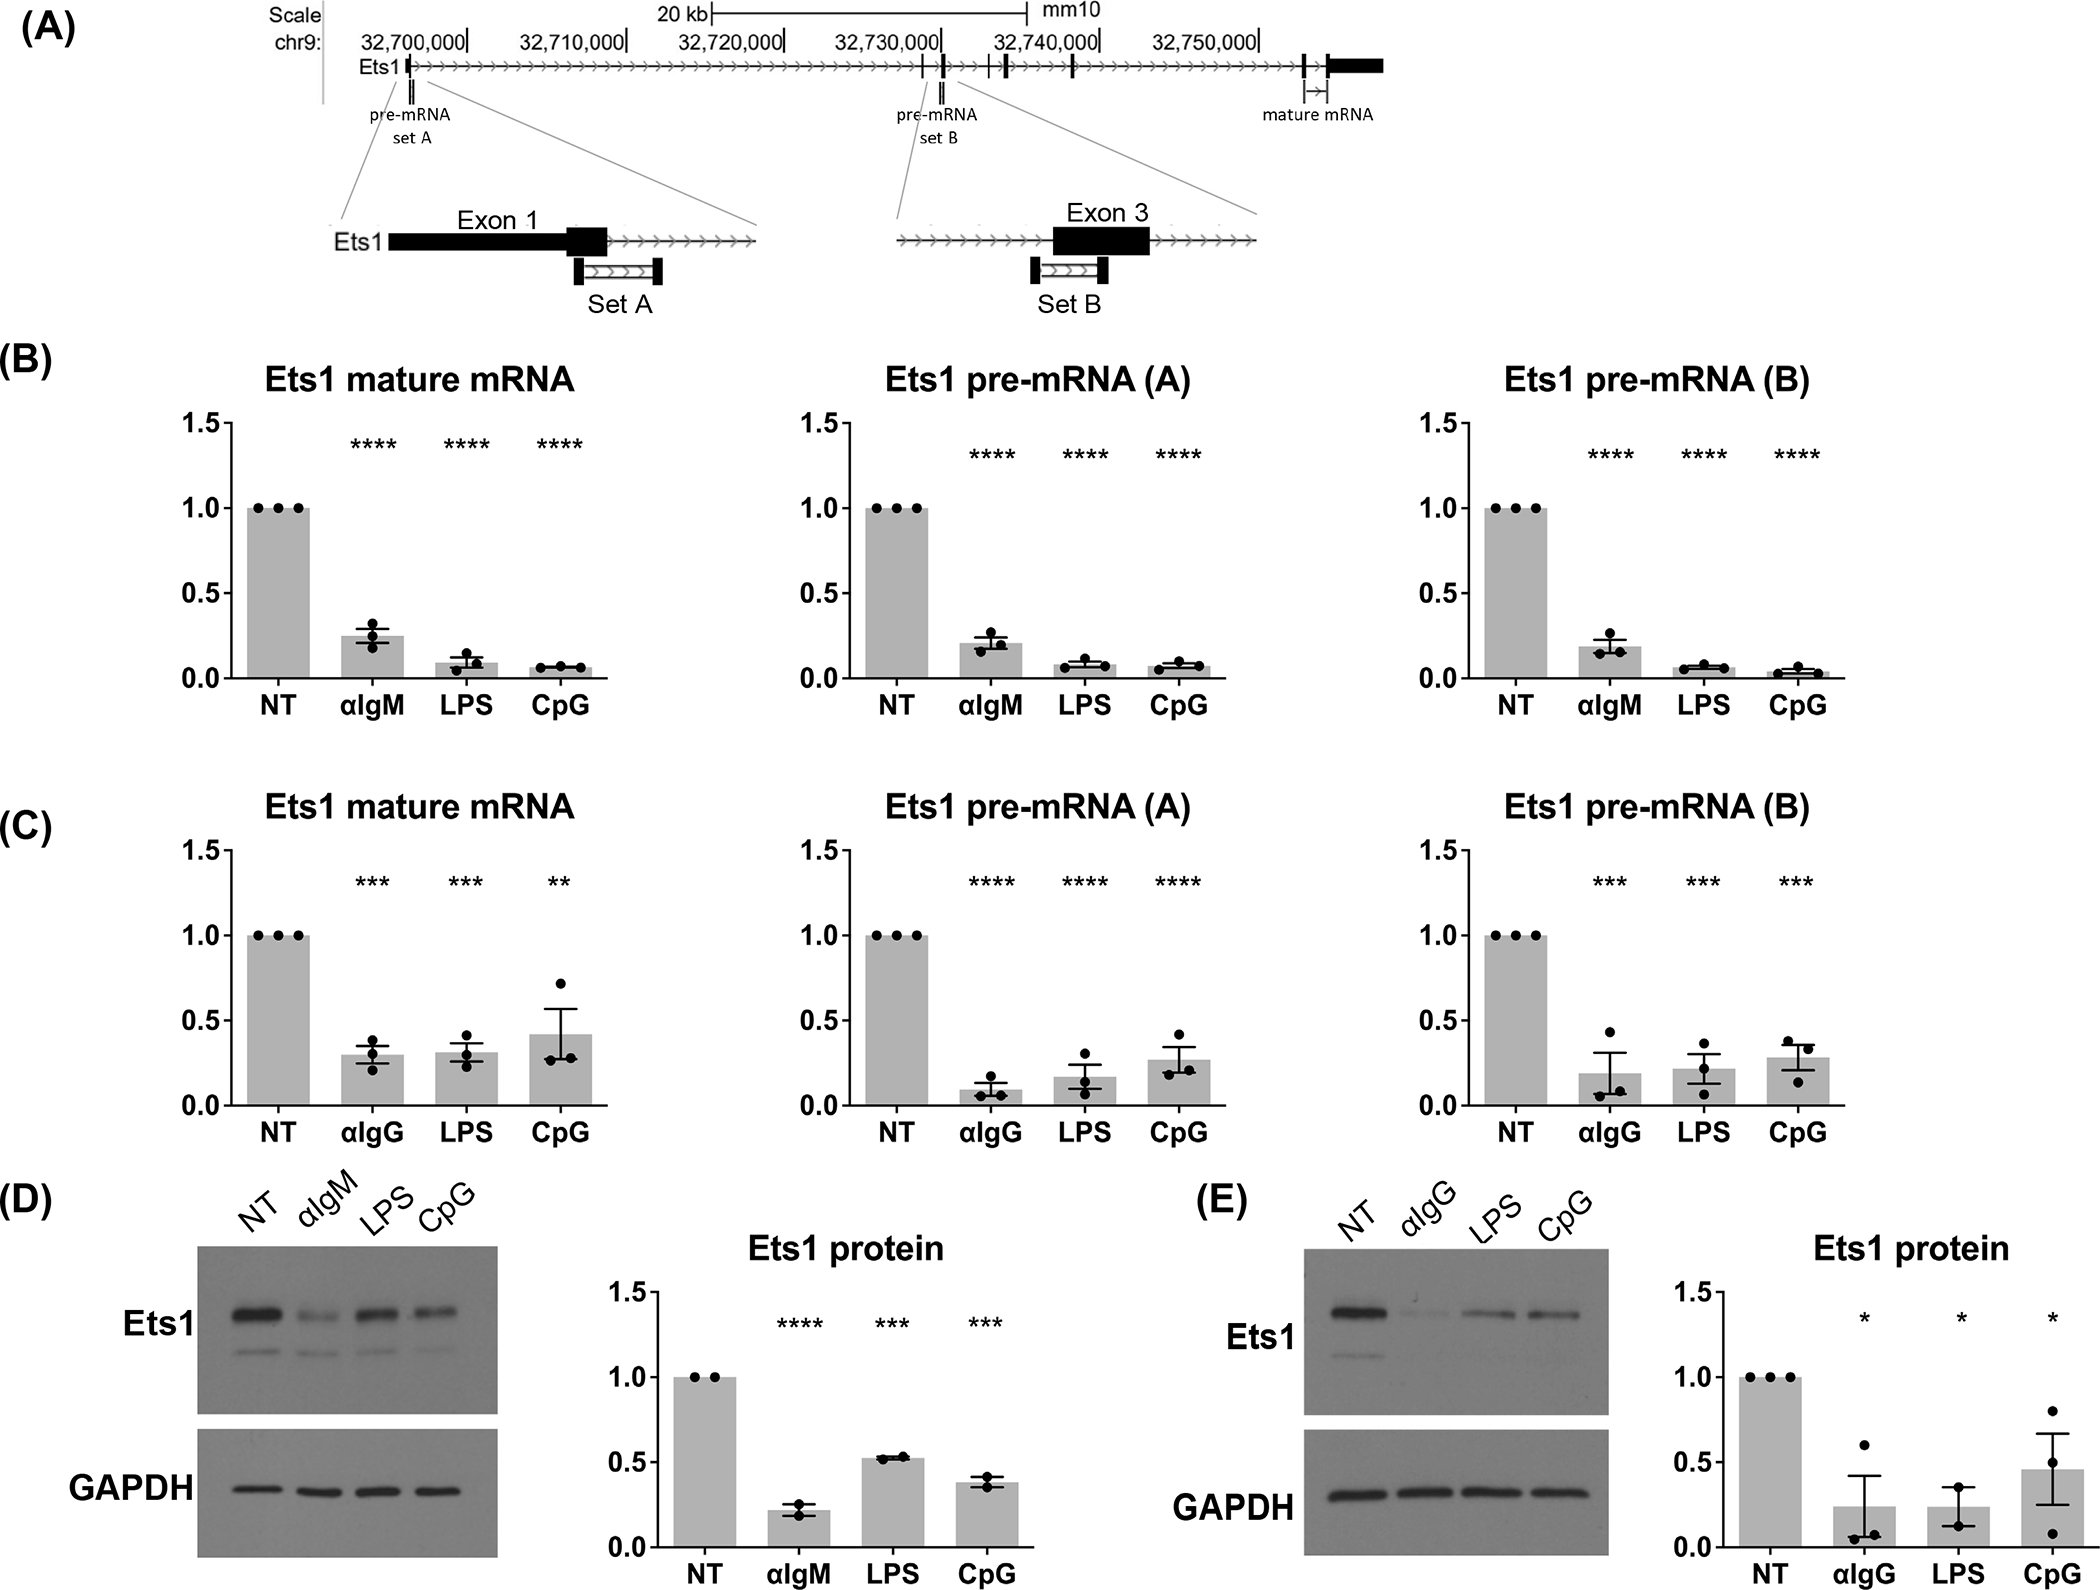
Ets1 is a key transcription factor in B cells that is required to prevent premature differentiation into Ab-secreting cells. Previously, we showed that BCR and TLR signaling downregulate Ets1 levels and that the kinases PI3K, Btk, IKK, and JNK are required for this process. PI3K is important in activating Btk by generating the membrane lipid phosphatidylinositol (3,4,5)-trisphosphate, to which Btk binds via its PH domain. Btk in turn is important in activating the IKK kinase pathway, which it does by activating phospholipase Cγ2→protein kinase Cβ signaling. In this study, we have further investigated the pathways regulating Ets1 in mouse B cells. Although IKK is well known for its role in activating the canonical NF-κB pathway, IKK-mediated downregulation of Ets1 does not require either RelA or c-Rel. We also examined the potential roles of two other IKK targets that are not part of the NF-κB signaling pathway, Foxo3a and mTORC2, in regulating Ets1. We find that loss of Foxo3a or inhibition of mTORC2 does not block BCR-induced Ets1 downregulation. Therefore, these two pathways are not key IKK targets, implicating other as yet undefined IKK targets to play a role in this process.


Figures

Figure 1.
Figure 1.. BCR signaling controls transcription of the Ets1 gene.
(A) Schematic of locations for primers designed to detect mature, spliced Ets1 mRNA and newly-synthesized Ets1 pre-mRNA. Regions of pre-mRNA amplification are shown in higher magnification below. (B) Splenic B cells purified from wild-type C57BL/6 mice and (C) A20 B lymphoma cells were stimulated via the BCR, TLR4, or TLR9 for 2 hours. mRNA and pre-mRNA levels were assessed by qPCR and normalized to beta-actin. Shown are the averages of three separate qPCR experiments with unstimulated samples (NT) set to one. Protein levels of splenic B cells (D) or A20 cells (E) after 4 hours of stimulation were assessed by Western blotting for Ets1 with GAPDH as an internal control. Ets1 protein signals were quantitated using ImageJ Fiji and normalized to GAPDH. Bar graphs show normalization of two independent Western blot experiments. Significance for all experiments in this figure was determined using one-way ANOVA with Dunnett post-test.
Figure 2.
Figure 2.. Downregulation of Ets1 gene transcription is dependent on IKK2 activity and does not require new protein synthesis.
(A) Splenic B cells were purified from wild-type C57BL/6 mice and cultured in the presence or absence of 5 μM IKK inhibitor IV or vehicle control (DMSO) for 1 hour then left unstimulated or stimulated via the BCR, TLR4, or TLR9 for 2 hours. Ets1 mature mRNA and pre-mRNA levels were assessed by qPCR in two independent replicate experiments. pre-mRNA primer set A from Figure 1A was used in these experiments. Significance was determined using one-way ANOVA with the Dunnett post-test. (B) Primary splenic B cells or (C) A20 B lymphoma cells were incubated for 15 minutes with cycloheximide to stop protein synthesis and then stimulated via the BCR for 2 hours. qPCR was used to quantitate the levels of Ets1 mature mRNA and newly-synthesized pre-mRNA (using both primer sets for the pre-mRNA transcript). Shown are the averages of three separate qPCR experiments with unstimulated samples (NT) set to one. Significance was determined using one-way ANOVA with the Tukey post-test.
Figure 3.
Figure 3.. RelA is not required for BCR- or TLR-induced downregulation of Ets1.
(A) B cells were isolated from Cre-negative Relafl/fl and CD19-Cre Relafl/fl (RelA KO) mice and left unstimulated or stimulated via the BCR or TLR for 2 hours. Ets1 mature mRNA and pre-mRNA (using both pre-mRNA primer sets) was quantified by qPCR. Shown are the averages of 4 separate qPCR experiments with unstimulated samples (NT) set to one. (B) Protein lysates were prepared from B cells isolated from Relafl/fl and CD19-Cre Relafl/fl (RelA KO) mice and stimulated or not with anti-IgM BCR crosslinking antibody, LPS, or CpG for 4 hours. Western blot was performed using antibodies specific for Ets1 and RelA, with GAPDH as a loading control. Bar graphs show normalization of three independent Western blot experiments. Significance for all experiments in this figure was determined using one-way ANOVA with the Tukey post-test.
Figure 4.
Figure 4.. c-Rel is not required for BCR- or TLR-induced downregulation of Ets1.
(A) B cells were isolated from Cre-negative Relfl/fl and CD19-Cre Relfl/fl (c-Rel KO) mice and left unstimulated or stimulated via the BCR or TLR for 2 hours. Ets1 mature mRNA and pre-mRNA (using both pre-mRNA primer sets) was quantified by qPCR. Shown are the averages of 4–5 separate qPCR experiments with unstimulated samples (NT) set to one. (B) Protein lysates were prepared from B cells isolated from Cre-negative Relfl/fl and CD19-Cre Relfl/fl (c-Rel KO) mice and stimulated or not with anti-IgM BCR crosslinking antibody, LPS, or CpG for 4 hours. Western blot was performed using antibodies specific for Ets1 and GAPDH as a loading control. Bar graphs show normalization of four independent Western blot experiments. Significance for all experiments in this figure was determined using one-way ANOVA with the Tukey post-test.
Figure 5.
Figure 5.. Foxo3a is not required for BCR-induced downregulation of Ets1.
(A) B cells were isolated from wild-type and Foxo3a−/− mice and left unstimulated or stimulated via the BCR for 2 hours. Ets1 mature mRNA and pre-mRNA (using both pre-mRNA primer sets) was quantified by qPCR. Shown are the averages of 3 separate qPCR experiments with unstimulated samples (NT) set to one. (B) Protein lysates were prepared from B cells isolated from wild-type and Foxo3a−/− mice and stimulated or not with anti-IgM BCR crosslinking antibody for 4 hours. Western blot was performed using antibodies specific for Foxo3a and Ets1, with GAPDH as a loading control. Bar graphs show normalization of three independent Western blot experiments. Significance for all experiments in this figure was determined using one-way ANOVA with the Tukey post-test.
Figure 6.
Figure 6.. mTOR signaling is not required for BCR-induced downregulation of Ets1.
(A) B cells were isolated from wild-type C57BL/6 mice and incubated with mTOR inhibitor AZD8055 or DMSO vehicle for 1 hour. B cells were then either left unstimulated or stimulated via the BCR for an additional 4 hours. Protein lysates were prepared from the B cells and Western blot was performed using antibodies specific for Ets1, phospho-S6 kinase (mTORC1 target), phospho-ribosomal S6 protein (p-S6 kinase target), phospho-Ser 473 of Akt (mTORC2 target) and GAPDH as a loading control. Bar graphs show normalization of three independent Western blot experiments. (B) Isolated B cells were treated with AZD8055 or vehicle for 1 hour and then left unstimulated or stimulated via the BCR for an additional 2 hours. Ets1 mature mRNA and pre-mRNA (using both pre-mRNA primer sets) was quantified by qPCR. Shown are the averages of 3 separate qPCR experiments with unstimulated samples (NT) set to one. Significance was determined using two-way ANOVA with the Tukey post-test.

Similar articles

Cited by

References

    1. Cashman KS, Jenks SA, Woodruff MC, Tomar D, Tipton CM, Scharer CD, Eun-Hyung Lee F, Boss JM, and Sanz I. 2019. Understanding and measuring human B-cell tolerance and its breakdown in autoimmune disease. Immunol Rev 292: 76–89. - PMC - PubMed
    1. Smith T, and Cunningham-Rundles C. 2019. Primary B-cell immunodeficiencies. Hum Immunol 80: 351–362. - PMC - PubMed
    1. Nguyen HV, Mouly E, Chemin K, Luinaud R, Despres R, Fermand JP, Arnulf B, and Bories JC. 2012. The Ets-1 transcription factor is required for Stat1-mediated T-bet expression and IgG2a class switching in mouse B cells. Blood 119: 4174–4181. - PubMed
    1. Mouly E, Chemin K, Nguyen HV, Chopin M, Mesnard L, Leite-de-Moraes M, Burlen-defranoux O, Bandeira A, and Bories JC. 2010. The Ets-1 transcription factor controls the development and function of natural regulatory T cells. J Exp Med 207: 2113–2125. - PMC - PubMed
    1. Wang D, John SA, Clements JL, Percy DH, Barton KP, and Garrett-Sinha LA. 2005. Ets-1 deficiency leads to altered B cell differentiation, hyperresponsiveness to TLR9 and autoimmune disease. Int Immunol 17: 1179–1191. - PubMed

Publication types