. 2023 Jul;149(8):5377-5395.
doi: 10.1007/s00432-022-04440-0. Epub 2022 Nov 29.

Nutrient deprivation and hypoxia alter T cell immune checkpoint expression: potential impact for immunotherapy

Affiliations

Nutrient deprivation and hypoxia alter T cell immune checkpoint expression: potential impact for immunotherapy

Maria Davern et al. J Cancer Res Clin Oncol. 2023 Jul.

Abstract

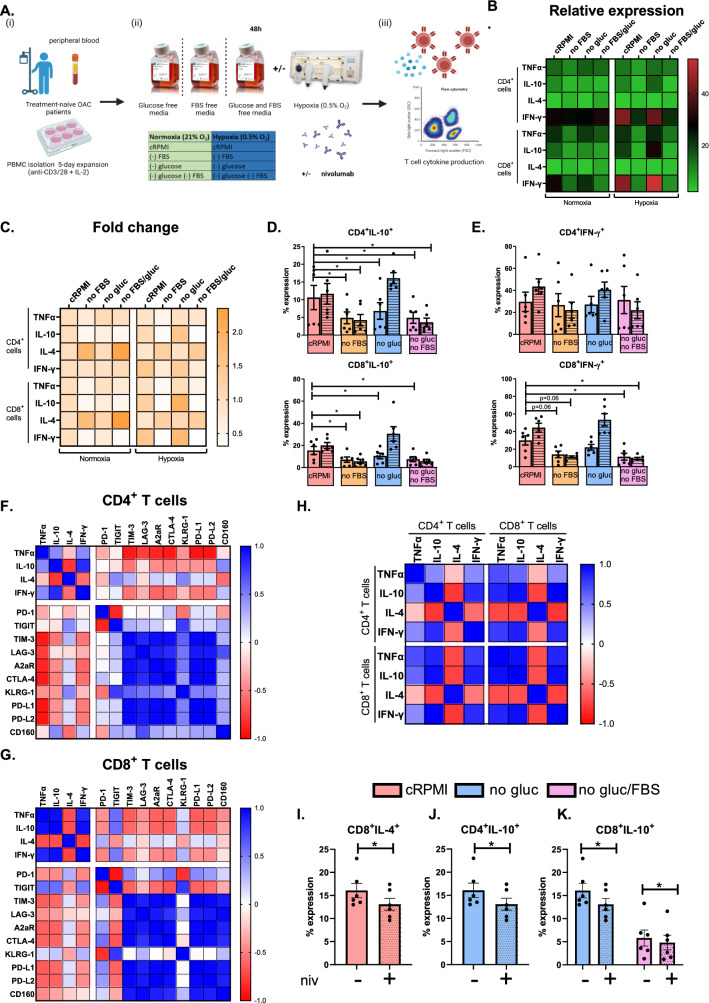
Aim: Use of immune checkpoint blockade to enhance T cell-mediated immunity within the hostile tumour microenvironment (TME) is an attractive approach in oesophageal adenocarcinoma (OAC). This study explored the effects of the hostile TME, including nutrient deprivation and hypoxia, on immune checkpoint (IC) expression and T cell phenotypes, and the potential use of nivolumab to enhance T cell function under such conditions.

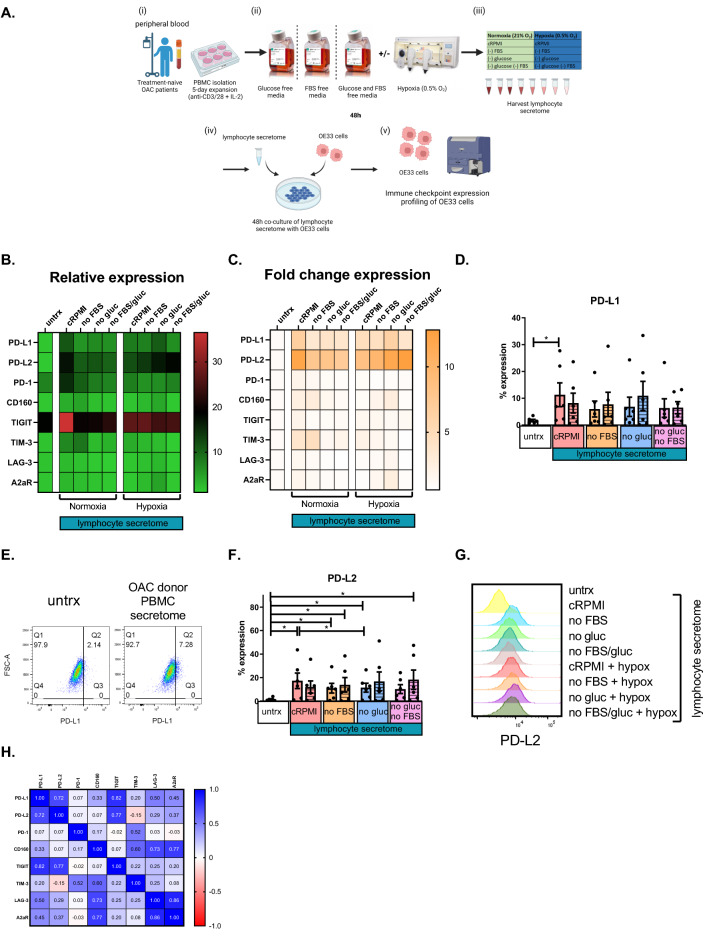
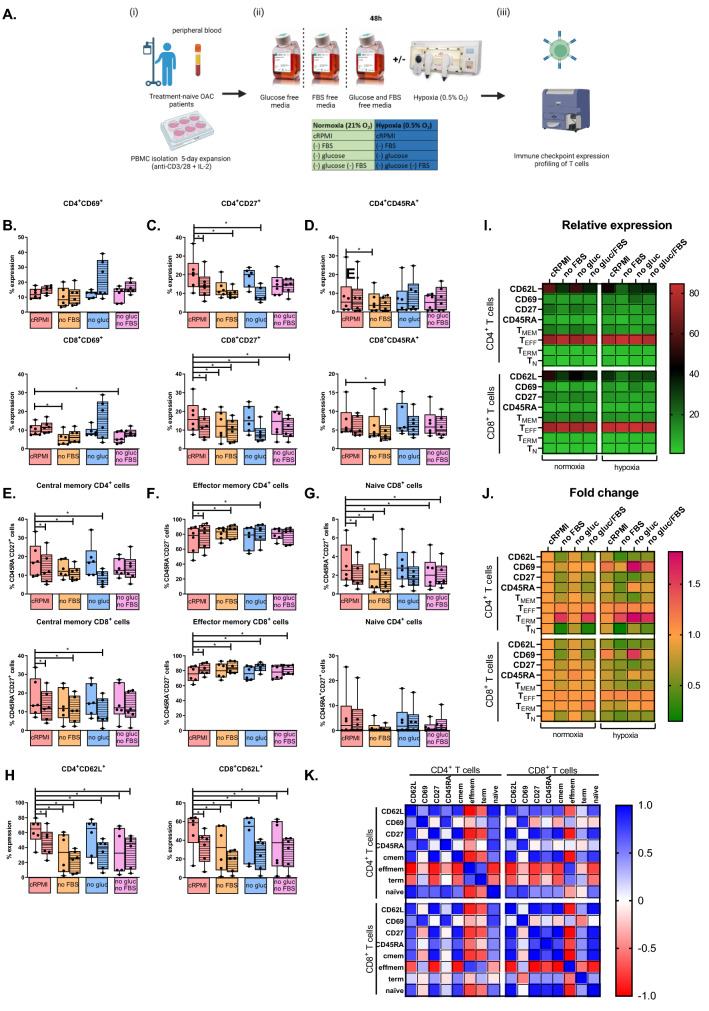
Methods and results: ICs were upregulated on stromal immune cells within the tumour including PD-L2, CTLA-4 and TIGIT. OAC patient-derived PBMCs co-cultured with OE33 OAC cells upregulated LAG-3 and downregulated the co-stimulatory marker CD27 on T cells, highlighting the direct immunosuppressive effects of tumour cells on T cells. Hypoxia and nutrient deprivation altered the secretome of OAC patient-derived PBMCs, which induced upregulation of PD-L1 and PD-L2 on OE33 OAC cells thus enhancing an immune-resistant phenotype. Importantly, culturing OAC patient-derived PBMCs under dual hypoxia and glucose deprivation, reflective of the conditions within the hostile TME, upregulated an array of ICs on the surface of T cells including PD-1, CTLA-4, A2aR, PD-L1 and PD-L2 and decreased expression of IFN-γ by T cells. Addition of nivolumab under these hostile conditions decreased the production of pro-tumorigenic cytokine IL-10.

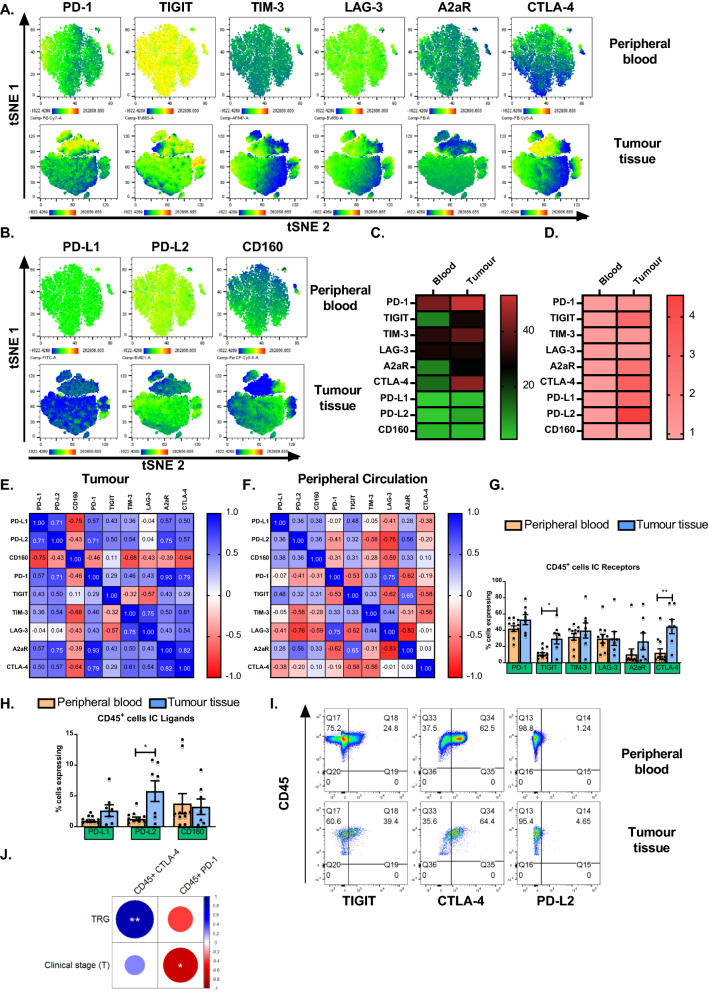
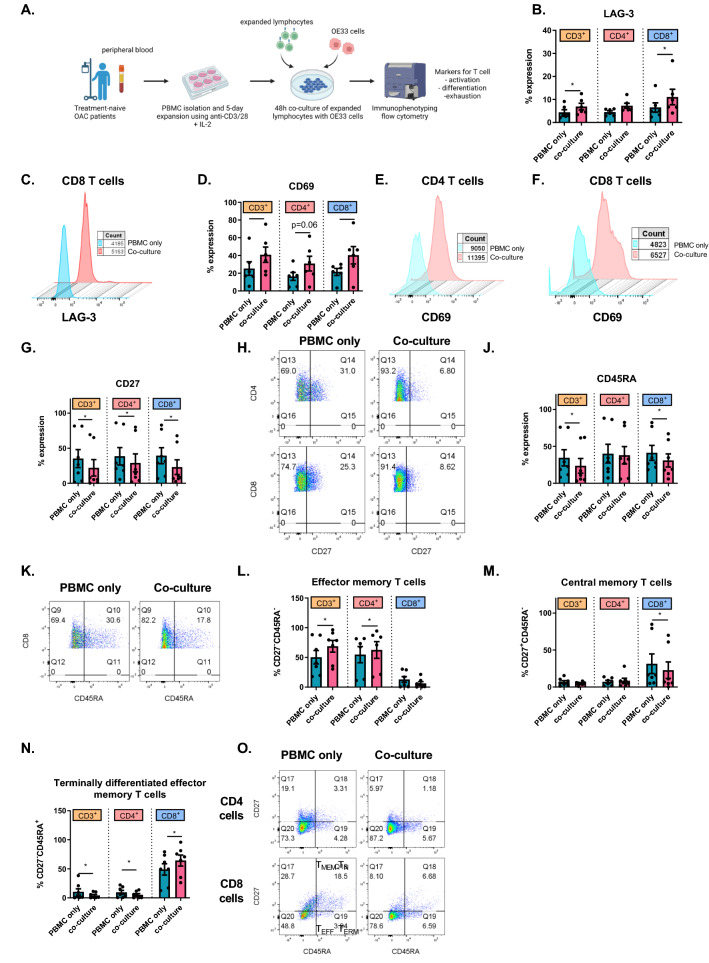
Conclusion: Collectively, these findings highlight the immunosuppressive crosstalk between tumour cells and T cells within the OAC TME. The ability of nivolumab to suppress pro-tumorigenic T cell phenotypes within the hostile TME supports a rationale for the use of immune checkpoint blockade to promote anti-tumour immunity in OAC. Study schematic: (A) IC expression profiles were assessed on CD45+ cells in peripheral whole blood and infiltrating tumour tissue from OAC patients in the treatment-naïve setting. (B) PBMCs were isolated from OAC patients and expanded ex vivo for 5 days using anti-CD3/28 + IL-2 T cell activation protocol and then co-cultured for 48 h with OE33 cells. T cell phenotypes were then assessed by flow cytometry. (C) PBMCs were isolated from OAC patients and expanded ex vivo for 5 days using anti-CD3/28 + IL-2 T cell activation protocol and then further cultured under conditions of nutrient deprivation or hypoxia for 48 h and T cell phenotypes were then assessed by flow cytometry.

Key findings: (A) TIGIT, CTLA-4 and PD-L2 were upregulated on CD45+ immune cells and CTLA-4 expression on CD45+ cells correlated with a subsequent decreased response to neoadjuvant regimen. (B) Following a 48 h co-culture with OE33 cells, T cells upregulated LAG-3 and decreased CD27 co-stimulatory marker. (C) Nutrient deprivation and hypoxia upregulated a range of ICs on T cells and decreased IFN-γ production by T cells. Nivolumab decreased IL-10 production by T cells under nutrient deprivation-hypoxic conditions.

Keywords: Glucose deprivation; Hypoxia; Immune checkpoints; Oesophageal adenocarcinoma; Tumour microenvironment.


Conflict of interest statement

The authors declare that there is no conflict of interest that could be perceived as prejudicing the impartiality of the research reported.

Figures

Fig. 1
Fig. 1
TIGIT, CTLA-4 and PD-L2 are expressed at significantly higher levels on the surface of CD45+ cells infiltrating tumour tissue compared with peripheral circulation and frequencies of CD45+CTLA-4+ circulating cells positively correlated with a subsequent poor pathological response to treatment. CD45+ cells were screened for the surface expression of IC receptors PD-1, TIGIT, TIM-3, LAG-3, A2aR and CTLA-4 and ligands PD-L1, PD-L2 and CD160 in peripheral whole blood (n = 10) and infiltrating OAC pre-treatment tumour biopsies (n = 7) by flow cytometry. tSNE plots are shown depicting the spatial distribution and expression of each IC receptor (A) and ligand (B) on CD45+ cells in peripheral circulation and infiltrating tumour tissue. Heat maps summarising the relative expression levels (C) and fold change (D) of IC proteins on CD45+ cells in peripheral blood versus tumour tissue. (E) and (F) show the correlation values between IC expression in peripheral blood and tumour tissue, respectively. Graphical depiction of IC receptor and ligand expression on CD45+ cells in peripheral blood and tumour tissue is shown in (G) and (H), respectively. (I) includes representative dot plots of the IC proteins TIGIT, CTLA-4 and PD-L2 which are significantly upregulated on tumour-infiltrating CD45+ cells compared with those in circulation. Mann Whitney test *p < 0.05. (J) Corrogram depicting the significant correlations between circulating CD45+ cells expressing ICs and clinical parameters in treatment-naïve OAC patients. Spearman correlation *p ≤ 0.05. Mandard tumour regression grade (TRG) clinical tumour (T) stage determined by PET/CT
Fig. 2
Fig. 2
Co-culturing OE33 OAC cells with OAC donor PBMCs upregulates LAG-3 and alters the activation status of T cells. (A) Schematic of experimental setup. OE33 cells were cultured for 48h in the absence or presence of PBMCs (OE33: PBMCs, 1:2) isolated from OAC patients (n = 7) that were pre-activated for 5 days with plate bound anti-CD3/28 and IL-2 prior to culture. CD3+, CD3+CD4+ and CD3+CD8+ cells were then stained with a zombie viability dye and the expression of inhibitory immune checkpoint receptor LAG-3 (B), T cell activation markers CD69 (D), CD27 (G) and CD45RA (J), frequencies of effector memory (CD45RA-CD27) (L), (central memory (CD45RA-CD27+) (M) and terminally differentiated effector memory (CD45RA+CD27) (N) T cells was assessed via flow cytometry. Paired, non-parametric t test. Expression presented as percentage ± SEM on live cells. Only data with significant changes are shown and non-significant data is shown in Figure S5. Representative histograms and dot plots are shown for LAG-3 (C), CD69 (EF), CD27 (H), CD45RA (K) and T cell differentiation status (O)
Fig. 3
Fig. 3
OAC patient-derived PBMC secretome significantly increased the expression of PD-L1 and PD-L2 on OE33 OAC cells under full nutrient and normoxic conditions. (A) Schematic of experimental setup. PBMCs were isolated from peripheral blood of treatment-naïve OAC patients (n = 6) and expanded for 5 days in the presence of plate bound anti-CD3/anti-CD28 and recombinant human IL-2. Following a 5-day expansion, PBMCs were cultured for an additional 48h under nutrient deprivation (FBS deprived or glucose deprived), hypoxia (0.5% O2) and combined nutrient deprivation hypoxic conditions, and the soluble secretome was harvested and cultured with OE33 cells using a 1 in 2 dilution for 24 h. OE33 cells were then stained with a zombie viability dye and antibodies specific for a range of ligands (PD-L1, PD-L2 and CD160) and IC receptors (PD-1, TIGIT, TIM-3, LAG-3 and A2aR) and expression was assessed by flow cytometry. Only significant data shown in graphs. Heat maps that summarise the effects of the lymphocyte secretome on the relative expression (B) and fold change (C) of ICs on the surface OE33 cells are also shown. PD-L1 (D-E) and PD-L2 (F-G) expression by OE33 cells following culture with OAC patient-derived PBMC secretome under a range of TME conditions. Undashed bars (left) represent normoxic conditions and dashed bars (right) represent hypoxic conditions. (H) Correlation matrix displaying the correlation values for IC expression on OE33 cells. Paired, non-parametric t test. Expression presented as percentage ± SEM on live cells
Fig. 4
Fig. 4
Combination hypoxia and glucose deprivation upregulated PD-1, CTLA-4, A2aR, PD-L1 and PD-L2 on the surface of OAC patient-derived T cells. A Schematic of experimental setup. PBMCs were isolated from peripheral blood of treatment-naïve OAC patients (n = 6) and expanded for 5 days in the presence of plate bound anti-CD3/anti-CD28 and recombinant human IL-2. Following a 5-day expansion, PBMCs were cultured for 48h under nutrient deprivation (FBS deprived or glucose deprived), hypoxia (0.5% O2) and combined nutrient deprivation and hypoxic conditions. CD3+CD4+ and CD3+CD8+ cells were stained with a zombie viability dye and antibodies specific for a range of inhibitory immune checkpoint receptors (PD-1, TIGIT, TIM-3, LAG-3, A2aR, CTLA-4 and KLRG-1 (DJ)) and inhibitory immune checkpoint ligands (PD-L1, PD-L2 and CD160 (KM)) and expression was assessed by flow cytometry. Undashed bars (left) represent normoxic conditions and dashed bars (right) represent hypoxic conditions. Heat maps that summarise the effects hypoxia, nutrient deprivation and a combination of both on the relative expression (B) and fold change (C) IC expression profile of CD4+ and CD8+ cells are also shown. N Correlation matrix displaying the correlation values for IC expression on CD4+ and CD8+ T cells. Paired, non-parametric t test. Expression presented as percentage + SEM on live cells
Fig. 5
Fig. 5
Combination hypoxia and glucose deprivation decreases the frequency of CD27+ T cells and central memory T cells while increasing the frequency of effector memory T cells. (A) Schematic of experimental setup. PBMCs were isolated from peripheral blood of treatment-naïve OAC patients (n = 6) and expanded for 5 days in the presence of plate bound anti-CD3/anti-CD28 and recombinant human IL-2. Following a 5-day expansion, PBMCs were cultured for an additional 24h under nutrient deprivation (FBS deprived or glucose deprived), hypoxia (0.5% O2) and combined nutrient deprivation hypoxic conditions. Expression of a range of markers reflective of T cell activation status was assessed on viable CD3+CD4+ and CD3+CD8+ cells by flow cytometry. Markers assessed included: CD62L, CD69, CD27 and CD45RA. The percentage of viable naïve (CD45RA+CD27+), central memory (CDRA-CD27+), effector memory (CD45RA-CD27) and terminally differentiated effector memory (CD45RA+CD27) CD3+CD4+ and CD3+CD8+ (BH) cells was also determined by flow cytometry. Undashed bars (left) represent normoxic conditions and dashed bars (right) represent hypoxic conditions. Heat maps that summarise the effect of hypoxia, nutrient deprivation and a combination of both on the relative expression (I) and fold change (J) on the activation status of CD4+ and CD8+ cells are also shown. (K) Correlation matrix displaying the correlation values for T cell activation marker expression on CD4+ and CD8+ T cells. Paired, non-parametric t test. Expression presented as percentage ± SEM on live cells. Paired, non-parametric t test. Expression presented as percentages ± SEM on live cells, *p < 0.05
Fig. 6
Fig. 6
Combination serum deprivation and hypoxia treatment decreases the production of IL-10 and IFN-γ by T cells. (A) Schematic of experimental setup. PBMCs were isolated from peripheral blood of treatment-naïve OAC patients (n = 6) and expanded for 5 days in the presence of plate bound anti-CD3/anti-CD28 and recombinant human IL-2. Following a 5-day expansion, PBMCs were cultured for an additional 24h under nutrient deprivation (FBS deprived or glucose deprived), hypoxia (0.5% O2) and combined nutrient deprivation hypoxic conditions in the absence or presence of nivolumab. Intracellular staining was conducted to assess CD3+CD4+ and CD3+CD8+ cell expression of TNF-α, IL-10, IL-4 and IFN-γ by flow cytometry. Paired, non-parametric t test. Expression presented as percentages ± SEM on viable cells. Heat maps that summarise the effects hypoxia, nutrient deprivation and a combination of both on the relative expression (B) and fold change (C) of cytokine production by CD4+ and CD8+ cells are also shown. (D-E) CD3+CD4+ and CD3+CD8+ cell expression of IL-10 and IFN-γ under nutrient deprived and hypoxic conditions was assessed by flow cytometry (n=6). Paired, non-parametric t test. Expression presented as percentage ± SEM on live cells. Undashed bars (left) represent normoxic conditions and dashed bars (right) represent hypoxic conditions. (F) and (G) are correlation matrixes highlighting the correlation values between cytokine production and IC expression in CD4+ and CD8+ cells. (H) Correlation matrix displaying the correlation values for T cell cytokine production by CD4+ and CD8+ T cells. (IK) effect of nivolumab on the production of IL-10 and IL-4 in CD4+ and CD8+ T cells. Paired, non-parametric t test. expression presented as percentage ± SEM on live cells, *p < 0.05

Similar articles

Cited by

References

    1. Ascierto PA et al (2017) Efficacy of BMS-986016, a monoclonal antibody that targets lymphocyte activation gene-3 (LAG-3), in combination with nivolumab in pts with melanoma who progressed during prior anti–PD-1/PD-L1 therapy (mel prior IO) in all-comer and biomarker-enrich. Ann Oncol 28:v611–v612
    1. Blackburn SD et al (2009) Coregulation of CD8+ T cell exhaustion by multiple inhibitory receptors during chronic viral infection. Nat Immunol 10:29–37 - PMC - PubMed
    1. Braun DA et al (2021) Beyond conventional immune-checkpoint inhibition—novel immunotherapies for renal cell carcinoma. Nat Rev Clin Oncol 18:199–214 - PMC - PubMed
    1. Camisaschi C et al (2010) LAG-3 expression defines a subset of CD4+CD25highFoxp3+ regulatory T cells that are expanded at tumor sites. J Immunol 184:6545–6551 - PubMed
    1. Cham CM, Driessens G, O’Keefe JP, Gajewski TF (2008) Glucose deprivation inhibits multiple key gene expression events and effector functions in CD8+ T cells. Eur J Immunol 38:2438–2450 - PMC - PubMed