. 2022 Nov 29;18(11):e1010678.
doi: 10.1371/journal.pcbi.1010678. eCollection 2022 Nov.

Sampling effects and measurement overlap can bias the inference of neuronal avalanches

Affiliations

Sampling effects and measurement overlap can bias the inference of neuronal avalanches

Joao Pinheiro Neto et al. PLoS Comput Biol. .

Abstract

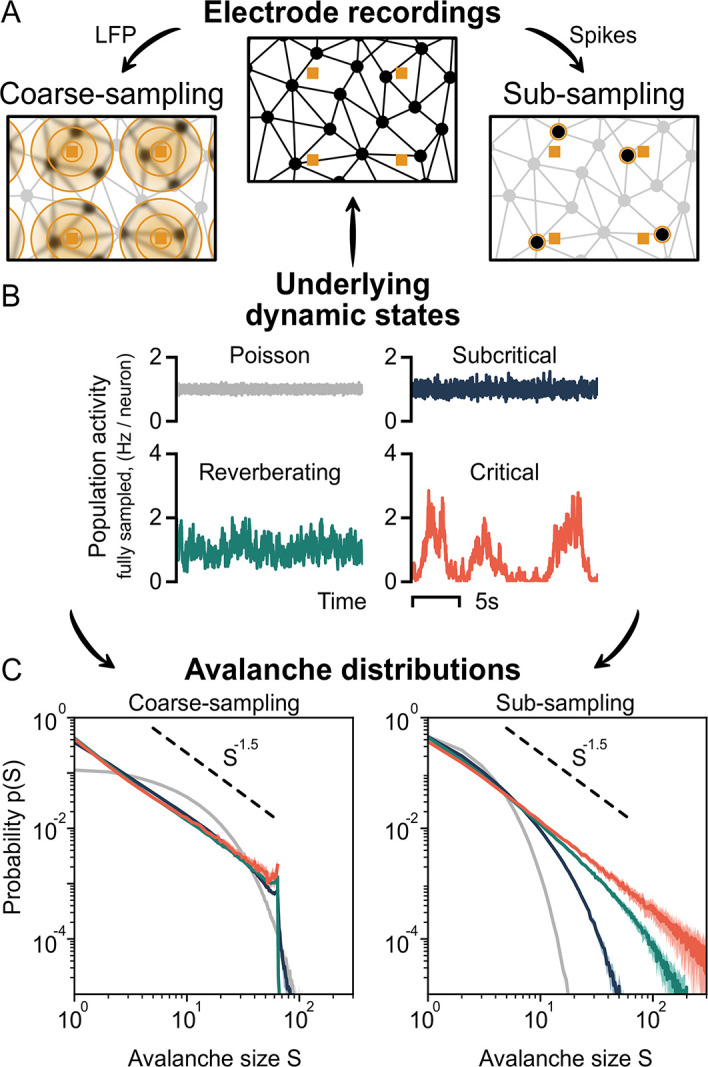
To date, it is still impossible to sample the entire mammalian brain with single-neuron precision. This forces one to either use spikes (focusing on few neurons) or to use coarse-sampled activity (averaging over many neurons, e.g. LFP). Naturally, the sampling technique impacts inference about collective properties. Here, we emulate both sampling techniques on a simple spiking model to quantify how they alter observed correlations and signatures of criticality. We describe a general effect: when the inter-electrode distance is small, electrodes sample overlapping regions in space, which increases the correlation between the signals. For coarse-sampled activity, this can produce power-law distributions even for non-critical systems. In contrast, spike recordings do not suffer this particular bias and underlying dynamics can be identified. This may resolve why coarse measures and spikes have produced contradicting results in the past.


Conflict of interest statement

The authors have declared that no competing interests exist.

Figures

Fig 1
Fig 1. Sampling affects the assessment of dynamic states from neuronal avalanches.
A: Representation of the sampling process of neurons (black circles) using electrodes (orange squares). Under coarse-sampling (e.g. LFP), activity is measured as a weighted average in the electrode’s vicinity. Under sub-sampling (spikes), activity is measured from few individual neurons. B: Fully sampled population activity of the neuronal network, for states with varying intrinsic timescales τ: Poisson (τ^psn0ms), subcritical (τ^sub19ms), reverberating (τ^rev98ms) and critical (τ^crit1.6s). C: Avalanche-size distribution p(S) for coarse-sampled (left) and sub-sampled (right) activity. Sub-sampling allows for separating the different states, whereas coarse-sampling leads to p(S) ∼ Sα for all states except Poisson. Parameters: Electrode contribution γ = 1, inter-electrode distance dE = 400 μm and time-bin size Δt = 8 ms.
Fig 2
Fig 2. Analysis pipeline for avalanches from sampled data.
I: Under coarse-sampling (LFP-like), the recording is demeaned and thresholded. II: The timestamps of events are extracted. Under sub-sampling (spikes), timestamps are obtained directly. III: Events from all channels are binned with time-bin size Δt and summed. The size S of each neuronal avalanche is calculated. IV: The probability of an avalanche size is given by the (normalized) count of its occurrences throughout the recording.
Fig 3
Fig 3. Coarse-sampling leads to greater correlations than sub-sampling.
Pearson correlation coefficient between the signals of two adjacent electrodes for the different dynamic states. Even for independent (uncorrelated) Poisson activity, measured correlations under coarse-sampling are non-zero. Parameters: Electrode contribution γ = 1, inter-electrode distance dE = 400 μm and time-bin size Δt = 8 ms.
Fig 4
Fig 4. The signal of an extracellular neuronal recording depends on neuronal morphologies, tissue filtering, and other factors, which all impact the coarse-sampling effect.
In effect, an important factor is the distance of the neuron to the electrode. Here, we show how the distance-dependence, with which a neuron’s activity contributes to an electrode, determines the collapse of avalanche distributions. A: Biophysically plausible distance dependence of LFP, reproduced from [38]. B: Sketch of a neuron’s contribution to an electrode at distance dik, as motivated by (A). The decay exponent γ characterizes the field of view. C–F: Avalanche-size distribution p(S) for coarse-sampling with the sketched electrode contributions. C, D: With a wide-field of view, distributions are hardly distinguishable between dynamic states. In contrast, for spiking activity the differences are clear (light shades in C). E, F: With a narrower field of view, distributions do not fully collapse on top of each other, but differences between reverberating and critical dynamics remain hard to identify. Parameters: Inter-electrode distance dE = 400 μm and time-bin size Δt = 8 ms. Other parameter combinations in Fig B in S1 Text.
Fig 5
Fig 5. Under coarse-sampling, apparent dynamics depend on the inter-electrode distance dE.
A: For small distances (dE = 100 μm), the avalanche-size distribution p(S) indicates (apparent) supercritical dynamics: p(S) ∼ Sα with a sharp peak near the electrode number NE = 64. For large distances (dE = 500 μm), p(S) indicates subcritical dynamics: p(S) ∼ Sα with a pronounced decay already for S < NE. There exists a sweet-spot value (dE = 250 μm) for which p(S) indicates critical dynamics: p(S) ∼ Sα until the the cut-off is reached at S = NE. The particular sweet-spot value of dE depends on time-bin size (here, Δt = 4 ms). As a guide to the eye, dashed lines indicate S−1.5. B: The inferred branching parameter m^av is also biased by dE when estimated from neuronal avalanches. Apparent criticality (m^av1, dotted line) is obtained with dE = 250 μm and Δt = 4 ms but also with dE = 400 μm and Δt = 8 ms. B, Inset: representation of the measurement overlap between neighboring electrodes; when electrodes are placed close to each other, spurious correlations are introduced.
Fig 6
Fig 6. In vivo and in vitro avalanche-size distributions p(S) from LFP depend on time-bin size Δt.
Experimental LFP results are reproduced by many dynamics states of coarse-sampled simulations. A: Experimental in vivo results (LFP, human) from an array of 60 electrodes, adapted from [43]. B: Experimental in vitro results (LFP, culture) from an array with 60 electrodes, adapted from [1]. C–F: Simulation results from an array of 64 virtual electrodes and varying dynamic states, with time-bin sizes between 2 ms ≤ Δt ≤ 16 ms, γ = 1 and dE = 400 μm. Subcritical, reverberating and critical dynamics produce approximate power-law distributions with bin-size-dependent exponents α. Insets: Log-Log plot, distributions are fitted to p(S) ∼ Sα, fit range S ≤ 50. The magnitude of α decreases as Δtβ with −β indicated next to the insets, cf. Table 2.
Fig 7
Fig 7. In vivo avalanche-size distributions p(S) from spikes depend on time-bin size Δt.
In vivo results from spikes are reproduced by sub-sampled simulations of subcritical to reverberating dynamics. Neither spike experiments nor sub-sampled simulations show the cut-off that is characteristic under coarse-sampling. A: Experimental in vivo results (spikes, awake monkey) from an array of 16 electrodes, adapted from [24]. The pronounced decay and the dependence on bin size indicate subcritical dynamics. B: Experimental in vitro results (spikes, culture DIV 34) from an array with 59 electrodes, adapted from [44]. Avalanche-size distributions are largely independent of time-bin size and resemble a power law over four orders of magnitude. In combination, this indicates a separation of timescales and critical dynamics (or even super critical dynamics [45]). B, Inset: Log-Lin plot of fitted α, fit range s/N ≤ 5. C–F: Simulation for sub-sampling, analogous to Fig 6. Subcritical dynamics do not produce power-law distributions and are clearly distinguishable from critical dynamics. F: Only the (close-to) critical simulation produces power-law distributions. F, Inset: Log-Log plot of fitted α, fit range S ≤ 50. In contrast to the in vitro culture (in B), the simulation does not feature a separation of time scales (due to external drive and stationary activity), and therefore the slope shows a systematic bin-size dependence here.

Similar articles

Cited by

References

    1. Beggs JM, Plenz D. Neuronal Avalanches in Neocortical Circuits. Journal of Neuroscience. 2003;23(35):11167–11177. doi: 10.1523/JNEUROSCI.23-35-11167.2003 - DOI - PMC - PubMed
    1. Dunkelmann S, Radons G. Neural Networsk and Abelian Sandpile Models of Self-Organized Criticality. In: Marinaro M, Morasso PG, editors. Proceedings of International Conference Artificial Neural Networks. Springer-Verlag; 1994. p. 867–870.
    1. Beggs JM. The criticality hypothesis: how local cortical networks might optimize information processing. Philosophical Transactions of the Royal Society A: Mathematical, Physical and Engineering Sciences. 2008;366(1864):329–343. doi: 10.1098/rsta.2007.2092 - DOI - PubMed
    1. Muñoz MA. Colloquium: Criticality and dynamical scaling in living systems. Reviews of Modern Physics. 2018;90(3):031001. doi: 10.1103/RevModPhys.90.031001 - DOI
    1. Cocchi L, Gollo LL, Zalesky A, Breakspear M. Criticality in the brain: A synthesis of neurobiology, models and cognition. Progress in Neurobiology. 2017;158:132–152. doi: 10.1016/j.pneurobio.2017.07.002 - DOI - PubMed