

Rolling Circle Amplification Tailored for Plasmonic Biosensors: From Ensemble to Single-Molecule Detection
- PMID: 36446038
- PMCID: PMC9756284
- DOI: 10.1021/acsami.2c14500
Rolling Circle Amplification Tailored for Plasmonic Biosensors: From Ensemble to Single-Molecule Detection
Abstract
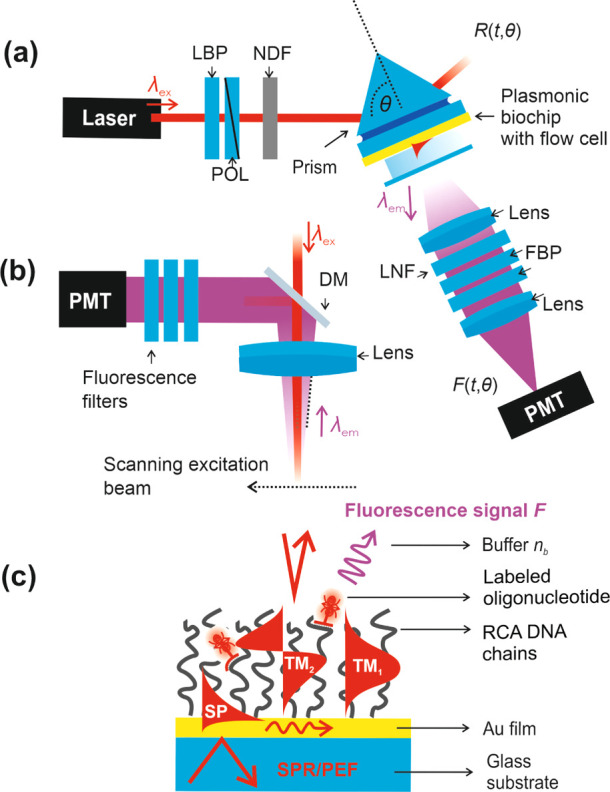
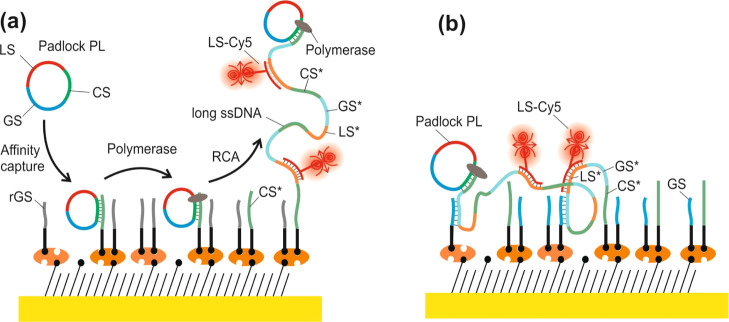
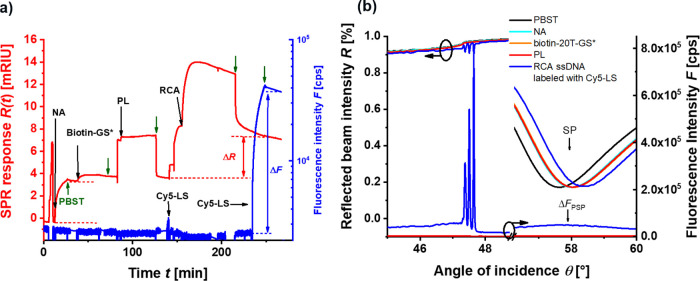
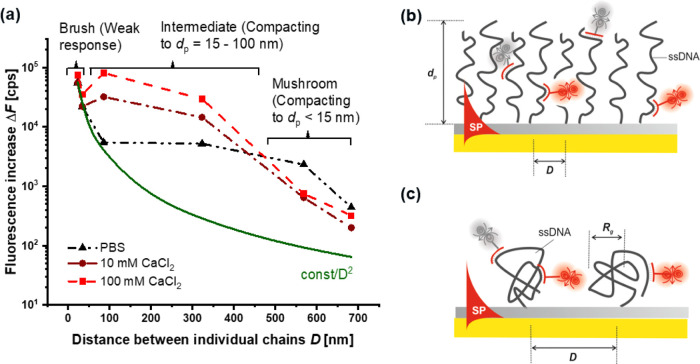
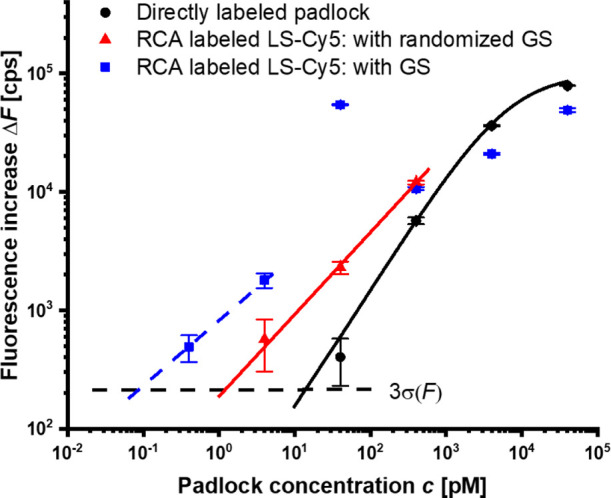
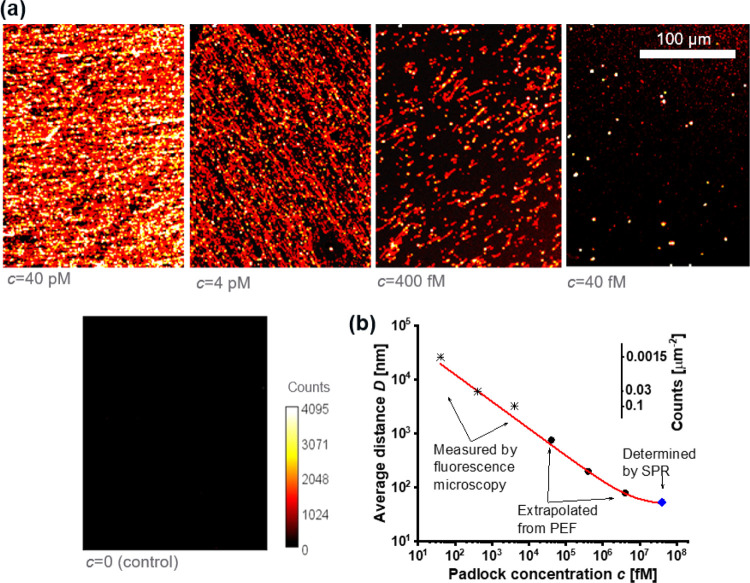
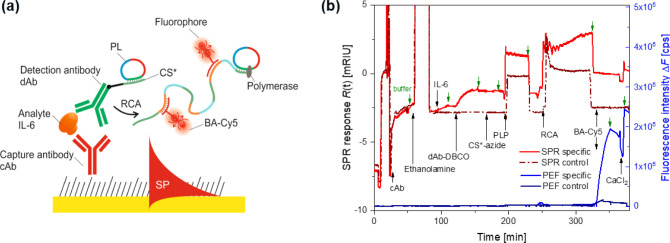
We report on the tailoring of rolling circle amplification (RCA) for affinity biosensors relying on the optical probing of their surface with confined surface plasmon field. Affinity capture of the target analyte at the metallic sensor surface (e.g., by using immunoassays) is followed by the RCA step for subsequent readout based on increased refractive index (surface plasmon resonance, SPR) or RCA-incorporated high number of fluorophores (in surface plasmon-enhanced fluorescence, PEF). By combining SPR and PEF methods, this work investigates the impact of the conformation of long RCA-generated single-stranded DNA (ssDNA) chains to the plasmonic sensor response enhancement. In order to confine the RCA reaction within the evanescent surface plasmon field and hence maximize the sensor response, an interface carrying analyte-capturing molecules and additional guiding ssDNA strands (complementary to the repeating segments of RCA-generated chains) is developed. When using the circular padlock probe as a model target analyte, the PEF readout shows that the reported RCA implementation improves the limit of detection (LOD) from 13 pM to high femtomolar concentration when compared to direct labeling. The respective enhancement factor is of about 2 orders of magnitude, which agrees with the maximum number of fluorophore emitters attached to the RCA chain that is folded in the evanescent surface plasmon field by the developed biointerface. Moreover, the RCA allows facile visualizing of individual binding events by fluorescence microscopy, which enables direct counting of captured molecules. This approach offers a versatile route toward a fast digital readout format of single-molecule detection with further reduced LOD.
Keywords: biosensor; immunoassays; rolling circle amplification; single molecule; surface plasmon resonance; surface plasmon-enhanced fluorescence.
Conflict of interest statement
The authors declare no competing financial interest.
Figures
Similar articles
-
Sandwich Immuno-RCA Assay with Single Molecule Counting Readout: The Importance of Biointerface Design.ACS Appl Mater Interfaces. 2024 Apr 10;16(14):17109-17119. doi: 10.1021/acsami.3c18304. Epub 2024 Mar 26. ACS Appl Mater Interfaces. 2024. PMID: 38530402 Free PMC article.
-
In Situ Monitoring of Rolling Circle Amplification on a Solid Support by Surface Plasmon Resonance and Optical Waveguide Spectroscopy.ACS Appl Mater Interfaces. 2021 Jul 14;13(27):32352-32362. doi: 10.1021/acsami.1c03715. Epub 2021 Jul 2. ACS Appl Mater Interfaces. 2021. PMID: 34212712
-
Real-time monitoring of mycobacterium genomic DNA with target-primed rolling circle amplification by a Au nanoparticle-embedded SPR biosensor.Biosens Bioelectron. 2015 Apr 15;66:512-9. doi: 10.1016/j.bios.2014.11.021. Epub 2014 Nov 18. Biosens Bioelectron. 2015. PMID: 25500527
-
Recent advances in rolling circle amplification-based biosensing strategies-A review.Anal Chim Acta. 2021 Mar 1;1148:238187. doi: 10.1016/j.aca.2020.12.062. Epub 2020 Dec 31. Anal Chim Acta. 2021. PMID: 33516384 Review.
-
Research Progress on Rolling Circle Amplification (RCA)-Based Biomedical Sensing.Pharmaceuticals (Basel). 2018 Apr 21;11(2):35. doi: 10.3390/ph11020035. Pharmaceuticals (Basel). 2018. PMID: 29690513 Free PMC article. Review.
Cited by
-
Sandwich Immuno-RCA Assay with Single Molecule Counting Readout: The Importance of Biointerface Design.ACS Appl Mater Interfaces. 2024 Apr 10;16(14):17109-17119. doi: 10.1021/acsami.3c18304. Epub 2024 Mar 26. ACS Appl Mater Interfaces. 2024. PMID: 38530402 Free PMC article.
-
Plasmonic Biosensors in Cancer-Associated miRNA Detection.Biosensors (Basel). 2025 Mar 4;15(3):165. doi: 10.3390/bios15030165. Biosensors (Basel). 2025. PMID: 40136963 Free PMC article. Review.
-
Malaria: biochemical, physiological, diagnostic, and therapeutic updates.PeerJ. 2024 Mar 22;12:e17084. doi: 10.7717/peerj.17084. eCollection 2024. PeerJ. 2024. PMID: 38529311 Free PMC article.
References
-
- Wolff N.; Hendling M.; Schönthaler S.; Geiss A. F.; Barišić I. Low-Cost Microarray Platform to Detect Antibiotic Resistance Genes. Sens. Bio-Sens. Res. 2019, 23, 100266.10.1016/j.sbsr.2019.100266. - DOI
-
- Simion M.; Kleps I.; Ignat T.; Condac E.; Craciunoiu F.; Angelescu A.; Miu M.; Bragaru A.; Costache M.; Savu L.. Bioanalytical Silicon Micro-Devices for DNA. In CAS 2005 Proceedings. 2005 International Semiconductor Conference; IEEE, 2005; pp 235–238.
MeSH terms
Substances
LinkOut - more resources
Full Text Sources
