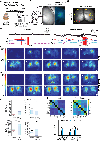
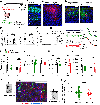
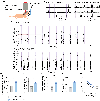
. 2023 Jan 18;111(2):256-274.e10.
doi: 10.1016/j.neuron.2022.10.037. Epub 2022 Nov 28.

Gabrb3 is required for the functional integration of pyramidal neuron subtypes in the somatosensory cortex

Affiliations

Gabrb3 is required for the functional integration of pyramidal neuron subtypes in the somatosensory cortex

Rachel Babij et al. Neuron. .

Abstract

Dysfunction of gamma-aminobutyric acid (GABA)ergic circuits is strongly associated with neurodevelopmental disorders. However, it is unclear how genetic predispositions impact circuit assembly. Using in vivo two-photon and widefield calcium imaging in developing mice, we show that Gabrb3, a gene strongly associated with autism spectrum disorder (ASD) and Angelman syndrome (AS), is enriched in contralaterally projecting pyramidal neurons and is required for inhibitory function. We report that Gabrb3 ablation leads to a developmental decrease in GABAergic synapses, increased local network synchrony, and long-lasting enhancement in functional connectivity of contralateral-but not ipsilateral-pyramidal neuron subtypes. In addition, Gabrb3 deletion leads to increased cortical response to tactile stimulation at neonatal stages. Using human transcriptomics and neuroimaging datasets from ASD subjects, we show that the spatial distribution of GABRB3 expression correlates with atypical connectivity in these subjects. Our studies reveal a requirement for Gabrb3 during the emergence of interhemispheric circuits for sensory processing.

Keywords: Angelman; GABA; GABRB3; callosal projections; corpus callosum; interhemispheric connectivity; network synchrony; projection neurons; pyramidal neurons.


Conflict of interest statement

Declaration of interests The authors declare no competing interests.

Figures
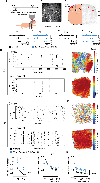
Figure 1.
Figure 1.. Long-lasting network synchronization after Gabrb3 developmental deletion in cortical glutamatergic neurons.
A) Schematic representation of experimental procedures for the imaging of LII/III pyramidal neurons. P7: n=12 non-overlapping FOVs from 4 mice (control), 17 FOVs from 8 mice (Emx1.Gabrb3); P10: n=9 FOVs from 4 mice (control), 13 FOVs from 8 mice (Emx1.Gabrb3); P14: n=7 FOVs from 6 mice (control), 14 videos FOVs from 6 mice (Emx1.Gabrb3). B) GCaMP6s expression in S1 pyramidal neurons of a P14 Emx1.GCaMP6s (control) mice. Scale bar = 100μm. C) DAPI labeling delineates the location of the cranial window. Scale bar = 500μm. D-G) Representative dF/F traces of 3 pyramidal neurons from Emx1.GCaMP6s mice at P7 (D) and P14 (F) and from Emx1.Gabrb3.GCaMP6s mice at P7 (E) and P14 (G). H) Representative rastergram for calcium event onset in Emx1.GCaMP6s (top panel) and Emx1.Gabrb3.GCaMP6s (bottom panel) mice at P7. I) Visualization of networks at P7 corresponding to recordings in (H): Emx1.GCaMP6s (top panel), Emx1.Gabrb3.GCaMP6s (bottom panel). Gray contours represent somas. Lines connect cell pairs exhibiting significantly correlated activity. Line color indicates the magnitude of the correlation coefficient. J) Representative rastergram for calcium event onset in Emx1.GCaMP6s (top panel) and Emx1.Gabrb3.GCaMP6s (bottom panel) mice at P14. K) Visualization of networks at P14 corresponding to recordings in (J): Emx1.GCaMP6s (top panel), Emx1.Gabrb3.GCaMP6s (bottom panel). L) Quantification of the average correlation coefficient in Emx1.GCaMP6s (black) vs. Emx1.Gabrb3.GCaMP6s (blue) at P7 and P14. Two-way ANOVA for genotype ****p<0.0001 (Side asterisks); Sidak’s multiple comparison: P7 **p=0.002, P14 **p=0.003. Two-way ANOVA for age ****p<0.0001; Sidak’s multiple comparison: P7 vs. P14 control **p=0.009, Emx1.Gabrb3 **p=0.003 (top asterisks). M-N) Comparison of the correlation coefficient by distance in Emx1.GCaMP6s (black) vs. Emx1.Gabrb3.GCaMP6s (blue) at P7 (M) and P14 (N). Data per group fitted to an exponential decay function (solid lines), comparing the fit between control and mutants. Extra sum-of-squares F-test at P7 ** p=0.0026 and at P14 **** p<0.0001. Data represent mean ± SEM.
Figure 2.
Figure 2.. Early GABAergic dysfunction upon Gabrb3 deletion in pyramidal neurons.
A-C) Optogenetic assessment of GABAergic function in control and Emx.Gabrb3 mice at P7. A) AAV1.mDlx.ChR2.mCherry expression in GABAergic interneurons mediates light-evoked action potentials in targeted recordings of interneurons expressing the virus (mCherry+) at P7. B) Left: recording configuration of light-evoked IPSCs in layer II/III Pyr. Right: representative GABAergic currents in response to light stimulation in control (black) and Emx.Gabrb3 (red) mice. The dark lines represent the average and the shaded area the SEM across multiple trials of stimulation. The blue line represents the onset and duration of optical stimulation. C) Quantification of evoked IPSC amplitude. Control: n = 9 pyr; Emx1.Gabrb3: n = 8 pyr (t-test *p=0.026). D-E) Anatomical characterization of GABAergic synapses in control and Emx1.Gabrb3 mice at P7. Scale bars= 10μm. D) Top: Representative image depicting immunolabeling for VGAT (red) and gephyrin (green) in L II/III of S1, DAPI in blue. Bottom: Higher magnification indicating putative GABAergic synapses delineated by the colocalization of VGAT and gephyrin puncta (arrowheads). E) Quantification of GABAergic synaptic density per area. Control (6 mice) vs. Emx1.Gabrb3 (5 mice); t-test *p=0.027. F) Schematic representation of the recording configuration for mIPSCs (0 mV) in L II/III pyr in control and Emx1.Gabrb3 mice at P14-16. G) Sample traces of mIPSCs recorded in Pyr of control (black) and Emx1.Gabrb3 mice (red). H) Overlay of representative normalized average mIPSCs, corresponding to the traces in H). I-M) mIPSC analysis summary. Control: n = 8 pyramidal neurons; Emx1.Gabrb3: n = 9 pyramidal neurons. I) mIPSC frequency (t-test **p=0.007). J) mIPSC amplitude (t-test ns). K) mIPSC decay (t-test *p=0.042). L) mIPSC unitary charge (t-test *p=0.045). M) mIPSC total charge (t-test **p=0.003). N) mEPSC/mIPSC total charge ratio. Control: n = 7 Pyr; Mutant: n = 8 Pyr. (Mann-Whitney test *p = 0.014). Data represent mean ± SEM.
Figure 3.
Figure 3.. SepW1.Gabrb3 mice show increased contralateral axonal coverage and correlated activity across postnatal development.
A) Schematic representation for the anatomical tracing of axonal terminals via in utero electroporation. Emx1Cre or wild type (control), Emx1.Gabrb3, or Emx1.Gabrg2 mice were electroporated at E15.5 with a pAAV.CAG.mGFP plasmid. Analysis of contralateral axonal arborization was performed at P14-16. B) Representative images of axonal arborization in S1 contralateral to the electroporation site. Scale bar = 100μm; n=7 control, n=5 Emx1.Gabrb3 mice; n=10 control, n=7 Emx1.Gabrg2 mice. C) Schematic representation for the anatomical tracing of axonal terminals via intracranial injections. D) Representative images of axonal arborization in S1 contralateral to the injection site. Scale bar = 100μm; n=10 control vs. n=9 SepW1.Gabrb3 mice. E) Quantification of axonal coverage. Control vs Emx1.Gabrb3: Mann-Whitney test, *p=0.018. Control vs. Emx1.Gabrg2: Mann-Whitney test, ***p=0.0004. Control vs. SepW1.Gabrb3: Mann-Whitney test, *p=0.015. au, arbitrary units. F-H) Axonal coverage by lamina. (F) Control vs. Emx1.Gabrb3: Two-way ANOVA for genotype ***p=0.0004, lamina p=0.01. Sidak’s multiple comparison testing: LII/III *p=0.01, other lamina not significant. G) Axonal coverage by lamina. Control vs. Emx1.Gabrg2: Two-way ANOVA for genotype ****p<0.0001, lamina p<0.0001. Sidak’s multiple comparison testing: LI, LII/III ****p<0.0001, other lamina not significant. H) Axonal coverage by lamina. Control vs. SepW1.Gabrb3: Two-way ANOVA for genotype ****p<0.0001. Sidak’s multiple comparison testing: LII/III ***p=0.0009, other lamina not significant. (I-L, top) Representative images (top) of axonal arborization in S1 target regions ipsilateral to viral injection site in control (left) and SepW1.Gabrb3 (right) mice. Scale bars = 100μm. (I-L, bottom) Quantification of normalized axonal coverage in ipsilateral S2 (I), temporal association area (TeA) (J), posterior parietal cortex (PPC) (K) and motor cortex (M1/2) (L). Mann-Whitney test, ns. M) GCaMP6s expression in pyramidal neurons in S1 Pyr of a P14 SepW1.GCaMP6s (control) mice. Scale bar = 100μm. N) Representative dF/F traces of 3 pyramidal neurons from SepW1.GCaMP6s mice at P7 (top left) and P14 (top right) and from SepW1.Gabrb3.GCaMP6s mice at P7 (bottom left) and P14 (bottom right). O) Visualization of networks at P7 (top panels) and P14 (bottom panels) in SepW1.GCaMP6s (left panels), SepW1.Gabrb3.GCaMP6s (right panels). P) Quantification of the average correlation coefficient in SepW1.GCaMP6s (black) vs. SepW1.Gabrb3.GCaMP6s (blue) at P7 and P14. Two-way ANOVA for genotype **p=0.006 (side asterisks) Sidak’s multiple comparison: P7 p=0.06, P14 p=0.12. Two-way ANOVA for age **** p<0.0001 Sidak’s multiple comparison: P7 vs. P14 Control ****p<0.0001, SepW1.Gabrb3 ****p<0.0001 (top asterisks). Q-R) Comparison of the correlation coefficient by distance in SepW1.GCaMP6s (black) vs. SepW1.Gabrb3.GCaMP6s (blue) at P7 (Q) and P14 (R). Data per group fitted to an exponential decay function (solid lines). Extra sum-of-squares F-test, both P7 and P14 **** p<0.0001. For panels P-R: SepW1.GCaMP6s at P7 (n=6 FOVs from 3 mice); P14 (n=10 FOVs from 3 mice) and SepW1.Gabrb3.GCaMP6s at P7 (n=5 FOVs from 2 mice); P14 (n=7 videos FOVs from 2 mice). Data represent mean ± SEM.
Figure 4.
Figure 4.. Selective increase of interhemispheric connectivity in Emx1.Gabrb3 mice.
A) Schematic representation of experimental procedure used to trace afferent inputs onto pyramidal neurons (n=5 control mice, 5 Emx1.Gabrb3 mice). B) Starter neurons (right) co-express both BFP (RbV, pseudocolored in red) and GFP (electroporation construct). C) Representative images of S1 ipsilateral to the electroporation and injection sites in Emx1Cre (control, left two images) and Emx1.Gabrb3 (right two images). Scale bar 100μm. Dotted lines indicate laminar boundaries. D) Representative images of contralateral S1 in Emx1Cre (control, left two images) and Emx1.Gabrb3 mice (right). Scale bar 100μm. E) Quantification of number of starter neurons per brain, Mann-Whitney test, ns. F) Ratio of rabies-infected ipsilateral neurons over the total number of starter neurons, Mann-Whitney, ns. G) Laminar distribution of rabies-infected neurons in ipsilateral S1. Two-way ANOVA, ns for genotype. H) Ratio of rabies-infected contralateral neurons over the total of starter neurons, Mann-Whitney *p=0.03. I) Laminar distribution of rabies-infected neurons in contralateral S1. Two-way ANOVA for genotype p=0.0036, for lamina p=0.0059. Sidak’s post-hoc: LII/III *p=0.049, LV *p=0.02. Data represent mean ± SEM.
Figure 5.
Figure 5.. Increased functional contralateral connectivity in Emx1.Gabrb3 mice.
A) Experimental procedure for widefield in vivo calcium at P14. B) Map of dorsal cortical regions (left), and representative images of brightfield (middle) and calcium-mediated responses (right), taken during whisker stimulation to localize the barrel cortex. S1, primary somatosensory cortex; V1, primary visual cortex; bfd: barrel field; TeA, temporal association area; M1/2, motor cortex. Scale bar 1mm. C) The placement of seed locations. Each seed covers an area of 0.2 X 0.2 mm. D-E) Simultaneous recordings of LFP and calcium signal. LFP (top) and calcium traces (bottom) from 4 different locations in control (D) and Emx1.Gabrb3 mice (E). Vertical red lines indicate the time points at which the 2D calcium image was generated. F) 2D calcium activity during spontaneous activity. In control (F) (heatmap normalized to 20% dF/F) and Emx1.Gabrb3 mice (G) (heatmap normalized to 40% dF/F). H) Comparison of LFP and calcium activity in control (n=3) and mutant (n=2) mice. Top: boxplots of standard deviation (t-test, **p = 0.009) and power of LFP (t-test, p = 0.472). Bottom: area under curve (AUC) (t-test, p = 0.370) and maximal amplitude (t-test, p = 0.155) of calcium traces recorded from the ROI shown in C. I-J) Global correlation of calcium activity. I) Correlation matrix among different seeds in control and Emx1.Gabrb3 mice. J) Correlation in selected seed pairs between control and mutant mice. (t-test, ncontrol = 29 sections from 3 mice, nmutant= 27 sections from 2 mice, *: p<0.05). The Spearman correlation between different seeds was transformed into a Z-score by Fisher z-transformation and normalized to the intra-S1 Z-score. Data represent mean ± SEM.
Figure 6.
Figure 6.. Gabrb3 is highly expressed in contralaterally projecting pyramidal cells and is necessary for inhibitory synaptic function
A) Schematic representation for the identification of projection neurons as defined by their targets (n=4 control mice; n=4 Emx1.Gabrb3 mice). B-C) Representative images of the injection site in left S1 (B) and right M1 (C). Scale bar = 100μm. D) Representative images of presynaptic cells in right S1 in control (left) and Emx1.Gabrb3 (right) mice. Scale bar = 100μm. E) Normalized number of contralaterally projecting neurons (cS1-projecting). Mann-Whitney test, *p=0.029. F) Normalized number of ipsilateral M1-projecting neurons. Mann-Whitney test, ns. G) Percentage of neurons in right S1 that co-express both mCherry and GFP in controls (2.08%) and Emx1.Gabrb3 mice (1.58%), Mann-Whitney test, ns. H) Schematic representation for the recording of mIPSCs in layer II/III S1 Pyr projecting to contralateral S1 (cS1 projecting, in green) or ipsilateral M1 (iM1 projecting, in red) at P13-16. I-J) Sample traces of mIPSCs recorded in cS1 (I) and iM1 (J) projecting neurons in control (black) and Emx1.Gabrb3 mice (green/red). K) Normalized average mIPSCs, corresponding to the traces in I-J. Top: cS1 projecting, bottom: M1 projecting. L-O) Analysis for mIPSC recorded in cS1 projecting neurons (Control: n=15 neurons; Emx1.Gabrb3: n =17 neurons) and M1 projecting neurons (Control: n=11 neurons; Emx1.Gabrb3: n =11 neurons). L) mIPSC frequency (two-way ANOVA genotype *p=0.045; cS1: control vs. Emx1.Gabrb3, Bonferroni multiple comparison *p=0.010; M1: control vs. Emx1.Gabrb3, Bonferroni multiple comparison ns). M) mIPSC amplitude (two-way ANOVA genotype ns). N) mIPSC decay (two-way ANOVA genotype *p=0.016; cS1: control vs. Emx1.Gabrb3, Bonferroni multiple comparison *p=0.025; M1: control vs. Emx1.Gabrb3, Bonferroni multiple comparison ns). O) mIPSC total charge (two-way ANOVA genotype p=0.007; cS1: control vs. Emx1.Gabrb3, Bonferroni multiple comparison **p=0.004; M1: control vs. Emx1.Gabrb3, Bonferroni multiple comparison ns). P) Representative image of RNA FISH against Gabrb3 (blue) in cS1 (green) and iM1-projecting (red) neurons retrogradely labelled as in A), scale bar 50μm. Insets: high magnification images of Gabrb3 RNA expression (black) in the isolated cS1(a) and iM1-projecting neurons (b) (white boxes), dotted line indicates the somatic perimeter, scale bar 10μm. Q) Quantification of Gabrb3 expression in cS1and M1-projecting neurons, as the % somatic coverage of the fluorescent RNA FISH signal. cS1 44.2±1.47 (n=168 Pyr) vs. M1 33.6±2.02 (n=72 Pyr), t-test ****p<0.0001. Data represent mean ± SEM.
Figure 7.
Figure 7.. Increased whisker-evoked responses in Emx1.Gabrb3 mice at P7.
A) Schematic representation for imaging of LII/III Pyr in whisker stimulation experiments at P7. B) Three representative traces of single-cell calcium responses during whisker stimulation (purple vertical lines) in Emx1.GCaMP6s (left) and Emx1.Gabrb3.GCaMP6s (right) mice. C) Representative event histograms and rastergrams for control Emx1.GCaMP6s (top) and Emx1.Gabrb3.GCaMP6s (bottom) mice. Dark purple vertical lines mark the onset of whisker stimulation (WS) by air puff and vertical purple shaded areas depict the time windows during which network events were quantified. Red horizontal lines indicate the threshold for network events. Each line in the rastergram represents a calcium event from onset to offset. D) Percentage of neurons active in whisker-evoked network events. Control vs. Emx1.Gabrb3, t-test *p=0.016. (Control n=5 FOV from 3 mice; Emx1.Gabrb3 n=5 FOV from 3 mice). E) Percentage of whisker-responsive cells. Control vs. Emx1.Gabrb3, t-test *p=0.028. F) Percentage of network events evoked by whisker stimulation. Control vs. Emx1.Gabrb3, t-test ns. G) Quantification of the average correlation coefficient after whisker stimulation. Control vs. Emx1.Gabrb3, t-test **p=0.001. H) Quantification of the average correlation over distance after whisker stimulation. Control vs. Emx1.Gabrb3, Extra sum-of-squares F-test ****p<0.0001. Data represent mean ± SEM.
Figure 8.
Figure 8.. Variability in Gabrb3 expression during adolescence underlies atypical functional connectivity in humans.
A) Overview of the PLS regression analysis to test for correlations between the AHBA dataset and atypical functional connectivity in ASD (ABIDE fMRI data set, ASD n= 261; 227 male, 34 female; ages 12–18, controls n= 235;187 male, 48 female; ages 12–18). B) Scatterplot and linear fit defining the association between latent gene expression scores for the first PLS component from the PLS model (X axis) and atypical connectivity for the first PLS component (Y axis). Gene expression explained 12.1% of the variance in atypical connectivity (Y), and this was significantly more explained variance than expected by chance in both a shuffled spatially aware spin test (p=0.007) and a random permutation test (p=0.006). C) Comparison of the bootstrapped gene weight for GABRB3 expression with an empirical null distribution from PLS analysis (ages 12–18). GABRB3 has a significantly stronger negative weight than expected by chance (p=0.03). D) Glass brain maps depicting the spatial distribution of atypical connectivity (top) and gene expression score (bottom) across the 213 brain ROIs. Atypical connectivity and the gene expression Z scores were rescaled from 0–1 (see color bar). E) Bar plot of the bootstrapped gene weight and rank for the first PLS component across all 10,438 genes from the age-restricted PLS analysis. High-risk ASD genes shown in red. Weakly associated ASD genes, shown in blue. F) Scatterplot and linear fit of how well the normalized gene expression for GABRB3 explained the latent gene expression score for the first PLS component across all ROIs. Decreased expression of GABRB3 was correlated with increases in atypical connectivity.

Comment in

Similar articles

Cited by

References

    1. Rubenstein JL, and Merzenich MM (2003). Model of autism: increased ratio of excitation/inhibition in key neural systems. Genes Brain Behav 2, 255–267. 10.1034/j.1601-183x.2003.00037.x. - DOI - PMC - PubMed
    1. Chao HT, Chen H, Samaco RC, Xue M, Chahrour M, Yoo J, Neul JL, Gong S, Lu HC, Heintz N, et al. (2010). Dysfunction in GABA signalling mediates autism-like stereotypies and Rett syndrome phenotypes. Nature 468, 263–269. 10.1038/nature09582. - DOI - PMC - PubMed
    1. Frohlich J, Miller MT, Bird LM, Garces P, Purtell H, Hoener MC, Philpot BD, Sidorov MS, Tan WH, Hernandez MC, et al. (2019). Electrophysiological Phenotype in Angelman Syndrome Differs Between Genotypes. Biol Psychiatry 85, 752–759. 10.1016/j.biopsych.2019.01.008. - DOI - PMC - PubMed
    1. Parikshak NN, Luo R, Zhang A, Won H, Lowe JK, Chandran V, Horvath S, and Geschwind DH (2013). Integrative functional genomic analyses implicate specific molecular pathways and circuits in autism. Cell 155, 1008–1021. 10.1016/j.cell.2013.10.031. - DOI - PMC - PubMed
    1. Sanders SJ, He X, Willsey AJ, Ercan-Sencicek AG, Samocha KE, Cicek AE, Murtha MT, Bal VH, Bishop SL, Dong S, et al. (2015). Insights into Autism Spectrum Disorder Genomic Architecture and Biology from 71 Risk Loci. Neuron 87, 1215–1233. 10.1016/j.neuron.2015.09.016. - DOI - PMC - PubMed

Publication types