. 2022 Nov 29;13(1):7344.
doi: 10.1038/s41467-022-35059-x.

EZH2-H3K27me3 mediated KRT14 upregulation promotes TNBC peritoneal metastasis

Affiliations

EZH2-H3K27me3 mediated KRT14 upregulation promotes TNBC peritoneal metastasis

Ayushi Verma et al. Nat Commun. .

Abstract

Triple-Negative Breast Cancer (TNBC) has a poor prognosis and adverse clinical outcomes among all breast cancer subtypes as there is no available targeted therapy. Overexpression of Enhancer of zeste homolog 2 (EZH2) has been shown to correlate with TNBC's poor prognosis, but the contribution of EZH2 catalytic (H3K27me3) versus non-catalytic EZH2 (NC-EZH2) function in TNBC progression remains elusive. We reveal that selective hyper-activation of functional EZH2 (H3K27me3) over NC-EZH2 alters TNBC metastatic landscape and fosters its peritoneal metastasis, particularly splenic. Instead of H3K27me3-mediated repression of gene expression; here, it promotes KRT14 transcription by attenuating binding of repressor SP1 to its promoter. Further, KRT14 loss significantly reduces TNBC migration, invasion, and peritoneal metastasis. Consistently, human TNBC metastasis displays positive correlation between H3K27me3 and KRT14 levels. Finally, EZH2 knockdown or H3K27me3 inhibition by EPZ6438 reduces TNBC peritoneal metastasis. Altogether, our preclinical findings suggest a rationale for targeting TNBC with EZH2 inhibitors.


Conflict of interest statement

The authors declare no competing interests.

Figures
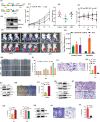
Fig. 1
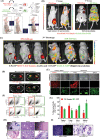
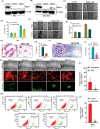
Fig. 1. H3K27me3 but not NC-EZH2 protein promotes TNBC metastasis.
A Schematic representation of EZH2 (Y641-F) and EZH2–ΔSET retroviral overexpression constructs. B Immunoblot analysis for EZH2, H3K27me3, and β-actin expression in control, stable EZH2 (Y641-F), and EZH2 (ΔSET) overexpressed (OE) 4T-1 cells. C Tumor growth curve is shown in control, EZH2 (Y641-F) OE, and EZH2 –ΔSET OE; data are represented as mean, error bar ± SD, left to right *P = 0.0064, #P = 0.0001, @P = 0.0025, respectively, compared to control, two way ANOVA, Dunnett’s multiple comparisons test. D Average weight of harvested tumors of Control, EZH2 (Y641-F) OE, and EZH2–ΔSET OE groups depicted by the graph, (n = 6) each group, data are represented as mean ± SD, *P = 0.0068, compared to control, one way ANOVA, Dunnett’s multiple comparisons test. E The body weight curve is shown for control, EZH2 (Y641-F) OE, and EZH2 –ΔSET OE; (n = 5) each group, data are represented as mean, error bar ± SD, E: left to right *P = 0.0102 and #P = 0.013, respectively, compared to control, two way ANOVA, Dunnett’s multiple comparisons test. F In vivo bioluminescence monitoring of orthotopic control (left panel), EZH2 (Y641-F) OE 4T-1 Luc2- GFP (middle panel) and EZH2 –ΔSET OE (right panel) primary tumor and distant metastatic sites. The color scale indicated the photon flux (photon/ sec) emitted from each group. G Quantitative bar graph representation of total photon flux calculated from the region of flux (ROI), compared to control, (n = 3) each group, data are represented as mean, error bar ± SD, *P = 0.0021, compared to control, two way ANOVA, Turkey’s multiple comparisons test. H Representative images of the wound healing assay to measure the migration ability of control and EZH2 (Y641-F) OE and EZH2 –ΔSET OE 4T-1 cells in time point manner (0, 12, and 24 h), magnification 10×. I The quantitative analysis of wound healing assay; *P = 0.0001 and *P = 0.0002, two-way ANOVA, Dunnett’s multiple comparisons test. J Representative images of the trans-well chamber migration assay to measure the invasion ability of control and EZH2 (Y641-F) OE and EZH2–ΔSET OE 4T-1 cells at 24 h. K The quantitative bar graphs of tans-well chamber migration assay of control and EZH2 (Y641-F) OE and EZH2 –ΔSET OE 4T-1 cells in 24 h. *P = 0.0001 and #P = 0.0001, one-way ANOVA, Dunnett’s multiple comparisons test. L Immunoblot analysis for UTX, EZH2, H3K27me3, and β-actin expression in control and UTX KD 4T-1 cells. M Representative images of the trans-well chamber migration assay to measure the invasion ability of control and UTX KD 4T-1 cells at 48 h. N The quantitative bar graphs of tans-well chamber migration assay of control and UTXKD 4T-1 cells at 48 h; *P = 0.0001, Student’s t-test (two-sided). O Immunoblot analysis for EZH2, H3K27me3, and GAPDH expression in control, EZH2 OE, and EZH2 -EZH1 SET HCC1806 cells. P Representative images of the trans-well chamber migration assay to measure the invasion ability of control, EZH2 OE, and EZH2 -EZH1 SET HCC1806 cells at 24 h. Q The quantitative bar graphs of tans-well chamber migration assay of control and EZH2 OE and EZH2 -EZH1 SET cells at 24 h. *P = 0.0001, Student’s t-test (two-sided). R The 4T-1 cells were either treated for a vehicle or 10 μM EPZ6438 to analyze the expression of EZH2, H3K27me3, and β-actin by Immunoblot. S Representative images of trans-well chamber assay to analyze the invasion ability of control and EPZ6438 (10 μM) treated 4T-1 cells. T The quantitative bar graphs of tans-well chamber migration assay of control and EPZ6438 (10 μM) at 48 h. *P = 0.0006, Student’s t-test (one-sided). In I, K, N, Q, and T, Columns are the mean of triplicate readings; error bar ± SD. P values are calculated as compared to the control. Source data are provided as a Source Data file.
Fig. 2
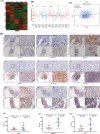
Fig. 2. Functional hyper-activation of EZH2 (increased H3K27me3) leads to TNBC splenic metastasis.
A Schematic representation for generation of control Td-Tomato+ and H3K27me3High (Y641-F) GFP + 4T-1 cells by retroviral transduction (upper panel). The schematic delineation of different strategies used in the in vivo studies (lower panel). B, C Live fluorescence imaging of primary tumors and distant metastatic sites were shown under different strategies (described in Methods, Animal studies section). The excitation and emission wavelength: Td-Tomato- 570-620 nm and GFP-465-520 nm. D The fluorescence imaging of harvested control (Td-Tomato+) and EZH2 Y641-F (GFP+) primary tumors at a specific wavelength (upper panel). The metastatic potential of control (Td-Tomato+) and EZH2 Y641-F (GFP+) cells was analyzed by fluorescence imaging in the harvested organs at a specific wavelength (lower panel). E The fluorescence images of single-cell harvested from both tumors control (Td-Tomato+) and EZH2 Y641-F (GFP+) and harvested organs (n = 3). Scale bar 50 μm. F Representative flow cytometry-derived scatter plots showing control (Td-Tomato+) and EZH2 Y641-F (GFP+) cells in primary tumors and metastatic organs harvested from mice (n = 3). G The quantitative analysis of the percentage of Control (Td-Tomato+) and EZH2 Y641-F (GFP+) cells in harvested primary tumors and metastatic organs (n = 3), data are represented as mean, error bar ± SD, *P = 0.0120 and #P = 0.00484, respectively, compared to Td-Tomato group, two way ANOVA, Sidak’s multiple comparisons test. H Photomicrographs of H&E staining in the lung, liver, and spleen of control and Y641-F tumor-bearing mice. Scale bar 50 μm. I Photomicrographs of metastatic cells isolated from the peritoneal fluid of Y641-F tumor-bearing mice under bright field (extreme left) and GFP fluorescence (middle left) panels, respectively. Scale bar 50 μm. The excitation and emission wavelength: GFP-465-520 nm. Colony formation assay was carried out in metastatic cells isolated from the peritoneal fluid of Y641-F tumor-bearing mice, stained with crystal violet, and photo-micrographic images were taken under bright field (middle right) and inset (extreme right) panels. Source data are provided as a Source Data file.
Fig. 3
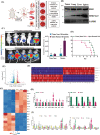
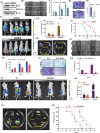
Fig. 3. Transcriptome analysis revealed that overexpression of EZH2 catalytic function (elevated H3K27me3) increases KRT14 transcription.
A The schematic representation of experimental planning. B The immunoblot analysis of EZH2, H3K27me3 expression in 4T-1 cells harvested from the primary tumor and metastatic organs; GAPDH was used as a loading control. C The in vivo imaging of mice having a primary tumor and splenic metastatic cell inoculation (n = 5). The color scale indicated the photon flux (photon/s) emitted from each group. C Quantitative bar graph representation of total photon flux calculated from the region of flux (ROI), data are represented as mean, error bar ± SD, *P = 0.0038, compared to the primary tumor, two-way ANOVA, Sidak’s multiple comparisons tests. D The Kaplan-Meier survival curve of mammary tumor onset in the nude mice with inoculation of the primary tumor and spleen metastatic cells (n = 6). *P = 0.0150, compared to the primary tumor, log-rank test. E Volcano plot represents the significant differential expression of genes between control and Y641-F cells. Red and blue dots represent the upregulated and downregulated genes with (Log2FC +1, −1, and p < 0.05), respectively. F Heat map of top 100 ranked genes differentially expressed between control and Y641-F phenotype. Expression values are represented as colors, where the range of colors (red, pink, light blue, dark blue) shows the range of expression values (high, moderate, low, lowest), respectively. G Heat map shows differential expression of cell migration and metastasis-related genes between control and Y641-F. H RNA was isolated from control and EZH2 Y641-F 4T-1 cells and subjected to real time-PCR for gene expression analysis. Data points are mean of triplicate readings of samples; error bars, ±S.D, *,#P = 0.0001, @P = 0.0134, $P = 0.001, %,+,&,^P = 0.0001, two way ANOVA, Sidak’s multiple comparisons test. I RNA was isolated from 4T-1 cells isolated from the primary tumor, metastatic lung, liver, and spleen and subjected to real time-PCR for gene expression analysis. Data points are the mean of triplicate readings of samples; error bars, ±S.D, left panel, *P = 0.0162, #P = 0.0101, XP = 0.0031, @P = 0.0002, $P = 0.0065, %P = 0.0039, +P = 0.0001, &P = 0.001, ^P = 0.0001, right panel, *P = 0.0001, #P = 0.0009, @P = 0.0001, $P = 0.0088, %P = 0.0009 and +P = 0.0493, compared to isolated cells from primary tumors, two way ANOVA, Dunnett’s multiple comparisons test. Source data are provided as a Source Data file.
Fig. 4
Fig. 4. H3K27me3 level positively regulates the expression of KRT14 in mRNA and protein levels.
A Immunoblot analysis for EZH2, H3K27me3, β-actin in control, and EZH2 OE HCC1806 cells. B Control and EZH2 Y641-F cells were analyzed for expression of EZH2, H3K27me3, KRT14, and β-actin by Immunoblot. C Immunoblot analysis for EZH2, H3K27me3, β-actin in control, and EZH2 EZH1SET HCC1806 cells. D The control and EZH2 Y641-F cells were treated with a 10 μM dose of EPZ6438 and performed qPCR analysis for KRT14 expression. Data points are the mean of triplicate readings of samples; error bars, ±S.D, compared to control *P = 0.0001 and Y641-F #P = 0.0001, respectively, one-way ANOVA, Turkey’s multiple comparisons test. E The control and EZH2 Y641-F cells were treated with a 10 μM dose of EPZ6438 and analyzed for expression of EZH2, H3K27me3, KRT14, and β-actin by immunoblot. F The vehicle control and Tet-ON EZH2-YFP OE HCC1806 cells were analyzed for expression of EZH2 WT, EZH2-YFP, H3K27me3, KRT14, and β-actin by immunoblot. G The HCC1806 cells were treated either for vehicle control or 10 μM dose of EPZ6438 for the analysis of the expression of KRT14 by RT-qPCR. Data points are the mean of triplicate readings of samples; error bars, ±S.D, *P = 0.0001 compared to control cells, student’s t-test (two-sided). H The HCC1806 and MDAMB468 cells were either treated for a vehicle or 10 μM EPZ6438 to check the expression of EZH2, H3K27me3, KRT14, and β-actin by immunoblot. I HCC-1806 cells were treated with either vehicle or 10 μM EPZ6438 treatments for 24 h, co-stained with H3K27me3 (red) and KRT14 (green) antibodies, and analyzed under a confocal microscope. Scale bar, 50 μm. J, K 4T-1 cells were isolated from primary tumors and metastatic spleen and subjected to confocal analysis after having either co-staining (J) with H3K27me3 (red) and KRT14 (green) or single (K) staining with Ki-67 (red) antibodies. In both cases, DAPI was used to stain the nuclei. Scale bar 20 and 5 μm. Source data are provided as a Source Data file.
Fig. 5
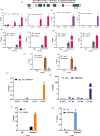
Fig. 5. H3K27me3 occupancy in the KRT14 promoter is linked with active transcription.
A Diagrammatic scheme showing the genomic location of the KRT14 gene for both mice and humans. B ChIP was performed in 4T-1 mouse cells using anti-H3K27me3, p-Pol-II-S5, and IgG antibodies and then examined by real-time qPCR using primer pairs targeting −1.5 to −0.2 kb of the KRT14 gene. C Same procedure for HCC1806 human cells as in (B). D, E The differential fold change enrichment for H3K27me3 and p-Pol-II-S5 were observed in −0.2 and −0.5 kb regions from TSS in control and EZH2-Y641-F cells by ChIP qPCR. F The differential fold change enrichment for H3K27me3 and p-Pol-II-S5 were analyzed in the −0.2 kb region from TSS in the HCC1806 cells treated either with vehicle control or 10 μM EPZ6438. G ChIP was performed in 4T-1 mouse cells using anti-H3K4me3 and IgG antibodies and then examined by real-time qPCR using primer pairs targeting −1.1 to +2.4 kb of the KRT14 gene. H Same procedure for HCC1806 human cells as in (G). I The differential fold change enrichment for H3K4me3 + 2.4 kb region from TSS in control and EZH2- Y641-F 4T-1 cells by ChIP qPCR. J The differential fold change enrichment for H3K4me3 was analyzed in +2.4 kb region from TSS in the HCC1806 cells treated either with vehicle control or 10 μM EPZ6438. BF Columns, are the mean of quadruplicate readings of samples; error bars, ±S.D, B, C compared to IgG control, left to right, *P = 0.0158, #P = 0.0001, %P = 0.0003, $P = 0.0001, &P = 0.0001 and @P = 0.0004, two way ANOVA, Sidak’s multiple comparisons test. DF compared to control, left to right, *P = 0.0029, #P = 0.0025, $P = 0.0022, &P = 0.0024, %P = 0.0036 and +P = 0.0134, two-way ANOVA, Turkey’s multiple comparisons test. GI columns, a mean of duplicate readings of samples, error bars, ±S.D, G, H compared to IgG control, left to right, *P = 0.0023 and #P = 0.0001, two-way ANOVA, Sidak’s multiple comparison test. I compared to VC, *P = 0.0001, two-way ANOVA, Turkey’s multiple comparisons test. J Columns, a mean of triplicate readings of samples, error bars, ±S.D, compared to VC, #P = 0.0082, two-way ANOVA, Turkey’s multiple comparisons test. Source data are provided as a Source Data file.
Fig. 6
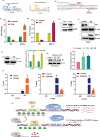
Fig. 6. H3K27me3 enrichment in the KRT14 promoter attenuates SP1 binding and promotes KRT14 expression.
A Diagrammatic representation of the SP1 binding motif obtained from the JASPAR database for a mouse (left) and human (right). B The human nucleotide sequence for KRT14 promoter with TATA and GC-box. C, D The KRT14 mRNA expression was analyzed in the control and SP1 KD HCC1806 (C) and 4T-1 (D) cells by qRT-PCR. left to right, compared to control, *P = 0.0002, #P = 0.0030, $P = 0.0001, and %P = 0.0053, student’s t-test (two-sided). E The control and Y641-F cells were analyzed for SP1 and GAPDH by immunoblot. F The control and SP1 KD 4T-1(Y641-F) cells were analyzed for SP1, KRT14, and β-actin expression by immunoblot. G Control and SP1 KD HCC1806 cells were analyzed for SP1, and β-actin protein expression by immunoblot (left panel), and the control and SP1 KD cells were analyzed for luciferase activity followed by the transfection of −1.1 and −0.5 kb KRT14 promoters (right panel). G Right panel, compared to control, ^P = 0.0010 and @P = 0.0005, two-way ANOVA, Sidak’s multiple comparisons test. H The HCC1806 cells were treated either with vehicle or 150 nM or 300 nM of Mithramycin and subjected to immunoblot analysis for SP1 and β-actin (left panel). Relative luciferase activity was measured as described in the Methods section and represented in the right panel. H: right panel, compared to control, &P = 0.0289 and +P = 0.0201, two-way ANOVA, Dunnett’s multiple comparisons test. I ChIP q-PCR data showing the recruitment of SP1 (left panel), p-Pol-II-S5 (middle panel), and H3K27me3 (right panel) on the KRT14 promoter upon EPZ6438 (10 μM) treatment in HCC1806 cells. I Left to right, compared to control, XP = 0.0052, YP = 0.0097, and ZP = 0.0011, two-way ANOVA, Sidak’s multiple comparisons test. In, C, D, G (right), H (Right), and I Columns represent a mean of triplicate readings of samples, error bars, ±S.D. J Pictorial representation illustrating how H3K27me3 inhibits the SP1 binding to the promoter of the KRT14 gene and activates its transcription. Source data are provided as a Source Data file.
Fig. 7
Fig. 7. Genetic knockdown of KRT14 inhibits splenic metastasis.
A, B The KRT14 knockdown was confirmed through immunoblot by using two different shRNA in 4T-1 and HCC1806 cells. The β-actin is used as a loading control. CF Representative images of the wound healing assay to measure the migration ability of control and KRT14 KD in 4T-1 (C) and HCC1806 (E), magnification 10 ×. D, F The quantitative analysis of wound healing assay. Columns, a mean of quadruplicate readings of samples; error bar, ±SD, *P = 0.0001 and #P = 0.0001, compared to control, two-way ANOVA, Sidak’s multiple comparisons test. GJ Representative images of the trans-well chamber migration assay to measure the invasion ability of control and KRT14 KD 4T-1 (G) and HCC1806 (I) cells at 24 h. The quantitative bar graphs of the trans-well chamber migration assay of control and KRT14 KD 4T-1 (H) and HCC1806 (J) cells are shown. Columns represent a mean of triplicate readings of samples, error bars, ±S.D. compared to control, $P = 0.0002, %P = 0.0058, Student’s t-test (two-sided). K Fluorescence imaging of metastatic cells harvested from spleen (n = 5). The Td-Tomato fluorescence is for control cells, and GFP fluorescence is for KRT14 KD (left panel). Scale bar 50 μm. The excitation and emission wavelength: Td-Tomato-570–620 nm and GFP-465–520 nm. L The quantitative analysis for the metastatic control (Td-Tomato+) and KRT14 KD (GFP+) cells harvested from the spleen (n = 5, three different fields from each spleen), Columns, a mean of fifteen readings of samples, error bar, ±SD, &P = 0.0001, compared to Td-Tomato, Student’s t-test (two-sided). M Representative flow cytometry-derived scatter plots showing control (Td-Tomato+) and EZH2 Y641-F (GFP+) metastatic cells harvested from spleen (n = 5). N The quantitative analysis of the percentage of Control (Td-Tomato+) and KRT14 KD (GFP+) metastatic cells harvested from spleen (n = 5) Columns, a mean of five readings of samples, error bar, ±SD, @P = 0.0001, compared to Td-Tomato, Student’s t-test (two-sided). Source data are provided as a Source Data file.
Fig. 8
Fig. 8. H3K27me3 and KRT14 levels are significantly increased in human TNBC metastasis.
A Analysis of EZH2 and KRT14 transcript levels on the basis of ESR1, PGR, and ERBB2 expression in different PAM50 subtypes represented in a heat map. Data are retrieved from the Breast Cancer (Yau 2010) data set, publicly accessible via XENA USSC Cancer Genome Browser. B Representative of heat map in the form of box and Whiskers plot for Breast Cancer (Yau 2010) PAM50 subtypes, Normal (Brown) n = 66, ESRI s.d. = 1.01, mean = −0.26, PGR s.d. = 2.35, mean = 0.474, ERBB2s.d. = 1.41, mean = −0.212, EZH2 s.d. = 0.80, mean = −0.505 and KRT14 s.d = 2.33, mean = 2.76. Luminal B (sky blue) n = 139, ESR1 s.d. = 0.39, mean = 0.071, PGR, s.d. = 2.44, mean = 0.155, ERBB2 s.d. = 1.36, mean = −0.420, EZH2 s.d. =1.20, mean=0.366, KRT14 s.d = 2.47, mean = −2.28.Luminal A n = 222, ESR1 s.d.=0.45, mean = −0.301, PGR s.d.= 2.27, mean=1.26, ERBB2 s.d.=1.43, mean = −0.195, EZH2 s.d. = 0.725, mean = −0647 and KRT14 s.d. = 2.80, mean = 0.752. HER+ n = 102, ESR1 s.d. = 1.70, mean = −1.842, PGR s.d. = 1.56, mean = −1.48, ERBB2, s.d. = 2.59, mean = 3.29, EZH2 s.d. = 0.78, mean = 0.303 and KRT14 s.d. = 2.79, mean = −1.906. Basal n = 170, ESR1 s.d. = 1.80, mean = −2.76, PGR s.d. = 0.791, mean = −1.54, ERBB2 s.d. = 2.50, mean = −1.18, EZH2 s.d. = 0.98, mean = 1.97 and KRT14 s.d. = 3.42, mean = 1.45. Whiskers for the plot signify SD and the bar denotes the mean for each subtype, where the box extends from 25th to 75th percentile, and whiskers range from minimum and maximum value, with the center denoting the median value. C Correlation plot showing IHC co-expression of the EZH2 and KRT14 in breast cancer TNBC subtype. Pearson pairwise correlation coefficient on 897 TNBC samples shows a positive correlation (r = 0.10) between EZH2 and KRT14 and is significantly associated with each other (p = 0.0018). D Immunohistochemistry was carried out to detect EZH2, H3K27me3, and KRT14 in FFPE serial sections of matched human TNBC primary tumor and respective metastatic counterparts using anti-EZH2, anti-H3K27me3, and anti-KRT14 antibodies. Representative photomicrographs were shown at 10X and 40X magnifications (inset). Scale bar, 200 μm (10×) or 50 μm (40×). EG Quantitative H-scores for TNBC primary tumors and metastatic counterparts (n = 10) were calculated for EZH2 (E), H3K27me3 (F), and KRT14 (G) expression and represented as scatter plots; error bar, ±SD, left to right *P = 0.0047, #P = 0.046, compared to expression in respective primary tumors, Student’s t-test (two-sided). Source data are provided as a Source Data file.
Fig. 9
Fig. 9. Inhibition of EZH2 methyltransferase activity reduces TNBC peritoneal metastasis.
A Immunoblot for EZH2, H3K27me3, and β-actin expression in Control and EZH2 knockdown (KD) 4T-1 cells. BE Representative images of the wound healing (B) and trans-well chamber migration (D) assays in control and EZH2 KD 4T-1 cells, 10× magnification. The quantitative analysis of wound healing (C) and trans-well (E) assay; Columns, mean of triplicate readings of samples, error bar, ±SD, compared to control, *P = 0.0453, two-way ANOVA, Sidak’s multiple comparisons test and #P = 0.0467 student’s t-test (two-sided). F Bioluminescence image of tumor-bearing control (top panel), EZH2 KD (bottom panel) mice. The color scale indicated the photon flux (photon/s) emitted from each group. G Quantitative bar graph representation of total photon flux calculated from the region of flux (ROI). Columns, a mean of quadruplicate readings of samples, error bar, ±SD, $P = 0.0010 compared to control, two-way ANOVA, Sidak’s multiple comparisons tests. H Bioluminescence images of liver and spleen harvested from control and EZH2 KD tumor-bearing mice. I The Kaplan–Meier survival curve of control and EZH2 KD 4T-1 tumor-bearing mice cells (n = 10), %P = 0.0001, compared to control, log-rank test. JM Representative images of the wound healing (J) and trans-well chamber migration (L) assays in 4T-1 EZH2Y641-F (control) and EPZ6438 (10 μM) treated cells, 10× magnification. The quantitative analysis of wound healing (K) and trans-well (M) assay; Columns, a mean of duplicate (K) and triplicate (M) readings of samples, error bar, ±SD, compared to control, &P = 0.0158, ^P = 0.0219, XP = 0.0011, YP = 0.0001, two-way ANOVA, Sidak’s multiple comparisons test. N Representative bioluminescence images of EZH2 (Y641-F) 4T-1 tumor-bearing mice, treated with either vehicle or EPZ6438 (250 mg/Kg). O Quantitative bar graph representation of total photon flux calculated from the region of flux (ROI); columns, a mean reading of triplicate samples, error bar, ±SD, ZP = 0.0078, compared to control, two-way ANOVA, Sidak’s multiple comparisons test. P The bioluminescence analysis of the metastatic signal in the organs harvested from control (Y641-F) and EPZ6438 treated mice. Q The Kaplan–Meier survival curve of nude mice, either treated with vehicle control (n = 5) or EPZ6438 (250 mg/kg) (n = 5). @P = 0.0326, compared to vehicle control, log-rank test. Source data are provided as a Source Data file.
Fig. 10
Fig. 10. EZH2-H3K27me3 in TNBC metastasis.
Schematic representation of how catalytically hyperactive EZH2 (increased H3K27me3) can promote TNBC peritoneal metastasis and its therapeutic vulnerabilities against EZH2 inhibitor EPZ6438.

References

    1. Bray F, et al. Global cancer statistics 2018: GLOBOCAN estimates of incidence and mortality worldwide for 36 cancers in 185 countries. CA Cancer J. Clin. 2018;68:394–424. doi: 10.3322/caac.21492. - DOI - PubMed
    1. Wolff AC, et al. Recommendations for human epidermal growth factor receptor 2 testing in breast cancer: American Society of Clinical Oncology/College of American Pathologists clinical practice guideline update. Arch. Pathol. Lab. Med. 2014;138:241–256. doi: 10.5858/arpa.2013-0953-SA. - DOI - PMC - PubMed
    1. Cheang MC, et al. Basal-like breast cancer defined by five biomarkers has superior prognostic value than triple-negative phenotype. Clin. Cancer Res. 2008;14:1368–1376. doi: 10.1158/1078-0432.CCR-07-1658. - DOI - PubMed
    1. Lehmann BD, et al. Identification of human triple-negative breast cancer subtypes and preclinical models for selection of targeted therapies. J. Clin. Invest. 2011;121:2750–2767. doi: 10.1172/JCI45014. - DOI - PMC - PubMed
    1. Chaffer CL, Weinberg RA. A perspective on cancer cell metastasis. Science. 2011;331:1559–1564. doi: 10.1126/science.1203543. - DOI - PubMed

Publication types

MeSH terms