. 2022 Nov 29;5(1):1309.
doi: 10.1038/s42003-022-04284-x.

CARD11 mutation and HBZ expression induce lymphoproliferative disease and adult T-cell leukemia/lymphoma

Affiliations

CARD11 mutation and HBZ expression induce lymphoproliferative disease and adult T-cell leukemia/lymphoma

Takuro Kameda et al. Commun Biol. .

Abstract

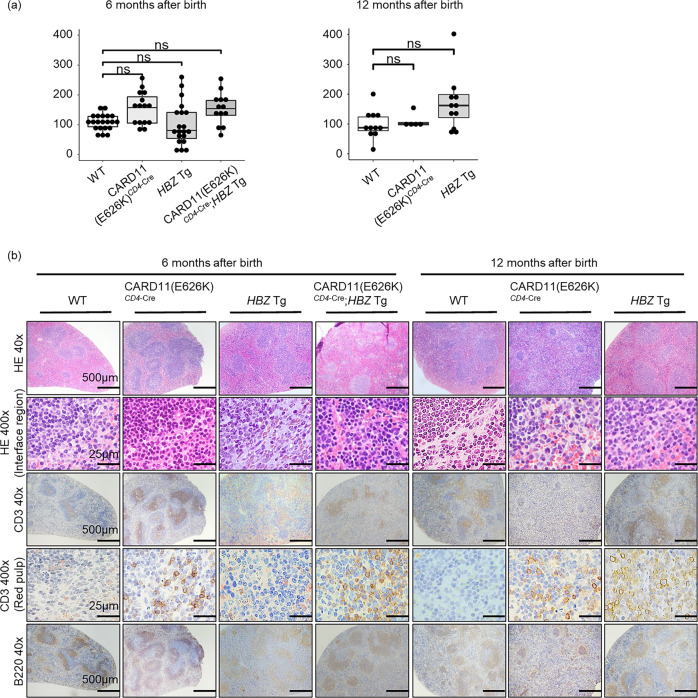
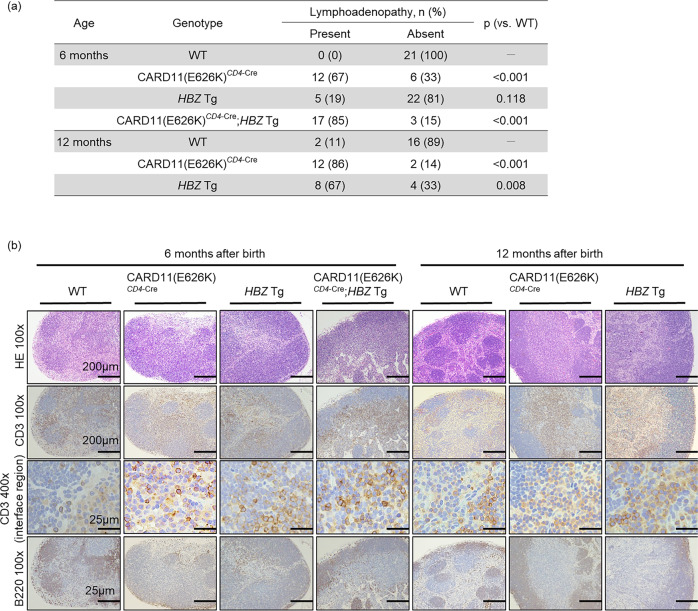
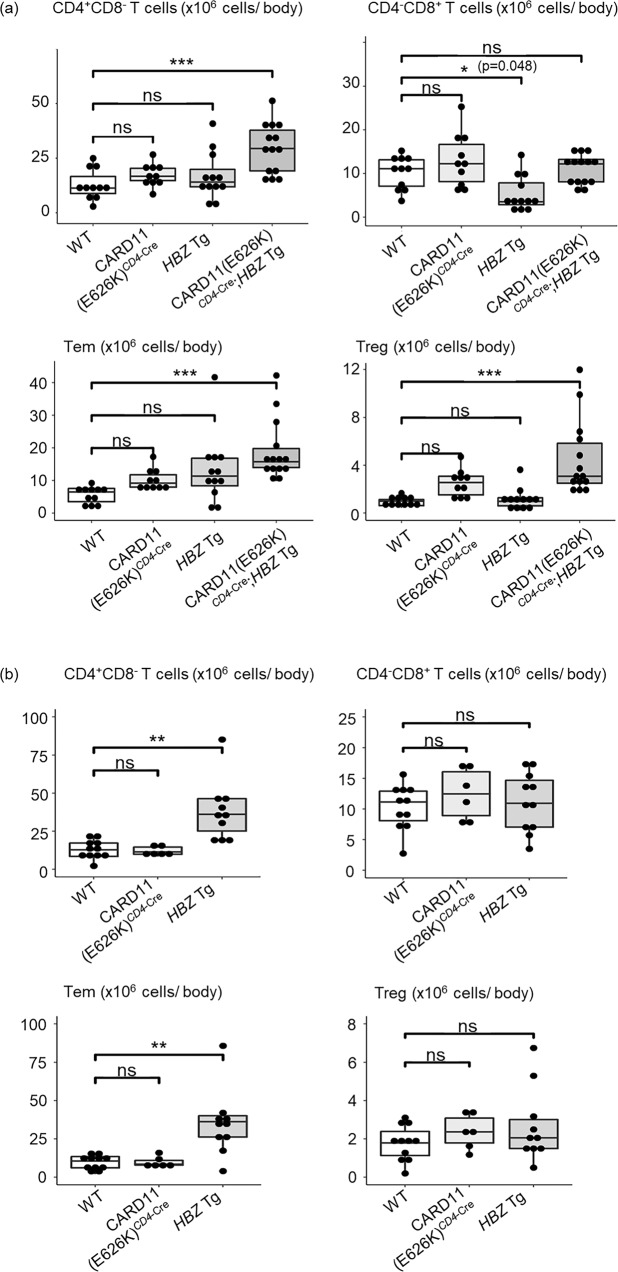
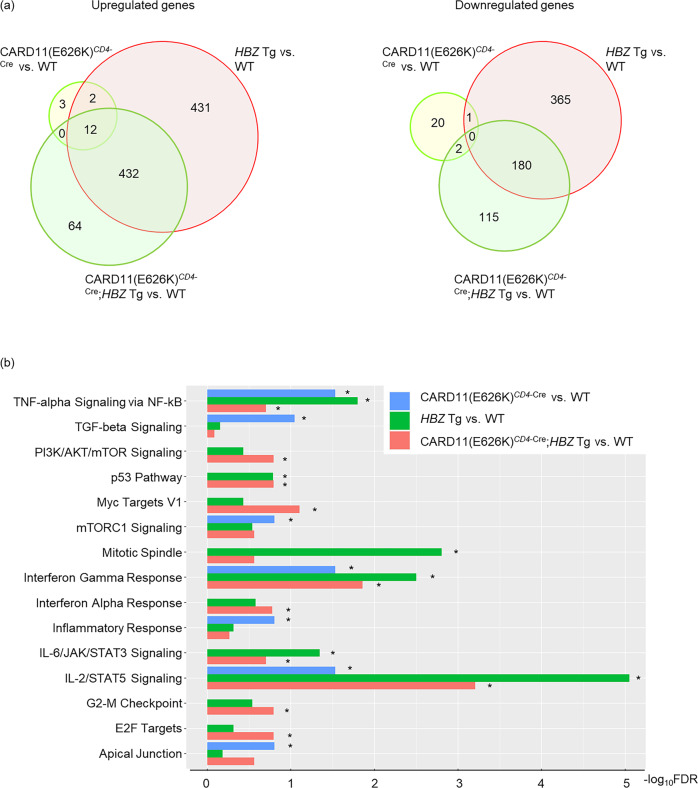
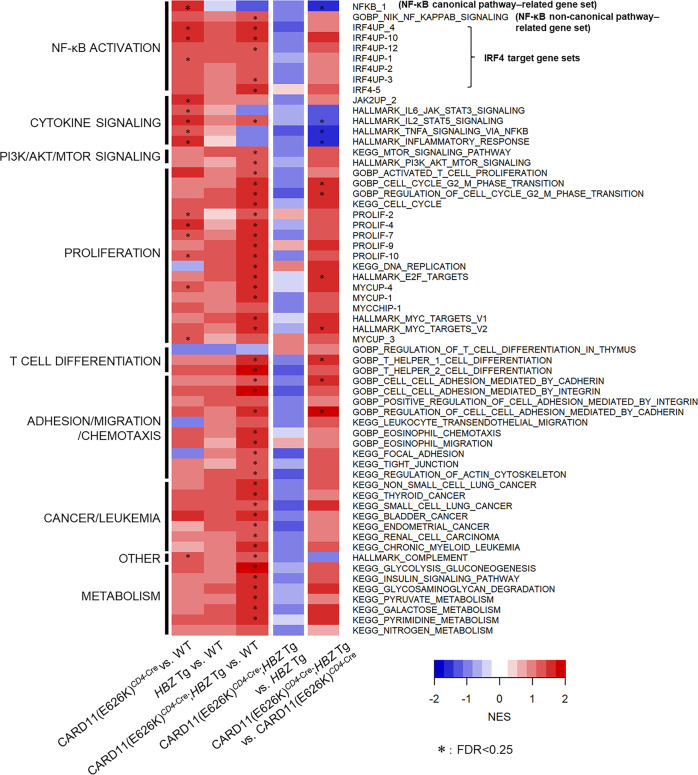
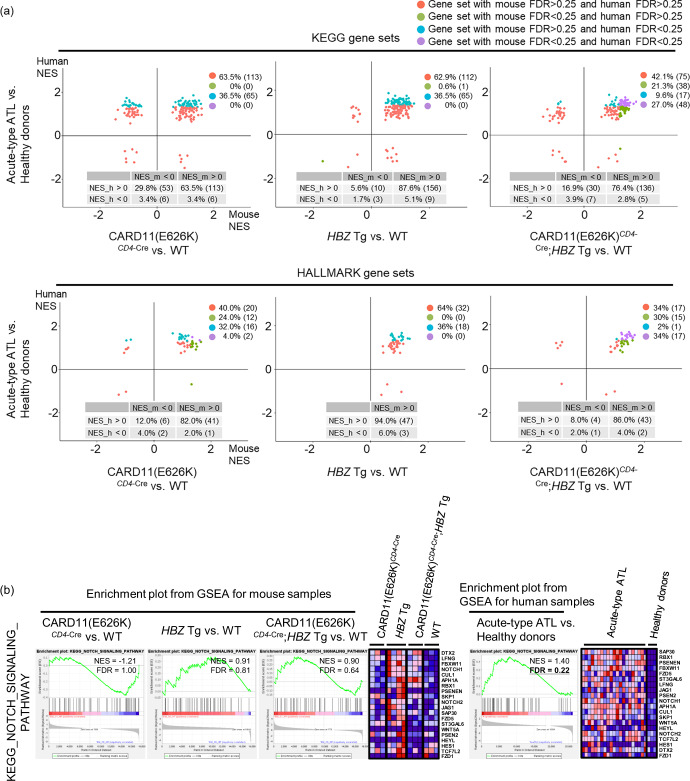
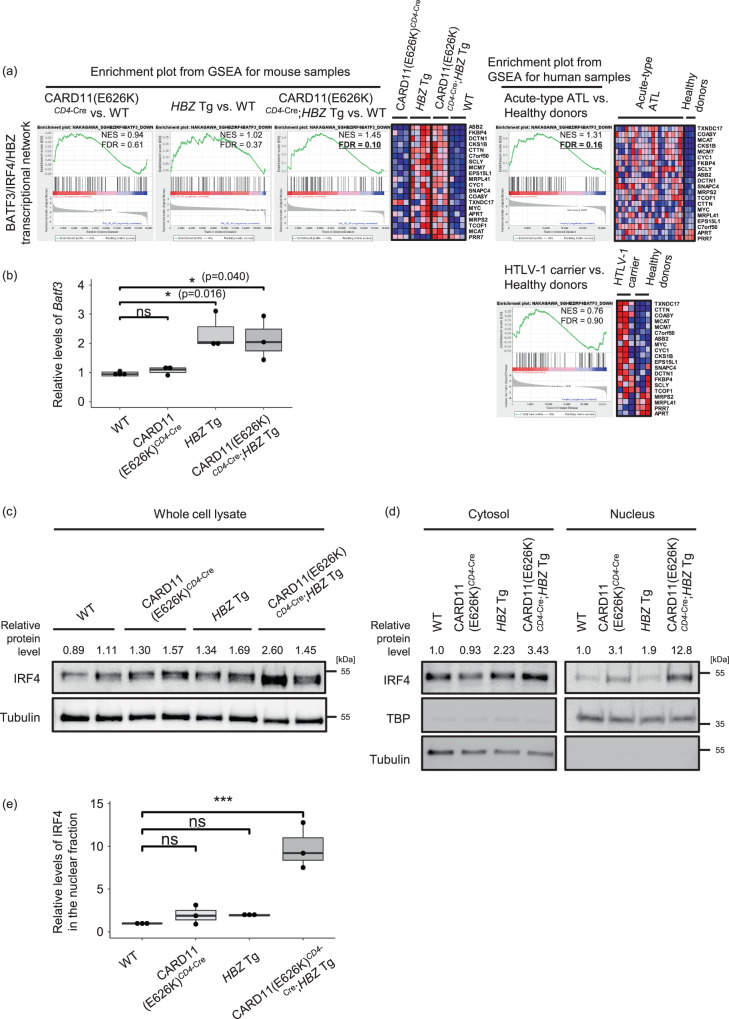
Adult T-cell leukemia/lymphoma (ATL) is caused by human T-cell leukemia virus type 1 (HTLV-1). In addition to HTLV-1 bZIP factor (HBZ), a leukemogenic antisense transcript of HTLV-1, abnormalities of genes involved in TCR-NF-κB signaling, such as CARD11, are detected in about 90% of patients. Utilizing mice expressing CD4+ T cell-specific CARD11(E626K) and/or CD4+ T cell-specific HBZ, namely CARD11(E626K)CD4-Cre mice, HBZ transgenic (Tg) mice, and CARD11(E626K)CD4-Cre;HBZ Tg double transgenic mice, we clarify these genes' pathogenetic effects. CARD11(E626K)CD4-Cre and HBZ Tg mice exhibit lymphocytic invasion to many organs, including the lungs, and double transgenic mice develop lymphoproliferative disease and increase CD4+ T cells in vivo. CARD11(E626K) and HBZ cooperatively activate the non-canonical NF-κB pathway, IRF4 targets, BATF3/IRF4/HBZ transcriptional network, MYC targets, and E2F targets. Most KEGG and HALLMARK gene sets enriched in acute-type ATL are also enriched in double transgenic mice, indicating that these genes cooperatively contribute to ATL development.


Conflict of interest statement

K. Shimoda has received consulting fees from Novartis Pharma, Takeda Pharmaceutical, Bristol-Myers, Shire Japan, and Celgene, all outside the submitted work, and has received research grants from Perseus Proteomics, Pharma Essentia Japan KK, AbbVie GK, Astellas Pharma, MSD, Chugai Pharmaceutical, Kyowa Kirin, Pfizer, Novartis Pharma, Otsuka Pharmaceutical, Asahi Kasei Medical, all outside the submitted work. K.K. holds stock in Asahi Genomics, has a patent for genetic alterations as a biomarker in T-cell lymphomas, and has received research funding from Chordia Therapeutics outside the submitted work. The remaining authors declare no competing interests.

Figures

Fig. 1
Fig. 1. Overall survival and cells in peripheral blood and spleen in WT, CARD11(E626K)CD4-Cre, HBZ Tg, and CARD11(E626K)CD4-Cre;HBZ Tg mice.
a Kaplan–Meier survival curves of mutant mice (wild type (WT), n = 38; CARD11(E626K)CD4-Cre, n = 37; HBZ Tg, n = 88; CARD11(E626K)CD4-Cre;HBZ Tg, n = 31). The median survival times of WT, CARD11(E626K)CD4-Cre, HBZ Tg, and CARD11(E626K)CD4-Cre;HBZ Tg mice, respectively, are as follows: not reached, 14, 8, and 6 months after birth. b The number of white blood cells and CD4+ T cells in peripheral blood in WT (n = 23), CARD11(E626K)CD4-Cre (n = 6), HBZ Tg (n = 10), and CARD11(E626K)CD4-Cre;HBZ Tg (n = 4) mice at 3 months after birth, and those in WT (n = 27), CARD11(E626K)CD4-Cre (n = 12), HBZ Tg (n = 13), and CARD11(E626K)CD4-Cre;HBZ Tg (n = 13) mice at 6 months after birth. c The differential white blood cell count was performed manually, and a peripheral blood slide revealed that about 5% of lymphocytes in CARD11(E626K)CD4-Cre;HBZ Tg mice demonstrated pleomorphic nuclear features (WT, n = 5; CARD11(E626K)CD4-Cre, n = 3; HBZ Tg, n = 3; CARD11(E626K)CD4-Cre;HBZ Tg, n = 3). The blood smear was stained with Wright-Giemsa. p values were calculated by the Tukey test after one-way ANOVA, and *, **, ***, and **** represent p values less than 0.05, 0.01, 0.001, and 0.0001, respectively.
Fig. 2
Fig. 2. Number of nucleated cells and pathological findings of spleens in WT, CARD11(E626K)CD4-Cre, HBZ Tg, and CARD11(E626K)CD4-Cre;HBZ Tg mice.
a Absolute numbers of nucleated cells in the spleen at 6 months after birth (wild type (WT), n = 21; CARD11(E626K)CD4-Cre, n = 15; HBZ Tg, n = 20; CARD11(E626K)CD4-Cre;HBZ Tg, n = 13) and 12 months after birth (WT, n = 11; CARD11(E626K)CD4-Cre, n = 5; HBZ Tg, n = 12). b Histologic analysis of the spleen at 6 and 12 months after birth (n = 5 for each mouse type). Spleens were stained with hematoxylin and eosin (HE) and anti-CD3 and anti-B220 antibodies. The interface between white and red pulp is shown at high magnification (HE 400×). CD3+ T cells in red pulp are shown at high magnification (CD3 400×).
Fig. 3
Fig. 3. Lymphadenopathy and disruption of lymph node architecture in mutant mice.
a The frequency of lymphadenopathy at 6 and 12 months after birth. Swollen lymph nodes (LNs) are not large, with a mean diameter of about 3 mm. Differences between frequencies of lymphadenopathy were assessed by Fisher’s exact test with Benjamini–Hochberg correction. b Histologic analysis of LNs at 6 and 12 months after birth (n = 5 for each mouse type). LNs were stained with hematoxylin and eosin (HE), and anti-CD3 and anti-B220 antibodies. The interface between the cortex and paracortex is shown with high magnification (CD3 400×).
Fig. 4
Fig. 4. Lymphocyte infiltration into the lung in mutant mice.
Histologic analysis of the lung at 6 and 12 months after birth (n = 5 for each mouse type). Lungs were stained with hematoxylin and eosin (HE), as well as anti-CD3 and anti-B220 antibodies. Lymphocyte infiltration into the lung perivascular interstitium and alveolar septa is observed in mutant mice at 6 and 12 months.
Fig. 5
Fig. 5. Increased numbers of CD4+ T cells and their subsets per body in mutant mice.
Absolute numbers of CD4+CD8- T cells, CD4-CD8+ T cells, CD4+CD44+CD62L effector/memory T cells (Tem), and CD4+CD25+ regulatory T cells (Treg) per mouse in wild type (WT) (n = 11), CARD11(E626K)CD4-Cre (n = 10), HBZ Tg (n = 12), and CARD11(E626K)CD4-Cre;HBZ Tg (n = 14) mice at 6 months after birth (a), and those in WT (n = 11), CARD11(E626K)CD4-Cre (n = 6), and HBZ Tg (n = 11) mice at 12 months after birth (b). p values were calculated by the Tukey test after one-way ANOVA, and *, **, and *** represent p values less than 0.05, 0.01, and 0.001, respectively.
Fig. 6
Fig. 6. Uniquely or commonly activated pathways in CARD11(E626K)CD4-Cre, HBZ Tg, and CARD11(E626K)CD4-Cre;HBZ Tg mice.
a Venn diagrams of the overlap between significantly up- and downregulated genes in CARD11(E626K)CD4-Cre (n = 3) vs. WT (n = 3) mice, HBZ-Tg (n = 4) vs. WT mice, and CARD11(E626K)CD4-Cre;HBZ Tg (n = 3) vs. WT mice. Splenic effector/memory T cells (Tem) from 4–6-month-old mice were sorted and underwent expressional analysis. Differentially expressed genes between sample groups were identified, using cut-offs of fold change (FC) > 1.2 and an FDR of <0.1. b Bar plots of significantly (FDR < 0.25) upregulated KEGG pathways. Some pathways are uniquely activated in CARD11(E626K)CD4-Cre mice, HBZ Tg mice, or CARD11(E626K)CD4-Cre;HBZ Tg mice. On the other hand, IL-2/STAT5 signaling and interferon-gamma response are commonly activated in all three types of mice.
Fig. 7
Fig. 7. Heatmap overview of gene sets showing significant enrichment by GSEA in one or more mutant Tem compared to WT Tem.
Comparisons of results are shown in the following order: CARD11(E626K)CD4-Cre vs. WT, HBZ Tg vs. WT, CARD11(E626K)CD4-Cre;HBZ Tg vs. WT, CARD11(E626K)CD4-Cre;HBZ Tg vs. HBZ Tg, and CARD11(E626K)CD4-Cre;HBZ Tg vs. CARD11(E626K)CD4-Cre.
Fig. 8
Fig. 8. Gene expression signatures in CARD11(E626K)CD4-Cre;HBZ Tg mice recapitulate many of those in human acute-type ATL samples.
a Normalized enrichment scores (NESs) in gene set enrichment analysis (GSEA) of the entire KEGG and HALLMARK gene sets show that mice and humans share many of the same enriched gene sets. Each gene set is indicated by a dot and is highlighted in a different color according to the respective false discovery rate (FDR) values for mice and humans, with a common cutoff value 0.25. Each plot legend indicates the frequency (number) of significant/non-significant gene sets, based on the common FDR cutoff values in both mice and humans. In the table at the bottom of each plot, the frequency (number) of pathways is indicated, based on the positive/negative values for both mouse NES (NES_m) and human NES (NES_h). b Notch signaling is enriched in the acute-type ATL samples, but not in CARD11(E626K)CD4-Cre;HBZ Tg mice. Enrichment plots of the KEGG Notch signaling gene set in mice and humans are shown with their NESs and FDRs.
Fig. 9
Fig. 9. Formation of the BATF3/IRF4/HBZ transcriptional network in CARD11(E626K)CD4-Cre;HBZ Tg mice.
a CARD11(E626K)CD4-Cre;HBZ Tg mice recapitulated a transcriptional network change that is characteristic of ATL. The BATF3/IRF4/HBZ transcriptional network is enriched in both CARD11(E626K)CD4-Cre;HBZ Tg mice and human acute-type ATL samples. Enrichment plots of each gene set in mice and humans are shown with their NESs and FDRs. b Quantitative PCR for Batf3 (WT, n = 4; CARD11(E626K)CD4-Cre, n = 3; HBZ Tg, n = 3; CARD11(E626K)CD4-Cre;HBZ Tg, n = 3). The expression level of Batf3 in each type of mutant mouse was normalized to the expression level of Gapdh, and is shown as the relative ratio to that in WT mice. Batf3 is transcriptionally upregulated in splenic CD4+ T cells from both HBZ Tg and CARD11(E626K)CD4-Cre;HBZ Tg mice. c Western blotting for IRF4 in CD4+ T cells. The protein level of IRF4 in each mouse type is normalized to the protein level of tubulin, and is shown as the relative ratio to that in WT mice. d Western blotting of cytoplasmic and nuclear fractions of IRF4 in CD4+ T cells from each mouse type. Expression levels of IRF4 were normalized to those of tubulin in cytosolic fractions, and to those of TATA-binding protein (TBP) in nuclear fractions. The expression level in each type of mutant mouse is shown as the relative ratio to that in WT mice. e Summary of the relative levels of IRF4 in the nuclear fraction. A bar graph depicts the results from 3 replicate of Western blotting. p values were calculated by the Tukey test after one-way ANOVA, and *** represent p values less than 0.001, respectively.

References

    1. Uchiyama T, Yodoi J, Sagawa K, Takatsuki K, Uchino H. Adult T-cell leukemia: clinical and hematologic features of 16 cases. Blood. 1977;50:481–492. doi: 10.1182/blood.V50.3.481.481. - DOI - PubMed
    1. Vose J, Armitage J, Weisenburger D, International, T. C. L. P. International peripheral T-cell and natural killer/T-cell lymphoma study: pathology findings and clinical outcomes. J. Clin. Oncol. 2008;26:4124–4130. doi: 10.1200/JCO.2008.16.4558. - DOI - PubMed
    1. WHO Classification of Tumors of Haematopoietic and Lymphoid Tissues. Adult T-cell leukaemia/lymphoma (ed. Swerdlow, S. H. et al.). 281–284 (IARC press Lyon, 2008).
    1. Watanabe T. Adult T-cell leukemia: molecular basis for clonal expansion and transformation of HTLV-1-infected T cells. Blood. 2017;129:1071–1081. doi: 10.1182/blood-2016-09-692574. - DOI - PMC - PubMed
    1. Ishitsuka K, Tamura K. Human T-cell leukaemia virus type I and adult T-cell leukaemia-lymphoma. Lancet Oncol. 2014;15:e517–e526. doi: 10.1016/S1470-2045(14)70202-5. - DOI - PubMed

Publication types

Substances