. 2022 Nov 29;12(1):20544.
doi: 10.1038/s41598-022-25138-w.

The human ion channel TRPM2 modulates migration and invasion in neuroblastoma through regulation of integrin expression

Affiliations

The human ion channel TRPM2 modulates migration and invasion in neuroblastoma through regulation of integrin expression

Lei Bao et al. Sci Rep. .

Abstract

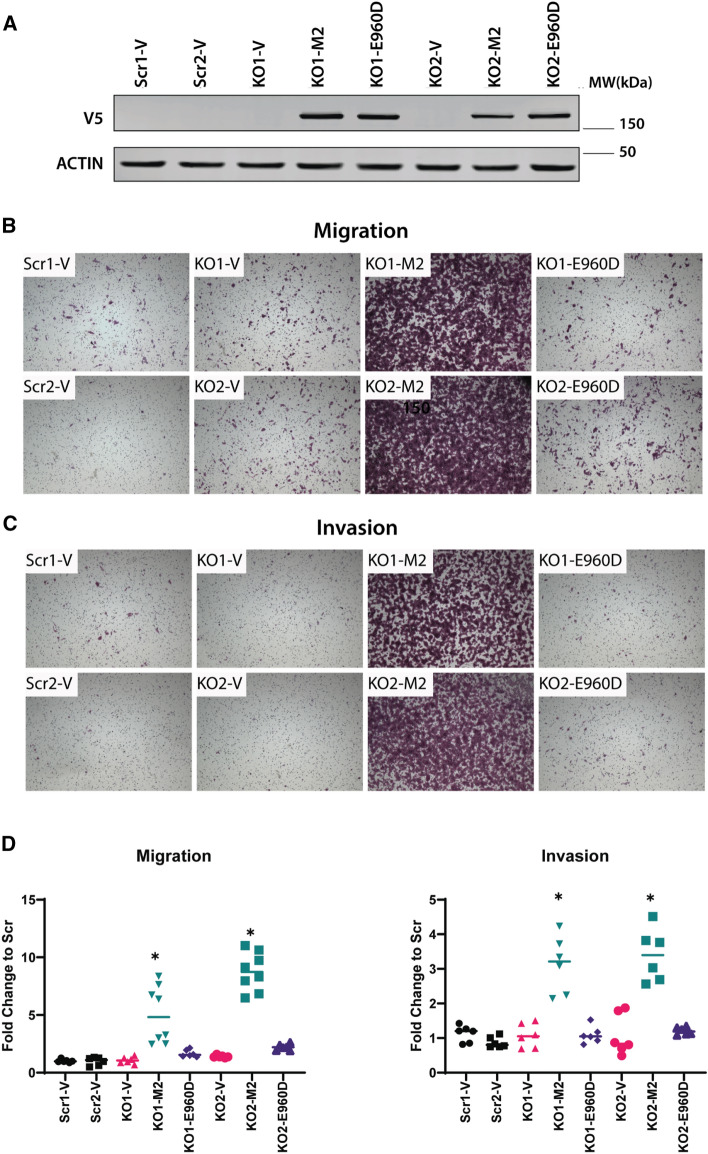
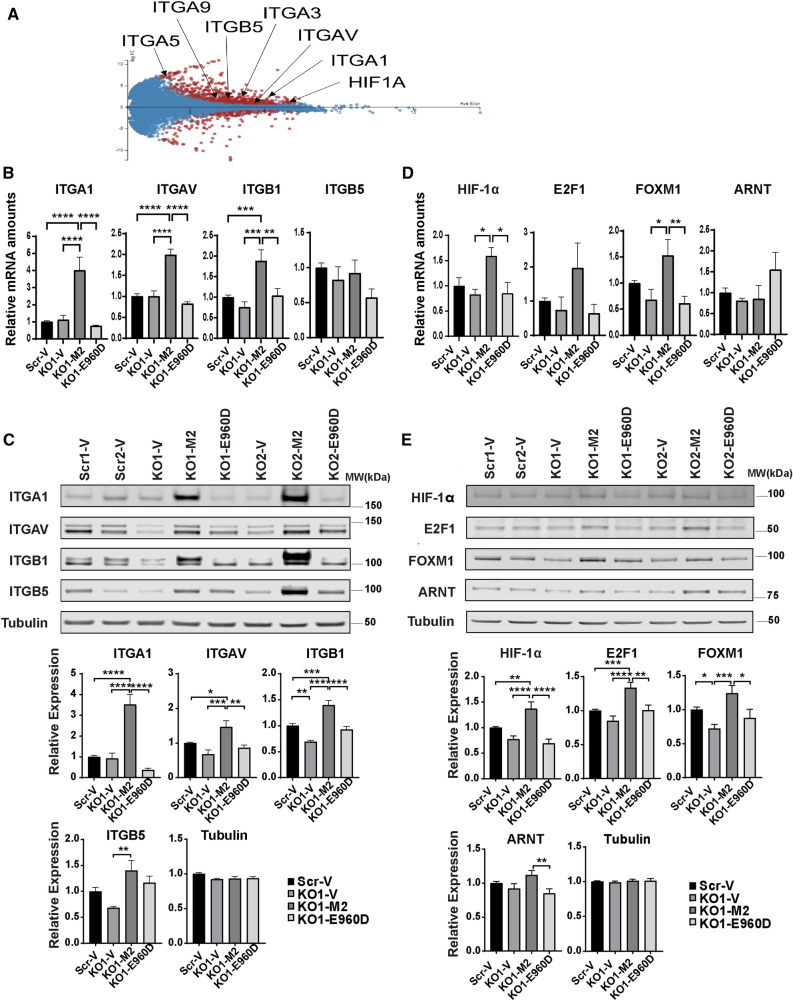
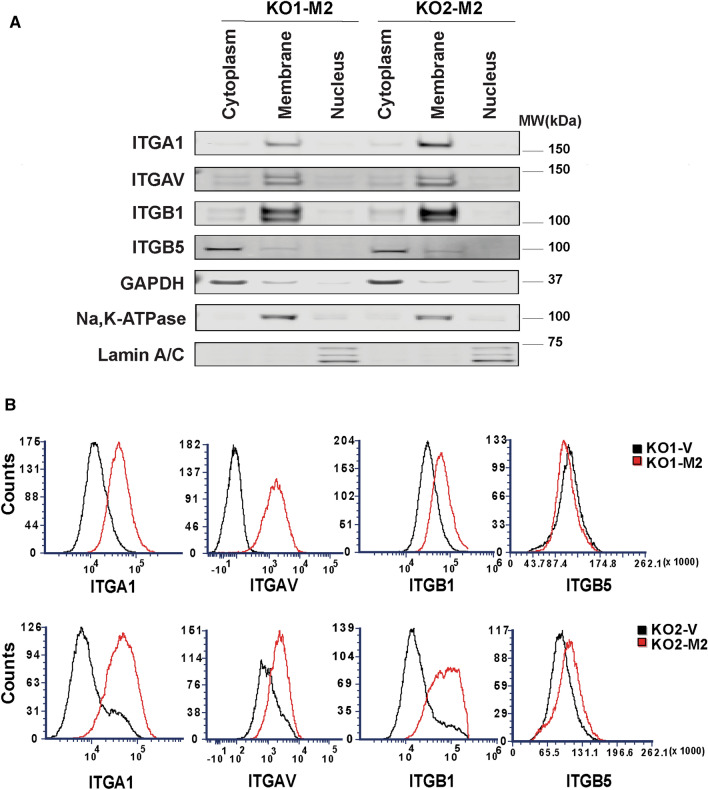
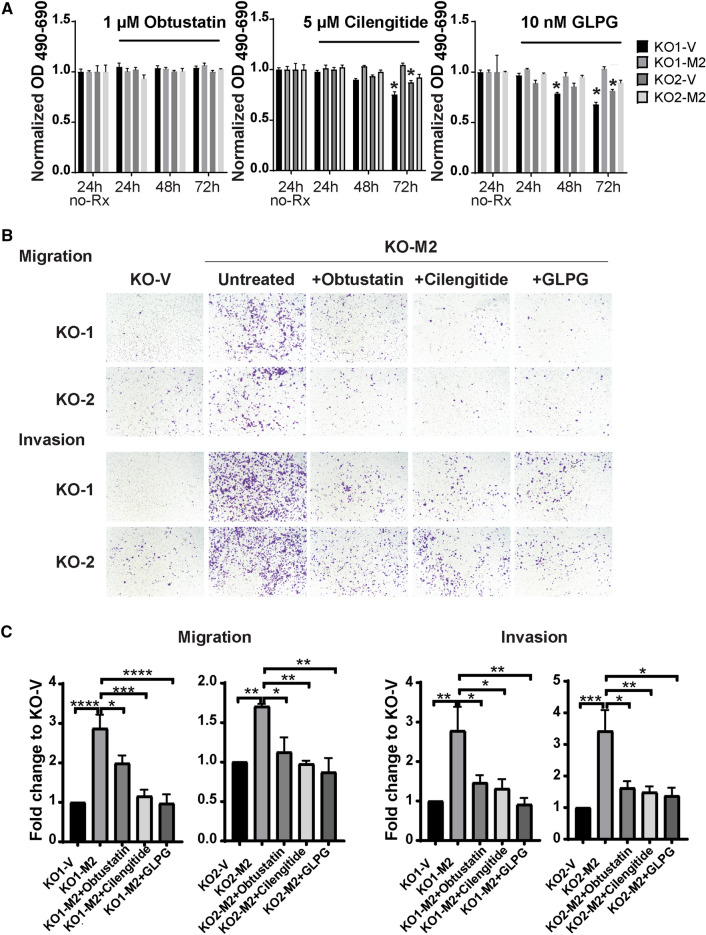
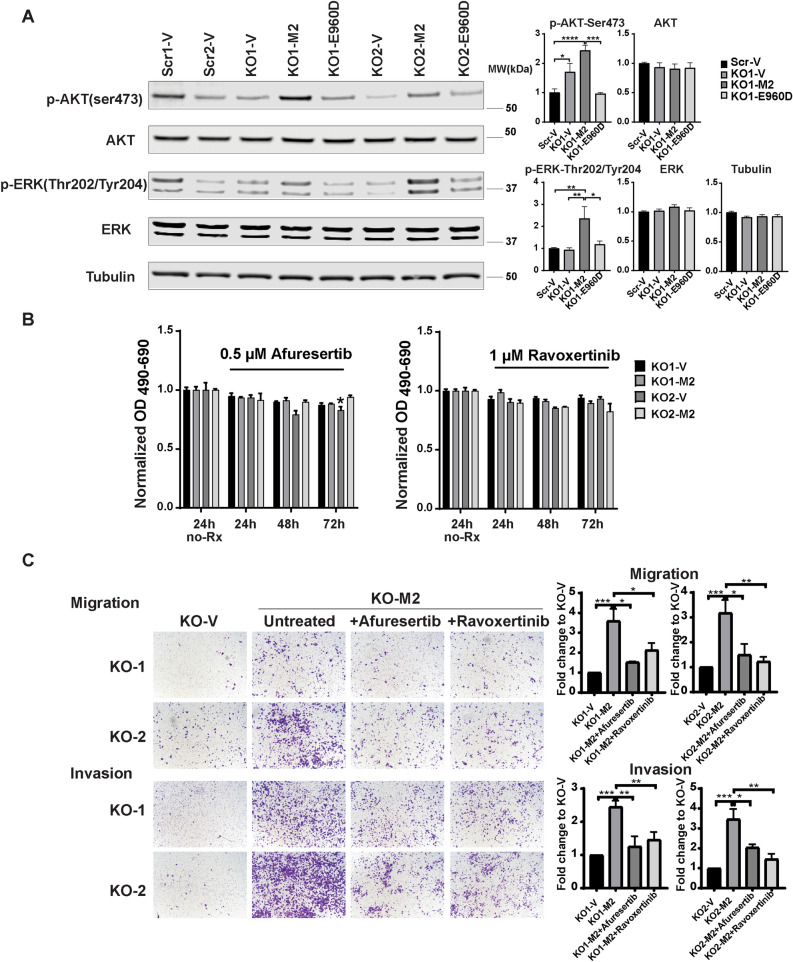
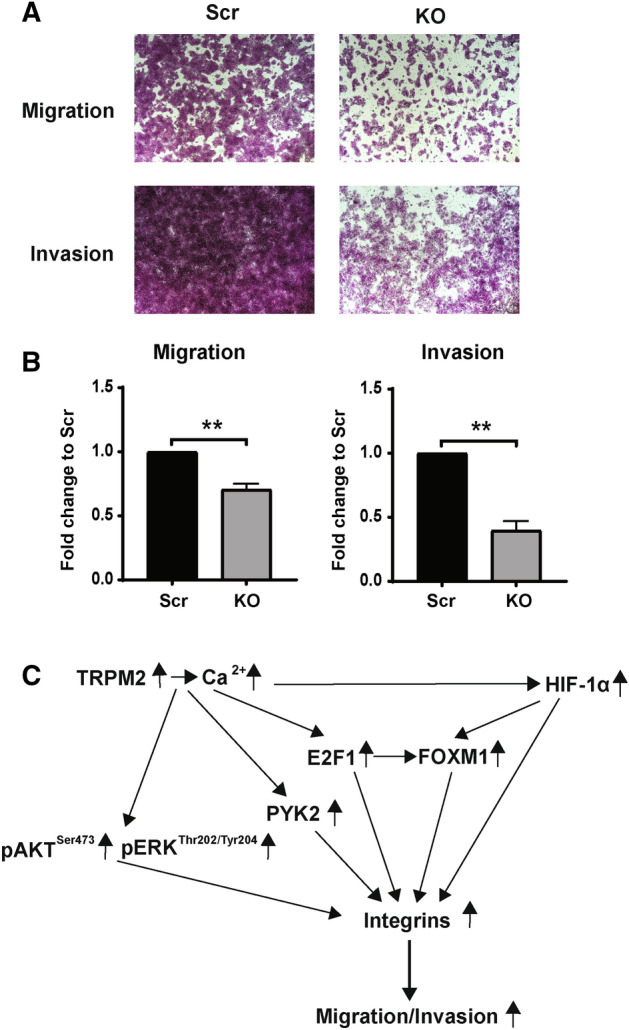
Transient receptor potential channel TRPM2 is highly expressed in many cancers and involved in regulation of key physiological processes including mitochondrial function, bioenergetics, and oxidative stress. In Stage 4 non-MYCN amplified neuroblastoma patients, high TRPM2 expression is associated with worse outcome. Here, neuroblastoma cells with high TRPM2 expression demonstrated increased migration and invasion capability. RNA sequencing, RT-qPCR, and Western blotting demonstrated that the mechanism involved significantly greater expression of integrins α1, αv, β1, and β5 in cells with high TRPM2 expression. Transcription factors HIF-1α, E2F1, and FOXM1, which bind promoter/enhancer regions of these integrins, were increased in cells with high TRPM2 expression. Subcellular fractionation confirmed high levels of α1, αv, and β1 membrane localization and co-immunoprecipitation confirmed the presence of α1β1, αvβ1, and αvβ5 complexes. Inhibitors of α1β1, αvβ1, and αvβ5 complexes significantly reduced migration and invasion in cells highly expressing TRPM2, confirming their functional role. Increased pAktSer473 and pERKThr202/Tyr204, which promote migration through mechanisms including integrin activation, were found in cells highly expressing TRPM2. TRPM2 promotes migration and invasion in neuroblastoma cells with high TRPM2 expression through modulation of integrins together with enhancing cell survival, negatively affecting patient outcome and providing rationale for TRPM2 inhibition in anti-neoplastic therapy.


Conflict of interest statement

The authors declare no competing interests.

Figures

Figure 1
Figure 1
TRPM2 is highly expressed in many cancers. (A) TRPM2 expression is increased in many malignancies compared to normal tissue. The GEPIA2 tool was used to analyze and compare TCGA tumor datasets to TCGA and GTEx normal datasets (See "Materials and Methods"). The number of samples for each tumor type are shown in Supplementary Table 1. The median 25–75 percentiles are boxed and the 10–90 percentiles for each group shown with lines. The median is shown with a bar. Significant differences were assessed with one-way ANOVA. *p < 0.01. (B) Expression of TRPM2 was analyzed in neuroblastoma samples from all stages of disease and in Stage 4 using three databases in the R2 platform (Cangelosi, Westermann, Kocak databases; Supplementary Table 2). Expression levels of TRPM2 were compared between samples with and without MYCN amplification across all stages of disease (left panel) or in Stage 4 (right panel). Data was analyzed by unpaired t-test (**p < 0.01, ***p < 0.001, ****p < 0.0001). (C) Kaplan Meier survival plot for Stage 4 neuroblastoma patients without MYCN amplification divided based on level of TRPM2 expression in tumors. Samples in the last quartile for TRPM2 expression were designated High TRPM2 (blue), while remaining samples were grouped into Low TRPM2 (red). Two independent datasets with survival data were used: Cangelosi database (n = 198, p < 0.023); Seeger database (n = 102, p < 0.00029); analyzed with one-way ANOVA.
Figure 2
Figure 2
High TRPM2 expression increases invasion and migration in neuroblastoma. (A) Western blotting was performed on two clones of SH-SY5Y scrambled control cells (Scr1-V, Scr2-V), TRPM2 KO (KO1-V, KO2-V), and TRPM2 KO cells reconstituted with either TRPM2 (KO1-M2, KO2-M2) or the E960D calcium-impermeant TRPM2 mutant (KO1-E960D, KO2-E960D). Probing with anti-V5 antibody demonstrated successful TRPM2 transfection. Full length gels for Western blots are shown in Supplementary Fig. S1. Migration (B) and invasion (C) assays were performed as described in Methods, and representative pictures from Boyden chambers are shown. (D) Analysis of migration and invasion density of two clones each of scrambled, KO, and KO cells reconstituted with TRPM2 or E960D was performed. Symbols indicate individual wells and are shown for Scr-V (black), KO-V (red), KO-M2 (green), and KO-E960D (blue) cells. Medians are indicated for 3 independent experiments with a line. Each of the three experiments had 2 wells/clone/group (total replicates = 6) except for the KO-M2 clones in one migration experiment, which had 4 wells/group (replicates = 8). Statistical difference of each group compared to scrambled controls were analyzed by one-way ANOVA. *p < 0.0.0001.
Figure 3
Figure 3
α1, αv, β1, and β5 Integrin expression are increased in TRPM2 reconstituted cells. (A) RNA seq analysis of integrin expression in SH-SY5Y cells with TRPM2 deletion (KO-V) compared to the same cells reconstituted with TRPM2 (KO-M2). MA plot (log ratio vs abundance) of RNA seq data is shown. Two biological replicas of each condition were utilized. ITGA1 (α1), ITGA3 (α3), ITGA5 (α5), ITGA9 (α9), ITGAV (αv), and ITGB5 (β5) integrins were significantly increased in KO-M2 cells, as was HIF1A (HIF-1α). These genes with q-value < 0.05 are displayed in red. Positive Log FC indicates genes overexpressed in M2 cells. Degust 4.1.1 software was used for RNA seq analysis and image generation. (B), (D) RT-qPCR of (B) integrins ITGA1, ITGAV, ITGB1, ITGB5, and (D) transcription factors HIF-1α, E2F1, FOXM1, and ARNT mRNA from Scr-V, KO1-V, KO1-M2 or KO1-E960D SH-SY5Y cells. RT-qPCR was performed on cells grown without serum for 24 h. Each experimental group was normalized to Scr. Means + S.E.M. of three (ARNT), four (ITGA1, ITGAV, ITGB1, HIF1A), five (E2F1, FOXM1), or seven (ITGB5) experiments performed with KO clone are shown (KO1 in Fig. 3 B, D and a second clone KO2 in Supplementary Fig. S3B,D). Statistics: one-way ANOVA, *p < 0.05, **p < 0.01, ***p < 0.001, ****p < 0.0001. (C), (E) Western blotting was performed on two clones of TRPM2 KO (KO1-V, KO2-V), KO reconstituted with TRPM2 (KO1-M2, KO2-M2) or E960D (KO1-E960D, KO2-E960D), and scrambled SH-SY5Y control cells (Scr1-V, Scr2-V) grown without serum. Blots were probed with antibodies to (C) α1 (ITGA1), αv (ITGAV), β1 (ITGB1), β5 (ITGB5) integrins, or (E) transcription factors HIF-1α, E2F1, FOXM1, and ARNT. Tubulin was probed as a control for loading. Densitometry measurements were from five experiments from each clone for each integrin, eight experiments for transcription factors HIF-1α, E2F1, and FOXM1 for KO1 and five experiments for KO2 clone, and eight experiments for ARNT. Results were standardized to each experiment’s scrambled control, and means + S.E.M. for each group are shown. Statistics: one-way ANOVA, *p < 0.05, **p < 0.01, ***p < 0.001, ****p < 0.0001. Results for KO1 are shown in Fig. 3C,E and for KO2 in Supplementary Fig. S3C,E. Full length gels for Western blots are also shown in Supplementary Fig. S3C,E.
Figure 4
Figure 4
Subcellular Fractionation of α1, αv, β1, and β5 integrins in neuroblastoma cells highly expressing TRPM2. (A) Subcellular separation of two clones of SH-SY5Y KO cells reconstituted with TRPM2 (KO1-M2, KO2-M2) into cytoplasmic, membrane, and nuclear fractions was performed as described in "Materials and Methods". Western blotting was performed with fractionated samples loading equivalent amounts per lane (10 ug/lane). Blots were probed with antibodies to α1 (ITGA1), αv (ITGAV), β1 (ITGB1), β5 (ITGB5) integrins. Blots were also probed with antibodies to GAPDH (cytoplasmic marker), Na,K-ATPase α (plasma membrane marker which regulates Na and K ions and cell volume) and Lamin A/C (nuclear marker) as controls. Four experiments were performed with similar results and the results of one are shown. α1, αv, and β1 were predominantly found in the membrane fraction, and β5 in the cytoplasmic. Full length gels for these Western blots are shown in Supplementary Fig. S4. Membrane fractionations of Scr1-V, Scr2-V, KO1-V, KO2-V, KO1-M2, KO2-M2, KO1-E960D, KO2-E960D cells are also shown on Supplementary Fig. S4. (B) Flow Cytometry of α1, αv, β1, and β5 integrin expression on the surface of non-permabilized SH-SY5Y KO cells (KO1-V, KO2-V) and KO cells expressing TRPM2 (KO1-M2, KO2-M2). Fluorescent intensities (X-axis) of integrins α1, αv, and β1 were increased on the surface of KO-M2 compared to KO-V cells. This experiment was performed twice with similar results and results of one experiment are shown.
Figure 5
Figure 5
Immunoprecipitation of integrin complexes in TRPM2 expressing cells. Integrins α1 (ITGA1), αv (ITGAV), β1 (ITGB1), β5 (ITGB5) were immunoprecipitated (IP) from SH-SY5Y cells with TRPM2 deletion reconstituted with TRPM2, grown without serum for 24 h, with each integrin antibody, or nonspecific IgG. Western blotting of immunoprecipitates was performed on nonbinding supernatants and eluates of bound proteins with the same antibodies. Anti-V5 antibody was used to immunoprecipitate V5-labeled TRPM2, and anti-TRPM2 C-terminal antibody was used for Western blotting. A sample of cell lysate (20 µg/15 µl) was loaded in the first lane to demonstrate starting proteins, and 30 µg/15 µl was loaded in non-binding supernatant lanes. Two experiments were performed with each antibody. Integrin α1 co-precipitated reciprocally with β1, and αv coprecipitated reciprocally with β5 and β1. Representative results are shown. None of the integrins co-precipitated with TRPM2. Full length gels for Western blots are shown in Supplementary Fig. S5.
Figure 6
Figure 6
Integrin antagonists block increased migration and invasion found in neuroblastoma cells with high TRPM2 expression. Two clones of SH-SY5Y knockout cells (KO1-V, KO2-V) and TRPM2 KO cells reconstituted to express TRPM2 (KO1-M2, KO2-M2) were untreated or treated with integrin complex antagonists obtustatin (α1β1 inhibitor), cilengitide (αvβ5 inhibitor), or GLPG-0187 (αvβ1 and αvβ5 inhibitor). (A) Cell viability was examined with XTT analysis following treatment of cells with obtustatin (1 µM), cilengitide (5 µM) or GLPG-0187 (10 nM) for 24, 48, or 72 h, the concentrations used in invasion and migration studies. Results were normalized to untreated cells at each time point for each clone (n = 4 replicates). Only the 24 h untreated (no-Rx) normalization is shown here. Three similar experiments were performed and means + S.E.M. of one are shown. Results were analyzed with two-way ANOVA. Viability of treated KO-M2 cells was not significantly reduced compared to untreated cells. *p < 0.05 indicates a reduction seen in KO-V cells, consistent with their increased sensitivity to reduced viability. In Supplementary Fig. S6A, viability after treatment of KO1,2-V and KO1,2-M2 cells with additional doses of obtustatin (0.5, 1 µM), cilengitide (1 µM, 5 µM) or GLPG-0187 (5, 10 nM) at 24, 48, or 72 h are shown. In Supplementary Fig. S6B, viability after treatment of Scr1,2-V, KO1,2-V, KO1.2-M2 and KO1,2-E960D cells with obtustatin (1 µM), cilengitide (1 µM, 5 µM) or GLPG-0187 (10, 20 nM) at 24 or 48 h are shown. (B), (C) Migration and invasion assays were performed as described in "Materials and Methods" and representative pictures from Boyden chambers are shown (B). Analysis of migration of two clones of KO and KO-M2 cells in three experiments and invasion density in five experiments was performed and results shown in (C). Two clones each of untreated KO-V (KO1-V or KO2-V), untreated KO-M2 (KO1-M2 or KO2-M2), or KO-M2 cells treated with obtustatin (1 µM), cilengitide (5 µM), or GLPG-0187 (10 nM) were studied for 48 (migration) or 72 h (invasion). Mean + S.E.M. density is shown for three migration and five invasion experiments. Results for each well in each experiment were standardized to each clone’s KO-V, and the mean number for each clone in each experiment (3 to 4 replicates) was used to calculate the mean + S.E.M. from all experiments. Statistical differences of each group compared to its KO-V were analyzed by one-way ANOVA, *p < 0.05, **p < 0.01, ***p < 0.001, ****p < 0.0001.
Figure 7
Figure 7
Akt and ERK activation promote migration and invasion in cells highly expressing TRPM2. (A) Western blots of lysates from SH-SY5Y KO cells (KO1-V, KO2-V), KO cells stably expressing TRPM2 (KO1-M2, KO2-M2), E960D (KO1-E960D, KO2-E960D), or scrambled control cells (Scr1-V, Scr2-V) were probed with antibodies to pAktSer473, Akt, pERKThr202/Tyr204, ERK, and tubulin in four experiments. One blot is shown for each antibody. Densitometry measurements were standardized to scrambled control for each blot. Means + S.E.M. for each group are shown for four experiments (KO1 clone shown in Fig. 7A, KO2 clone shown in Supplementary Fig. S7A). Statistics: one-way ANOVA, *p < 0.05, **p < 0.01, ***p < 0.001. Full length gels for Western blots shown in Supplementary Fig. 7A. (B) Cell viability was examined with XTT analysis following treatment of cells with the Akt inhibitor afuresertib (0.5 uM) or the ERK inhibitor ravoxertinib (1 uM) for 24, 48, or 72 h. Three experiments were performed with each inhibitor and results of one are shown in Fig. 7B and another in Supplementary Fig. S6C. Results were normalized to untreated cells (no-Rx) at each time point for each clone (n = 4 replicates). Only the 24 h untreated (no-Rx) normalization is presented in Fig. 7B. Means + S.E.M. are shown and results analyzed with two-way ANOVA. KO-M2 cell viability was not significantly reduced compared to untreated cells. *p < 0.05 indicates a reduction in KO-V cells. Treatment with additional doses of Akt inhibitor afuresertib (0.1, 0.5 uM) or the ERK inhibitor ravoxertinib (0.5, 1 uM) for 24, 48, or 72 h are shown in Supplementary Fig. S6C. (C) Migration and Invasion assays of two clones each of SH-SY5Y KO cells or KO cells stably expressing TRPM2, untreated or treated with the Akt inhibitor afuresertib (0.5 uM) or the ERK inhibitor ravoxertinib (1 uM). Migration and invasion assays were performed as described in "Materials and Methods" and representative pictures from Boyden chambers are shown. Analysis of migration and invasion density was performed. Three experiments were performed with 0.5 µM afuresertib for inhibition of migration and invasion. For I µM ravoxertomib, five experiments were performed for migration, and four experiments were performed for invasion. Results of individual wells were standardized to average KO-V in each group in each experiment. Mean + S.E.M. for each experiment was determined for untreated KO1,2-V, untreated KO1,2-M2, and KO1,2-M2 cells treated with afuresertib or ravoxertinib. The mean from each experiment was used to calculate the mean + S.E.M. shown. Statistical differences among groups were analyzed by one-way ANOVA. *p < 0.05, **p < 0.01, ***p < 0.001, ****p < 0.0001.
Figure 8
Figure 8
Migration and Invasion in neuroblastoma cells. (A), (B) Migration and invasion assays were performed with SK-N-AS KO cells (KO) and scrambled control cells (Scr-V) as described in Methods. Representative pictures from Boyden chambers of one migration and invasion experiment are shown in (A). Pictures from two additional migration and invasion experiments with SK-N-AS cells are shown in Supplementary Fig. 8C. (B) Densitometry analysis of migration and invasion density of scrambled and TRPM2 KO SK-N-AS cells. Three migration experiments and three invasion experiments were performed. The mean from each experiment was quantitated comparing KO to scrambled cells, and used to calculate mean + S.E.M. of all three. Statistical difference of SK-N-AS KO compared to scrambled control was analyzed by two-tailed T-test, **p < 0.003. (C) Schema of TRPM2 modulation of migration/invasion in neuroblastoma. Higher levels of TRPM2 enhance migration and invasion. In SH-SY5Y cells, increased migration and invasion were associated with increased expression of HIF-1α, E2F1, and FOXM1 transcription factors and downstream integrin targets, and activation of Akt and ERK.

References

    1. Prawitt D, et al. Identification and characterization of MTR1, a novel gene with homology to melastatin (MLSN1) and the trp gene family located in the BWS-WT2 critical region on chromosome 11p15.5 and showing allele-specific expression. Hum. Mol. Genet. 2000;9:203–216. doi: 10.1093/hmg/9.2.203. - DOI - PubMed
    1. Miller BA. TRPM2 in cancer. Cell Calcium. 2019;80:8–17. doi: 10.1016/j.ceca.2019.03.002. - DOI - PMC - PubMed
    1. Kim BJ, et al. Suppression of transient receptor potential melastatin 7 channel induces cell death in gastric cancer. Cancer Sci. 2008;99:2502–2509. doi: 10.1111/j.1349-7006.2008.00982.x. - DOI - PMC - PubMed
    1. Huang Y, et al. Transient receptor potential melastatin 8 (TRPM8) channel regulates proliferation and migration of breast cancer cells by activating the AMPK-ULK1 pathway to enhance basal autophagy. Front. Oncol. 2020;10:573127. doi: 10.3389/fonc.2020.573127. - DOI - PMC - PubMed
    1. Perraud AL, et al. Accumulation of free ADP-ribose from mitochondria mediates oxidative stress-induced gating of TRPM2 cation channels. J. Biol. Chem. 2005;280:6138–6148. doi: 10.1074/jbc.M411446200. - DOI - PubMed

Publication types