. 2023 Jan;20(1):51-64.
doi: 10.1038/s41423-022-00956-0. Epub 2022 Nov 30.

Arsenic trioxide elicits prophylactic and therapeutic immune responses against solid tumors by inducing necroptosis and ferroptosis

Affiliations

Arsenic trioxide elicits prophylactic and therapeutic immune responses against solid tumors by inducing necroptosis and ferroptosis

Jinfeng Chen et al. Cell Mol Immunol. 2023 Jan.

Abstract

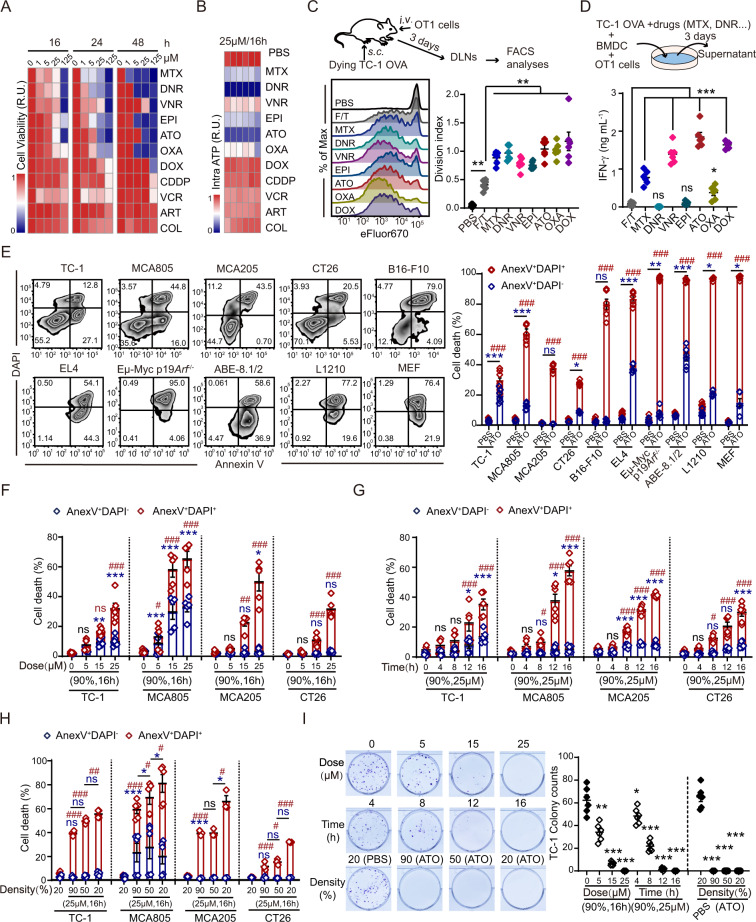
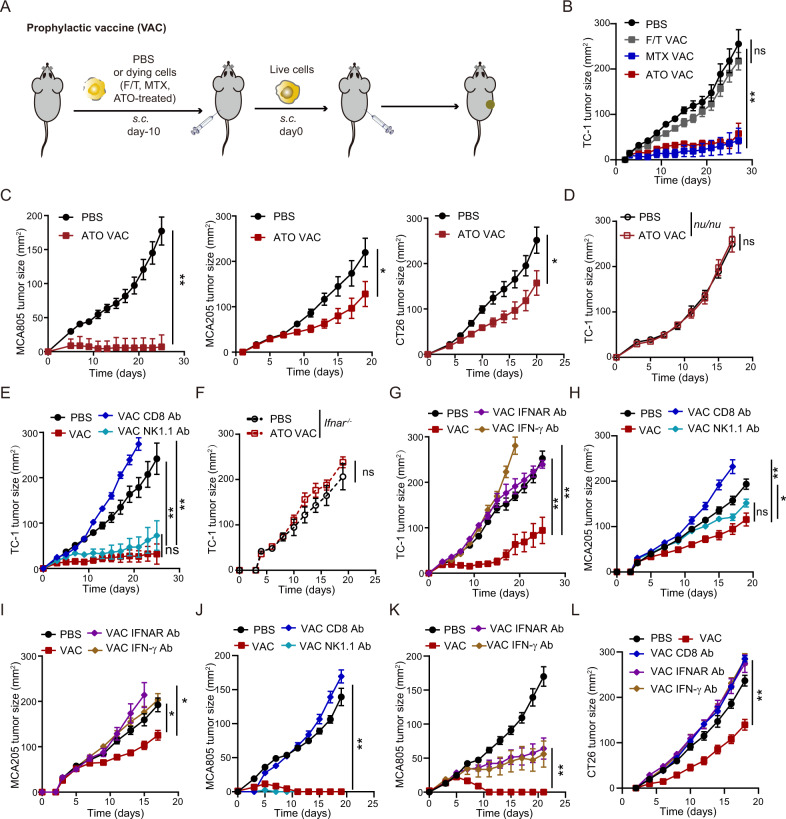
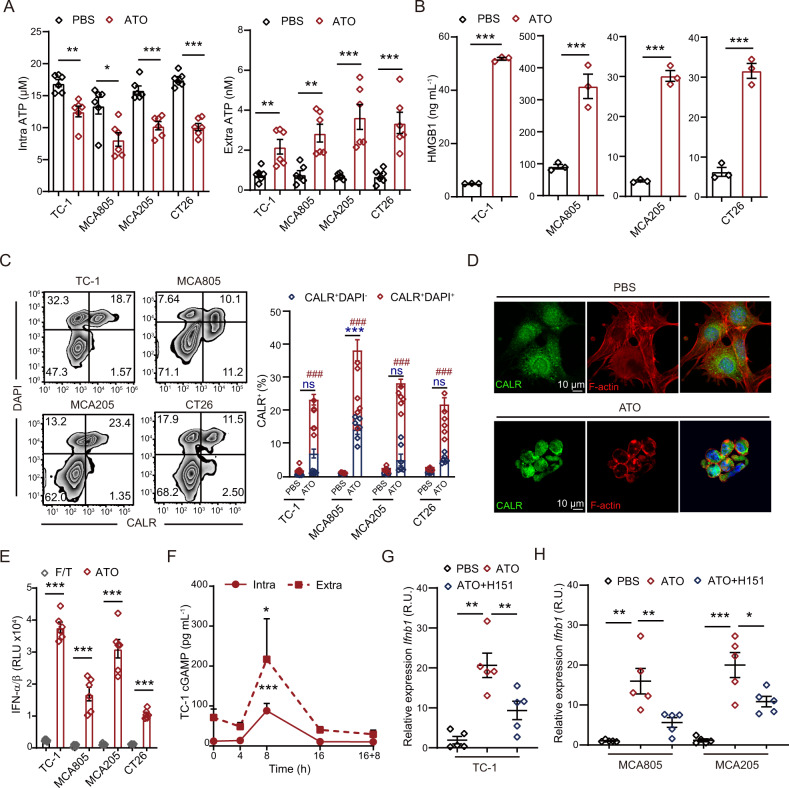
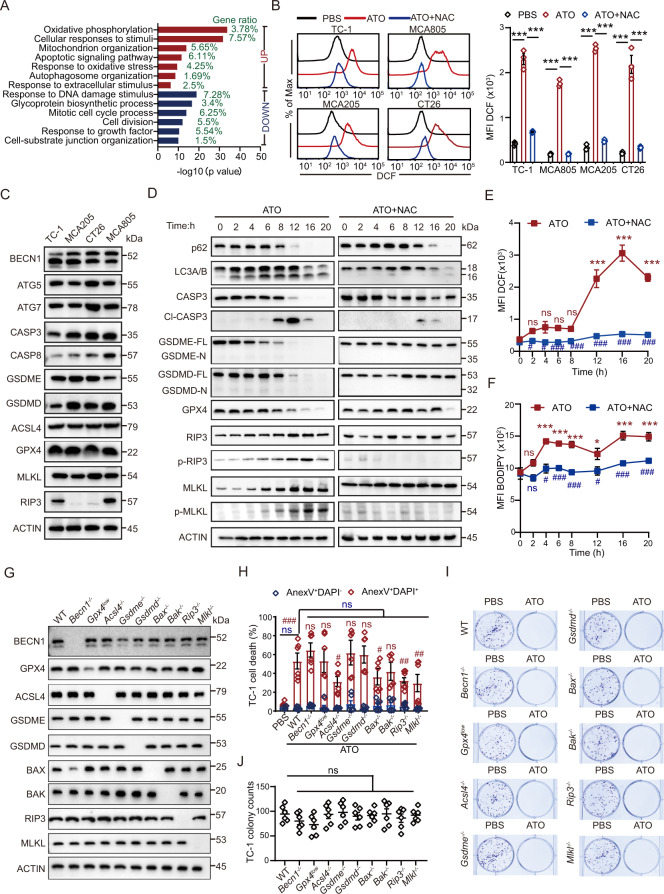
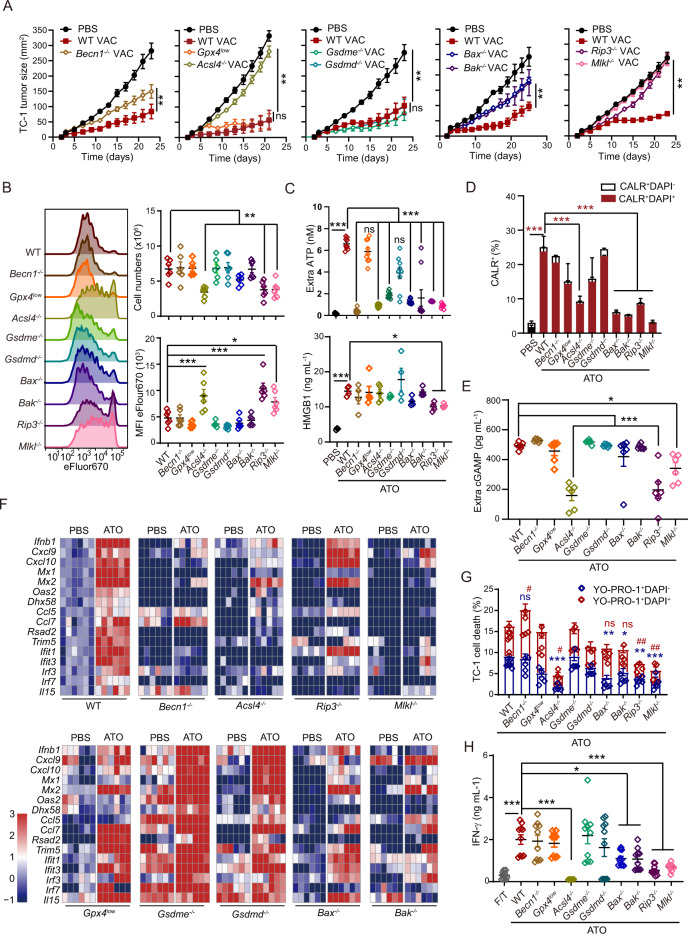
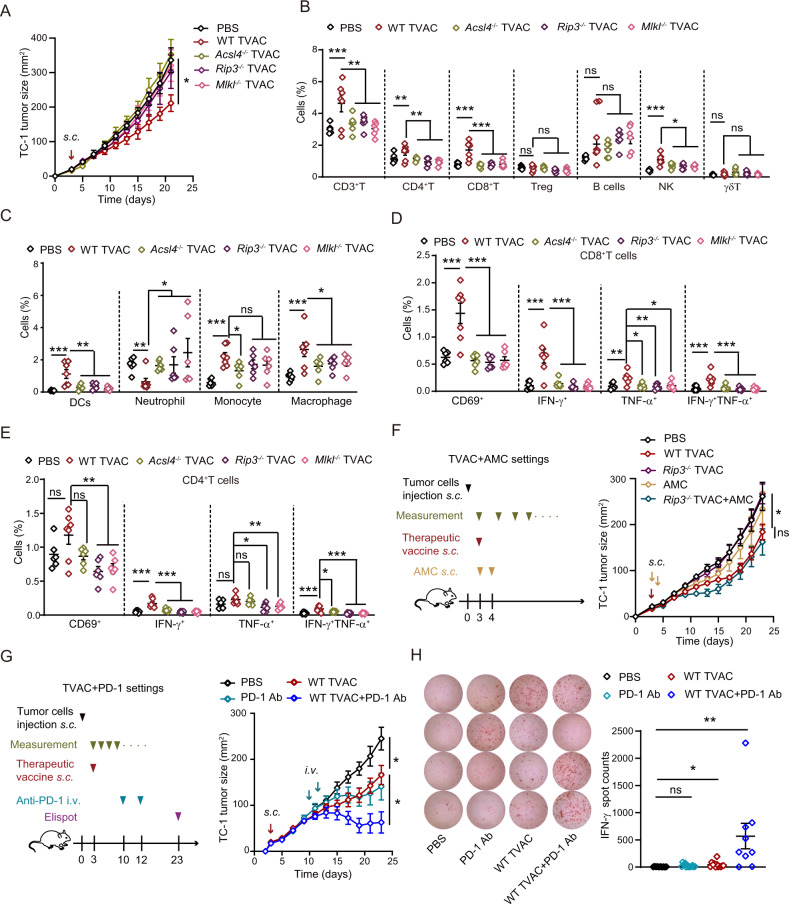
Boosting tumor immunosurveillance with vaccines has been proven to be a feasible and cost-effective strategy to fight cancer. Although major breakthroughs have been achieved in preventative tumor vaccines targeting oncogenic viruses, limited advances have been made in curative vaccines for virus-irrelevant malignancies. Accumulating evidence suggests that preconditioning tumor cells with certain cytotoxic drugs can generate whole-cell tumor vaccines with strong prophylactic activities. However, the immunogenicity of these vaccines is not sufficient to restrain the outgrowth of existing tumors. In this study, we identified arsenic trioxide (ATO) as a wide-spectrum cytotoxic and highly immunogenic drug through multiparameter screening. ATO preconditioning could generate whole-cell tumor vaccines with potent antineoplastic effects in both prophylactic and therapeutic settings. The tumor-preventive or tumor-suppressive benefits of these vaccines relied on CD8+ T cells and type I and II interferon signaling and could be linked to the release of immunostimulatory danger molecules. Unexpectedly, following ATO-induced oxidative stress, multiple cell death pathways were activated, including autophagy, apoptosis, necroptosis, and ferroptosis. CRISPR‒Cas9-mediated knockout of cell death executors revealed that the absence of Rip3, Mlkl, or Acsl4 largely abolished the efficacy of ATO-based prophylactic and therapeutic cancer vaccines. This therapeutic failure could be rescued by coadministration of danger molecule analogs. In addition, PD-1 blockade synergistically improved the therapeutic efficacy of ATO-based cancer vaccines by augmenting local IFN-γ production.

Keywords: Arsenic trioxide; Ferroptosis; Immunosurveillance; Necroptosis; Tumor vaccine.


Conflict of interest statement

The authors declare no competing interests.

Figures

Fig. 1
Fig. 1
Multiparameter screening of drugs with high cytotoxicity and immunostimulatory properties. A Comparison of drug cytotoxicity to TC-1 cells at the indicated doses and time points measured with CCK-8 assays. R.U. (Relative unit) was calculated from the average O.D. values in each condition as the indicator of cell viability (n = 3). B The intracellular ATP content was quantified by a CellTiter-Glo® luminescent kit after 16 h of treatment with 25 μΜ of each drug (n = 6). C TC-1 OVA cells were treated with the indicated drugs (25 μΜ, 16 h) or freeze‒thaw cycles (F/T) and injected s.c. into the footpad of mice to stimulate eFlour670-prelabeled OT-1 cells. Typical histograms of OT-1 cell proliferation and statistical analyses of the OT-1 cell division index are shown (n = 6). D Dying TC-1 cells were cocultured with BMDCs and OT-1 cells. IFN-γ levels in the supernatant were detected by ELISA 3 days later (n = 6). E The cytotoxicity of ATO (25 μΜ, 16 h) to different cell lines was quantified by Annexin V/DAPI staining. Typical cytofluorometric dot plots and statistical analyses are shown (n = 6). FI The dose-, time-, and cell density-dependent cytotoxicity of ATO was measured by flow cytometry and colony formation assays with the indicated tumor cell lines (n = 6). Data were analyzed by an unpaired, two-tailed Students t test and are shown as the means ± SEMs. Data are representative of at least three independent experiments. * or # p < 0.05, ** or ## p < 0.01, *** or ### p < 0.001; ns not significant
Fig. 2
Fig. 2
Prophylactic activities of an ATO-based whole-cell vaccine. A Schematic diagram showing the prophylactic tumor vaccine regimen. B, C Mice were vaccinated with ATO-pretreated dying tumor cells (TC1, MCA805, MCA205 or CT26 cells) and rechallenged with the corresponding live tumor cells 10 days later. Tumor growth kinetics were monitored for each group (n = 5–6). DG The efficacy of an ATO-based whole-cell vaccine against TC-1 lung cancer was compared among athymic nu/nu mice (D, n = 6), WT C57BL/6 mice (E, G, n = 5–7), and Ifnar−/− mice (F, n = 4). Antibodies were administered to deplete CD8+ T cells or NK cells (E) or to block type I or II IFN signaling (G). HL Kinetics of MCA205 (H, I), MCA805 (J, K) or CT26 (L) tumor growth in mice that had received ATO-based prophylactic vaccines with or without depletion or blocking antibody treatment (n = 5–8). All data are shown as the mean ± SEM. Tumor growth was quantified by calculating the area under the curve (AUC) and analyzed with the unpaired Mann‒Whitney U test. *p < 0.05, **p < 0.01, ***p < 0.001; ns not significant
Fig. 3
Fig. 3
ATO liberates ICD factors from malignant cells. A Intracellular and extracellular ATP concentrations under PBS and ATO (25 μΜ, 16 h) conditions were compared in TC-1, MCA805, MCA205, and CT26 tumor cells (n = 6). B HMGB1 release into the extracellular milieu was quantified under PBS and ATO (25 μΜ, 16 h) conditions for the indicated cell lines (n = 3). C The ATO-induced surface exposure of CALR was analyzed in DAPI+ and DAPI cell fractions. Representative zebra plots and statistical analyses are shown (n = 6). D Immunofluorescence staining for CALR and F-actin to evaluate ATO-induced CALR translocation in TC-1 cells. E The type I IFN production of tumor cells upon F/T cycles or ATO treatment (25 μΜ, 16 h) was measured by a L929-ISRE luciferase reporter system (n = 6). F Kinetics study of the intracellular and extracellular cGAMP content of TC-1 cells following ATO stimulation (25 μΜ) (n = 3). G, H The level of Ifnb transcription in TC-1 (G), MCA805 and MCA205 cells (H) upon ATO treatment in the presence or absence of the STING antagonist H151. Ppia was used as the house-keeping control for qRT‒PCR. Relative expression was calculated as the fold change by means of the 2−ddct method (n = 6). All data are shown as the mean ± SEM. *p < 0.05, **p < 0.01, *** or ### p < 0.001; ns not significant
Fig. 4
Fig. 4
ATO triggers oxidative stress and activates multiple cell death executors. A Gene ontology analyses of commonly up- or downregulated genes in TC-1 and MCA805 cells upon ATO (25 μΜ, 16 h) treatment. B Flow cytometry-based evaluation of ATO-induced ROS generation and its blockade by NAC preconditioning. Representative histograms and statistical analyses of the mean fluorescence intensity (MFI) are shown (n = 3). C The expression of autophagy executors (BECN1, ATG5, and ATG7), apoptosis or pyroptosis executors (CASP3, CASP8, GSDME, and GSDMD), ferroptosis executors (ACSL4 and GPX4), and necroptosis executors (RIP3 and MLKL) was measured by semiquantitative WB. D Kinetics study of the ATO-triggered activation of major cell death executors in TC-1 cells, including p62 degradation, LC3 lipidation, CASP3 cleavage (Cl-CASP3), N-terminal fragment generation from full-length GSDME and GSDMD, GPX4 degradation, and RIP3 and MLKL phosphorylation (left panel). Similar readouts were detected in the presence of the ROS scavenger NAC (right panel). E, F Kinetics analyses of the ATO-induced ROS generation (E) and lipid peroxidation (F) in TC-1 cells with or without NAC treatment. Statistics are shown for ATO versus PBS (marked with *) and ATO + NAC versus ATO (marked with #) (n = 3). G Genes encoding key cell death executors were individually deleted with CRISPR‒Cas9 technologies and validated by WB. HJ ATO-induced cell death in WT cells and all KO clones was measured by evaluating the frequency of Annexin V+DAPI and Annexin V+DAPI+ cells (H, n = 6) or performing colony formation assays (I, J, n = 6). All data are shown as the mean ± SEM. * or # p < 0.05, ** or ## p < 0.01, *** or ### p < 0.001; ns not significant
Fig. 5
Fig. 5
The contributions of different cell death executors to ATO-induced ICD and the benefits of prophylactic vaccines. A WT or KO TC-1 cells (Becn1−/−, Gpx4low, Acsl4−/−, Gsdmd−/−, Gsdme−/−, Bax−/−, Bak−/−, Rip3−/− and Mlkl−/−) were treated with ATO (25 μΜ, 16 h) and utilized as prophylactic vaccines in naïve mice. Tumor growth was monitored for each individual mouse after tumor rechallenge with WT TC-1 cells (n = 5–7). B ATO-preconditioned WT or KO TC-1 cells were injected s.c. into the footpad to stimulate adoptively transferred OT-1 cells. Representative histograms illustrate the proliferation of eFlour670-labeled OT-1 cells in vivo. Statistical analyses of the OT-1 cell number in the draining lymph nodes and associated MFI are shown (n = 6). CF The ATO-induced generation and release of a series of ICD factors, such as ATP, HMGB1 (C, n = 4–9), CALR exposure (D, n = 3), cGAMP release (E, n = 6), and the expression of ISGs (F, n = 6), were compared between WT and KO TC-1 cells. G The ATO-induced disruption of membrane integrity was compared between WT and KO TC-1 cells, as determined by YO-PRO-1/DAPI dual staining (n = 6). H In vitro tumor antigen presentation assays were performed with ATO-treated WT or KO TC-1 cells, which were cocultured with BMDCs and OT-1 cells for 3 days (n = 9). Data are shown as the mean ± SEM. # p < 0.05, ** or ## p < 0.01, *** p < 0.001; ns not significant
Fig. 6
Fig. 6
ATO-based whole-cell vaccines exert therapeutic effects and elicit antitumor immunity. A Schematic diagram showing the therapeutic tumor vaccine regimen. B Tumor growth was monitored in TC-1 cell-bearing mice after intratumoral injection of either ATO or PBS control (n = 4–5). Different doses of ATO were tested, and a data summary is included in Fig. S6. C, D The efficacy of MTX- or ATO-based whole-cell vaccines against TC-1 (C) or MCA805 (D) tumors (n = 5–6) was compared in immunocompetent WT mice. E The efficacy of an ATO-based therapeutic vaccine (TVAC) against TC-1 tumors was tested in Ifnar−/− mice (n = 8). F The therapeutic benefits of different TVACs (ATO-treated TC-1 cells, MCA805 cells or muscle cells, or X-ray-irradiated TC-1 cells) against existing TC-1 tumors were compared. G Schematic diagram showing the prime-boost regimen (left panel). The total cell number in the draining lymph nodes and tumor antigen-stimulated IFN-γ production were quantified (n = 4–10). H Schematic diagram showing the in vitro antigen presentation regimen (upper panel). Different types of ATO-treated dying cells were cocultured with BMDCs and OT-1 cells. IFN-γ secretion by the cell mixture was measured by ELISA 3 days later (lower panel, n = 5). IK Schematic diagram showing the in vivo T-cell competition assay (I). WT and OT-1 CD8+ T cells were prestained with eFlour450 and eFlour670, respectively. The cells were adoptively transferred into WT recipient mice at a 1:1 ratio, as validated by flow cytometry (J). Three days after subcutaneous injection of PBS- or ATO-treated tumor cells (TC-1 WT or TC-1 OVA) into these mice, the frequency of infused OT-1 CD8+ T cells in the draining lymph nodes and their proliferation were analyzed by flow cytometry (K, n = 10). All data are shown as the mean ± SEM. *p < 0.05, **p < 0.01, ***p < 0.001; ns not significant
Fig. 7
Fig. 7
ATO-based TVACs reshape the tumor immune microenvironment and combinatorial approaches for their optimization. A WT and KO cells (Acsl4−/−, Rip3−/−, and Mlkl−/−) were used to generate ATO-based TVACs, and their efficacy was compared (n = 6–7). BE Twelve days after injection of the indicated TVAC, the proportions of tumor-infiltrating immune cell subsets (B, C), the expression of CD69, and the production of cytokines (D, E) were analyzed by FACS (n = 6–7). F A mixture of ICD factor analogs (abbreviated as AMC) was combined with a Rip3−/−-based TVAC (as shown by the scheme). The therapeutic outcome was compared with that of monotherapies or PBS control (as shown by the tumor growth curves in the right panel). G, H Mice bearing TC-1 tumors were treated with TVAC immunization and/or PD-1 blockade at the indicated time points. The tumor growth kinetics were recorded for each individual (G, n = 6–7). Intratumoral IFN-γ production was quantified by ELISpot assays and compared among mice that received anti-PD-1 monotherapy, TVAC monotherapy, or combination therapy. Typical images of ELISpot assays and statistical analyses are shown (H, n = 10–12). All data are shown as the mean ± SEM. *p < 0.05, **p < 0.01, ***p < 0.001; ns not significant

Comment in

References

    1. Song M, Vogelstein B, Giovannucci EL, Willett WC, Tomasetti C. Cancer prevention: molecular and epidemiologic consensus. Science. 2018;361:1317–8. 10.1126/science.aau3830 - PMC - PubMed
    1. Finn OJ. The dawn of vaccines for cancer prevention. Nat Rev Immunol. 2018;18:183–94. 10.1038/nri.2017.140 - PubMed
    1. Garland SM, Kjaer SK, Munoz N, Block SL, Brown DR, DiNubile MJ, et al. Impact and effectiveness of the quadrivalent human papillomavirus vaccine: a systematic review of 10 years of real-world experience. Clin Infect Dis. 2016;63:519–27. 10.1093/cid/ciw354 - PMC - PubMed
    1. McMahon BJ, Bulkow LR, Singleton RJ, Williams J, Snowball M, Homan C, et al. Elimination of hepatocellular carcinoma and acute hepatitis B in children 25 years after a hepatitis B newborn and catch-up immunization program. Hepatology. 2011;54:801–7. 10.1002/hep.24442 - PubMed
    1. Sun X, Zeng L, Huang Y. Transcutaneous delivery of DNA/mRNA for cancer therapeutic vaccination. J Gene Med. 2019;21:e3089. 10.1002/jgm.3089 - PubMed

Publication types