. 2022 Nov 30;20(1):551.
doi: 10.1186/s12967-022-03761-5.

Chagasic cardiomyopathy is marked by a unique signature of activated CD4+ T cells

Affiliations

Chagasic cardiomyopathy is marked by a unique signature of activated CD4+ T cells

Gregório Guilherme Almeida et al. J Transl Med. .

Abstract

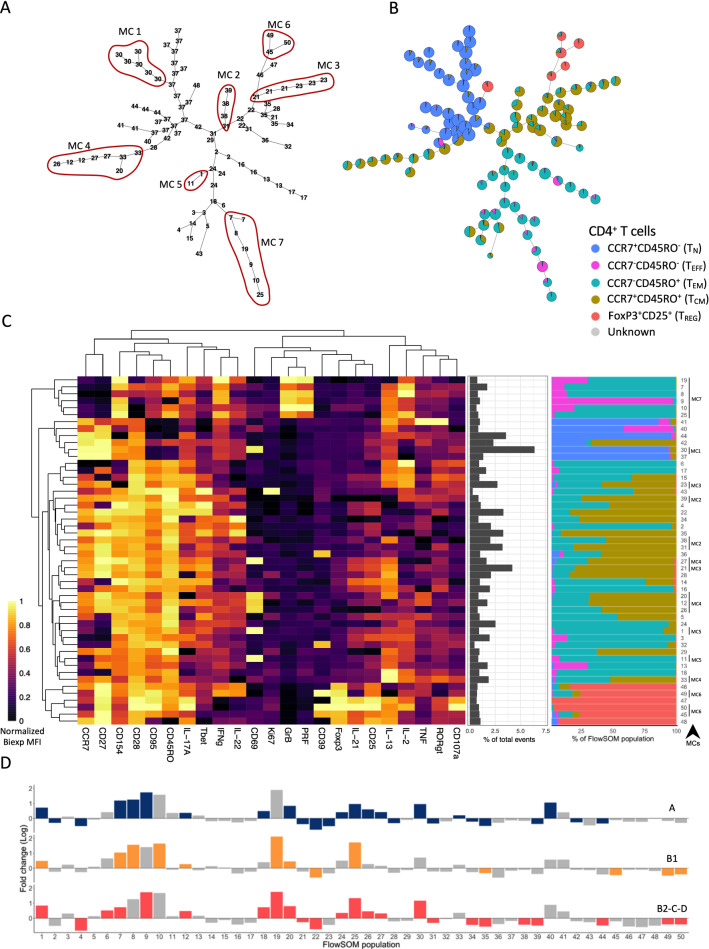
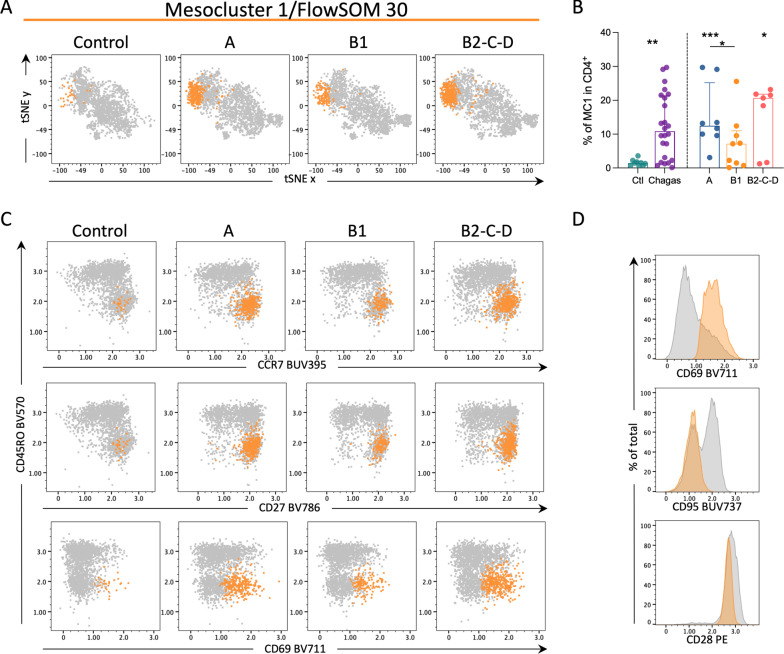
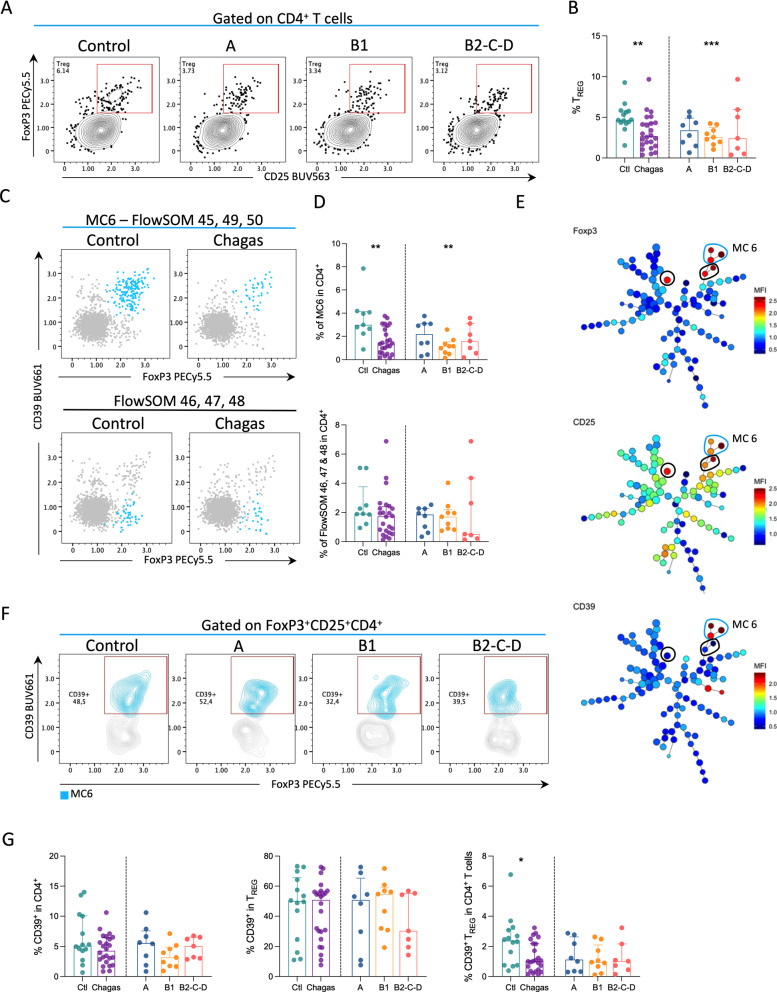
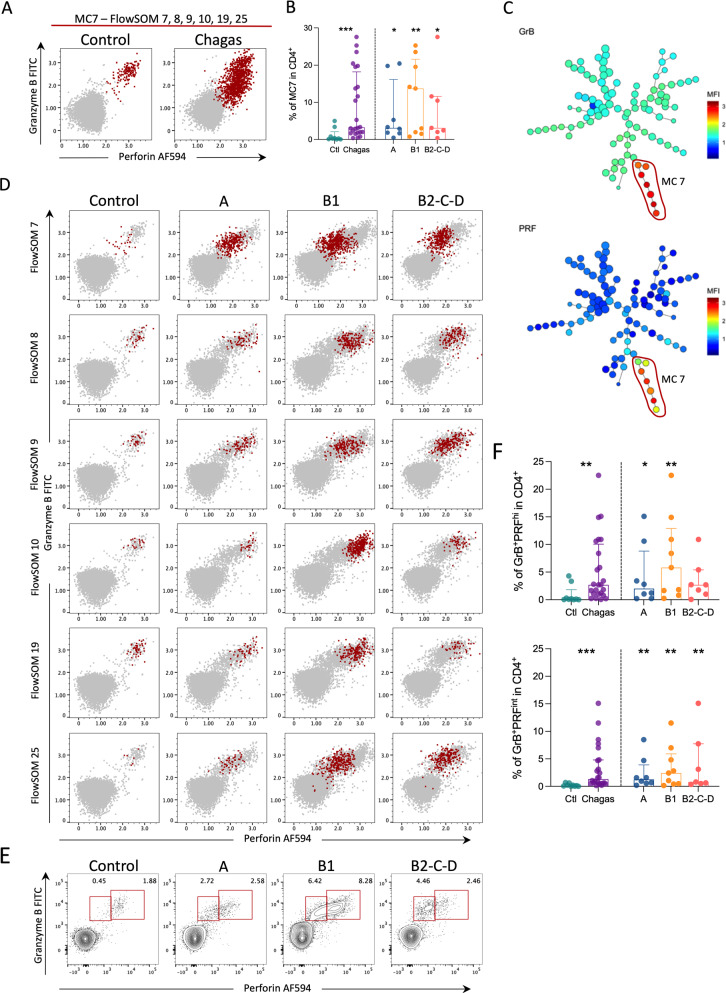
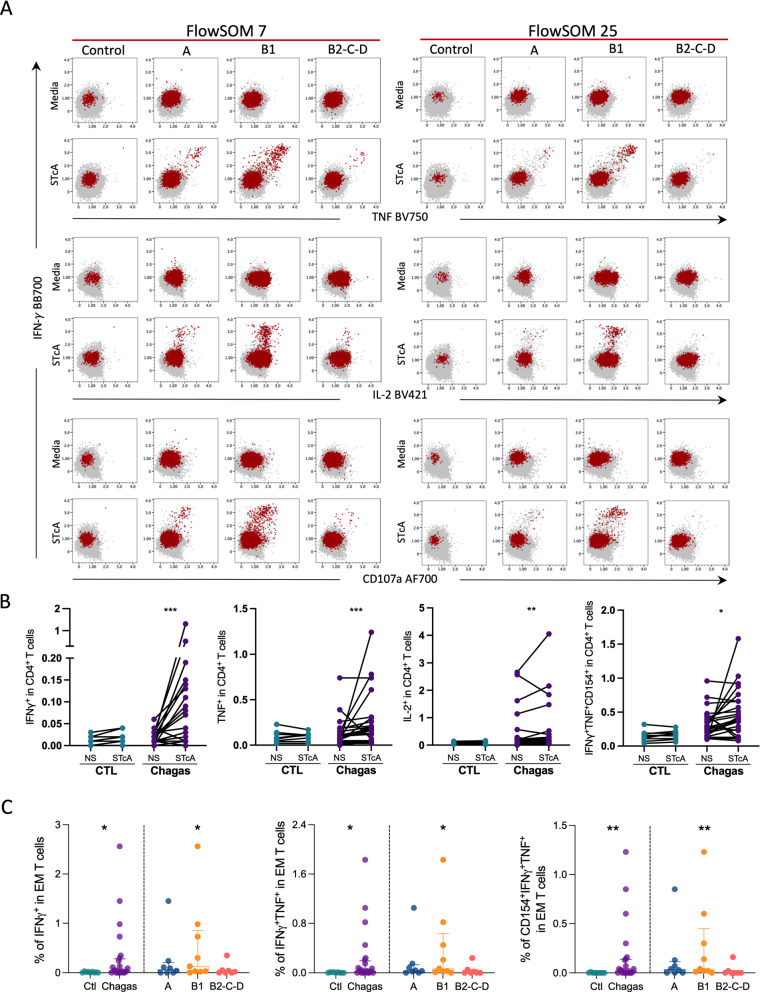
Chagas disease is a neglected tropical disease in Latin America and an imported emerging disease worldwide. Chronic Chagas disease cardiomyopathy (CCC) is the most prominent clinical form and can lead to heart failure, thromboembolism, and sudden death. While previous reports have supported a role for CD4+ T lymphocytes in the pathogenesis of CCC a comprehensive analysis of these cells during different clinical forms is lacking. Here, we used high-dimensional flow cytometry to assess the diversity of circulating CD4+ T cells in patients with distinct clinical forms. We found increased frequencies of CD4+CD69+ T cells in patients compared to controls. CD39+ regulatory T cells, represented by mesocluster 6 were reduced in mild CCC patients compared to controls. Cytotoxic CD4+ T cells co-expressing granzyme B and perforin were expanded in patients with Chagas disease and were higher in patients with mild CCC compared to controls. Furthermore, patients with mild CCC displayed higher frequencies of multifunctional effector memory CD4+ T cells. Our results demonstrate an expansion in activated CD4+ T cells and a decrease in a functional subset of regulatory T cells associated with the onset of Chagas cardiomyopathy, suggesting their role in the establishment of cardiac lesions and as potential biomarkers for disease aggravation.

Keywords: Biomarkers; CD4+ T cells; Cardiomyopathy; Chagas disease; Cytotoxic; Multifunctional; Regulatory; Trypanosoma cruzi.


Conflict of interest statement

The authors declare that they have no competing interests.

Figures

Fig. 1
Fig. 1
Chagas disease induces increased frequencies of CD4+ T cell populations with effector phenotype. A tSNE depicts CD4+ T cell subpopulations (regulatory T cells, TREG, FoxP3+CD25+; central memory, TCM, CCR7+CD45RO+; effector memory, TEM, CCR7CD45RO+; effector, TEFF, CCR7CD45RO; naïve, TN, CCR7+CD45RO) from uninfected controls (Ctl, n = 14) and patients with Chagas disease (Chagas, n = 24). Plots are normalized to represent the same number of events. B Frequencies of regulatory T cells and memory subsets are shown. Bars represent the median and interquartile range, respectively. Asterisks represent significant differences between the assigned group and controls. *p < 0.05, **p < 0.01, ***p < 0.001. C Representative contour plots show the gating strategy for TREG and non-TREG (left panel), and memory CD4+ T cells defined by the expression of CCR7 and CD45RO (right panel) from control and patients in different stages of Chagas disease (top to bottom). D Principal-component analysis (PCA) for CD4+ T cell subpopulations from uninfected controls and infected patients in different stages of Chagas disease: A (indeterminate, n = 8), B1 (mild cardiomyopathy, n = 9), B2-C-D (established cardiomyopathy, n = 7)
Fig. 2
Fig. 2
Unsupervised clustering of CD4+ T cells reveals unique characteristics of patients with Chagas disease. Minimum spanning trees (MST) show 100 clusters representing the numbers of each of the 50 FlowSOM populations (A) and their composition as defined by manual gating of CD4+ T cell subpopulations (TREG, TCM, TEM, TEFF, TN) (B). C Heatmap depicts the expression of 23 molecules, scaled by each marker, across the 50 FlowSOM populations. Proportion (middle panel) and composition (right panel) of each FlowSOM population within CD4+ T cells. FlowSOM populations were clustered based on hierarchical clustering by similar expression patterns and were further grouped in mesoclusters (MC1-7). These mesoclusters are highlighted in the MST (A). D Fold changes of FlowSOM population frequencies from infected patients in different stages of Chagas disease over controls. Colored bars highlight FlowSOM populations with the statistical difference between patients with clinical forms of Chagas disease (blue, A; orange, B1; coral, B2-C-D) and controls
Fig. 3
Fig. 3
Activated subpopulations expressing CD69 are increased among naive CD4+ T cells in patients with Chagas disease. A tSNE plots depict CD4+ T cells in gray and the FlowSOM population number 30 (MC1) in yellow from controls and infected patients in different stages of Chagas disease (A, B1, B2-C-D). B Frequency of MC1 in CD4+ T cells. Bars represent median and interquartile range. Asterisks represent significant differences between the assigned group and controls. Asterisks over connecting lines represent significant differences between the assigned groups. *p < 0.05, **p < 0.01, ***p < 0.001. C Representative dot plots show the expression of CCR7, CD27, and CD69 (x-axis) by CD45RO (y-axis) from controls and infected patients in different stages of Chagas disease (A, B1, B2-C-D): CD4+ T cells in gray and MC1 in yellow. D Histograms represent the expression of CD69, CD95, and CD28 (x-axis) in CD4+ T cells in gray and the MC1 in yellow. In each histogram, the population represented in gray or yellow is scaled by the total events of each population (% of total, y-axis)
Fig. 4
Fig. 4
FlowSOM reveals unique memory CD4+ T cells defined by CD69 expression in patients with Chagas disease. A tSNE plots depict CD4+ T cells in gray and MC2 (FlowSOM 31, 38, 39), MC3 (FlowSOM 21, 23), MC4 (FlowSOM 12, 20, 26, 27, 33) and MC5 (FlowSOM 1, 11) in red from controls and infected patients with Chagas disease. B MST shows the differential expression of CD69, represented from blue to red indicating lower to higher expression, respectively. MC2-5 are highlighted by red circles. C Representative dot plots of the expression of CD69 (x-axis) by CD45RO (y-axis) from controls and infected patients in different stages of Chagas disease (A, B1, B2-C-D): CD4+ T cells are shown in gray and MC2-5, from the top to bottom, in red. D Frequencies of MC2-5 CD4+ T cells. Bars represent the median and interquartile range. Asterisks represent significant differences between the assigned group and controls. *p < 0.05, **p < 0.01, ***p < 0.001
Fig. 5
Fig. 5
Regulatory T cells expressing CD39 are decreased in mild cardiomyopathy. Representative contour plots (A) and frequencies (B) of TREG, defined by the expression of FoxP3 and CD25, from controls and infected patients in different stages of Chagas disease (A, B1, B2-C-D). C Expression of CD39 and FoxP3 in cells from cluster MC6 (FlowSOM clusters 45, 49 and 50; top row) and combined FlowSOM clusters 46–48 (bottom row) between controls and patients are shown. Clusters are shown in blue and overlaid on total CD4+ T cells (grey). D The frequency of MC6 (top) and combined FlowSOM clusters 45, 49 and 50 (bottom) is shown for controls and patient groups. Bars represent the median and interquartile range. E MST shows the differential expression of FoxP3, CD25, and CD39, represented from blue to red indicating lower to higher expression, respectively. MC6 is highlighted by blue circles and FlowSOM populations 46, 47 and 48 by black circles. F Representative contour plots depict the expression of CD39 (blue) among TREG (gray). G Frequency of CD39+ T cells in CD4+ T cells (left), frequency of CD39+ in TREG (middle) and frequency CD39+TREG in CD4+ T cells (right). Bars represent the median and interquartile range. Asterisks represent significant differences between Chagas’ patients and controls. *p < 0.05, **p < 0.01, ***p < 0.001
Fig. 6
Fig. 6
Granzyme B and perforin co-expressing cells are expanded during Chagas disease. Representative contour plots (A) and frequencies (B) depicting the expression of granzyme B and perforin in MC7 in controls (n = 9) and infected patients with Chagas disease (Chagas, n = 24). C MST shows the differential expression of granzyme B and perforin, represented from blue to red indicating lower to higher expression, respectively. MC7 is highlighted by a red circle. D Representative dot plots of the expression of perforin (x-axis) by granzyme B (y-axis) from controls and infected patients in different stages of Chagas disease (A, B1, B2-C-D). CD4+ T cells are colored in gray and each FlowSOM population part of MC7 individually in red. E Contour plots depict the intermediate and high expression of perforin in controls and infected patients in different stages of Chagas disease (A, B1, B2-C-D). F Bars represent the median and interquartile range. Asterisks represent significant differences between the assigned group and controls. *p < 0.05, **p < 0.01, ***p < 0.001
Fig. 7
Fig. 7
Cytokine producing effector memory CD4+ T cells are responsive to antigenic recall and are increased during mild cardiac Chagas disease. A Representative dot plots of the expression of TNF, IL-2, and CD107a (x-axis) by IFN-γ (y-axis) from controls and infected patients in different stages of Chagas disease (A, B1, B2-C-D), before and after the stimulation with soluble T. cruzi antigen (STcA). CD4+ T cells are colored in gray and FlowSOM populations 7 and 25 in red. B Frequencies of IFN-γ, TNF, IL-2, and CD154+TNF+IFN-γ+ cells in CD4+ T cells stimulated (STcA) or not (NS) with soluble T. cruzi antigen. Each dot represents an individual. Lines connect paired observations from the same individual. C Frequencies of IFN-γ, IFN-γ and TNF, IFN-γ and TNF and CD154 in effector memory (EM) CD4+ T cells. Bars represent the median and interquartile range. Asterisks represent significant differences between the assigned group and controls. *p < 0.05, **p < 0.01, ***p < 0.001

References

    1. Dias JCP, Ramos AN, Gontijo ED, Luquetti A, Shikanai-Yasuda MA, Coura JR, et al. 2nd Brazilian Consensus on Chagas disease, 2015. Rev Soc Bras Med Trop. 2016;49:3–60. doi: 10.1590/0037-8682-0505-2016. - DOI - PubMed
    1. Shikanai-Yasuda MA, Carvalho NB. Oral transmission of chagas disease. Clin Infect Dis. 2012;54:845–52. doi: 10.1093/cid/cir956. - DOI - PubMed
    1. Angheben A, Boix L, Buonfrate D, Gobbi F, Bisoffi Z, Pupella S, et al. Chagas disease and transfusion medicine: a perspective from non-endemic countries. Blood Transfus. 2015;13:540–50. - PMC - PubMed
    1. Martins-Melo FR, Ramos Junior AN, Alencar CH, Heukelbach J. Multiple causes of death related to Chagas’ disease in Brazil, 1999 to 2007. Rev Soc Bras Med Trop. 2012;45:591–6. doi: 10.1590/S0037-86822012000500010. - DOI - PubMed
    1. Higuchi MD. Endomyocardial biopsy in Chagas’ heart disease: pathogenetic contributions. Sao Paulo Med J. 1995;113:821–5. doi: 10.1590/S1516-31801995000200013. - DOI - PubMed

Publication types