. 2022 Nov 29;10(1):172.
doi: 10.1186/s40478-022-01478-6.

CTCF loss induces giant lamellar bodies in Purkinje cell dendrites

Affiliations

CTCF loss induces giant lamellar bodies in Purkinje cell dendrites

Teruyoshi Hirayama et al. Acta Neuropathol Commun. .

Abstract

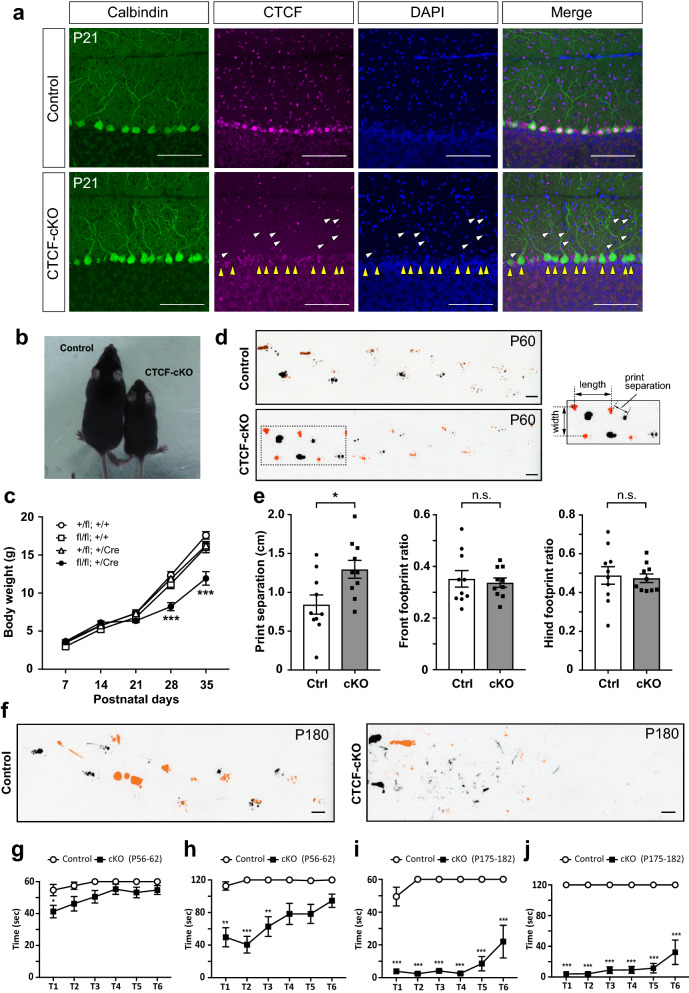
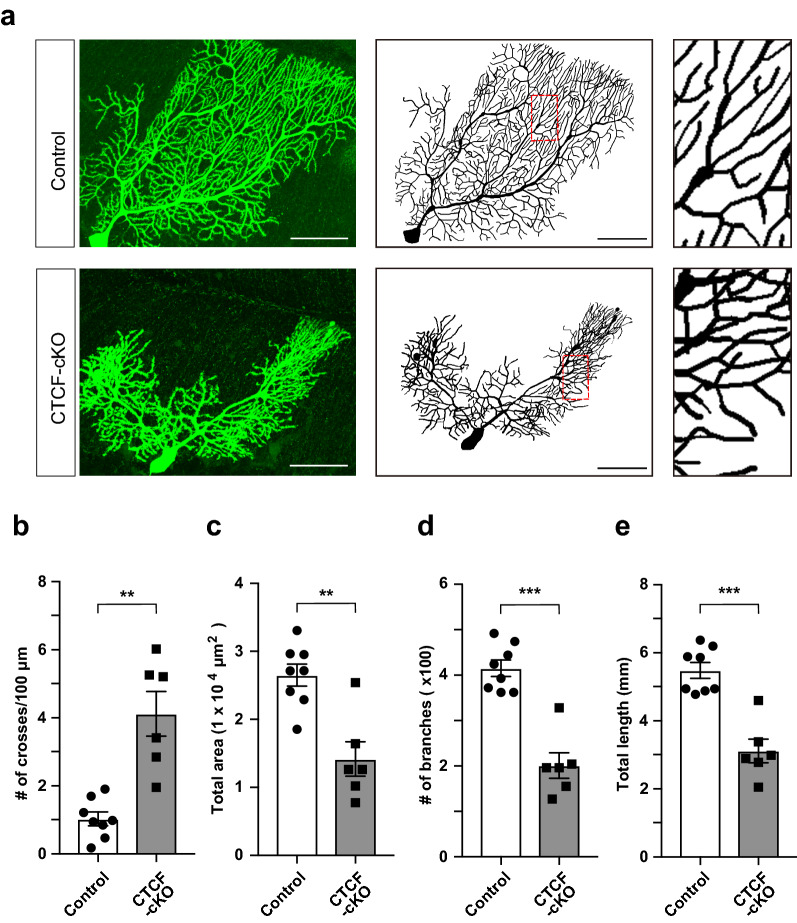
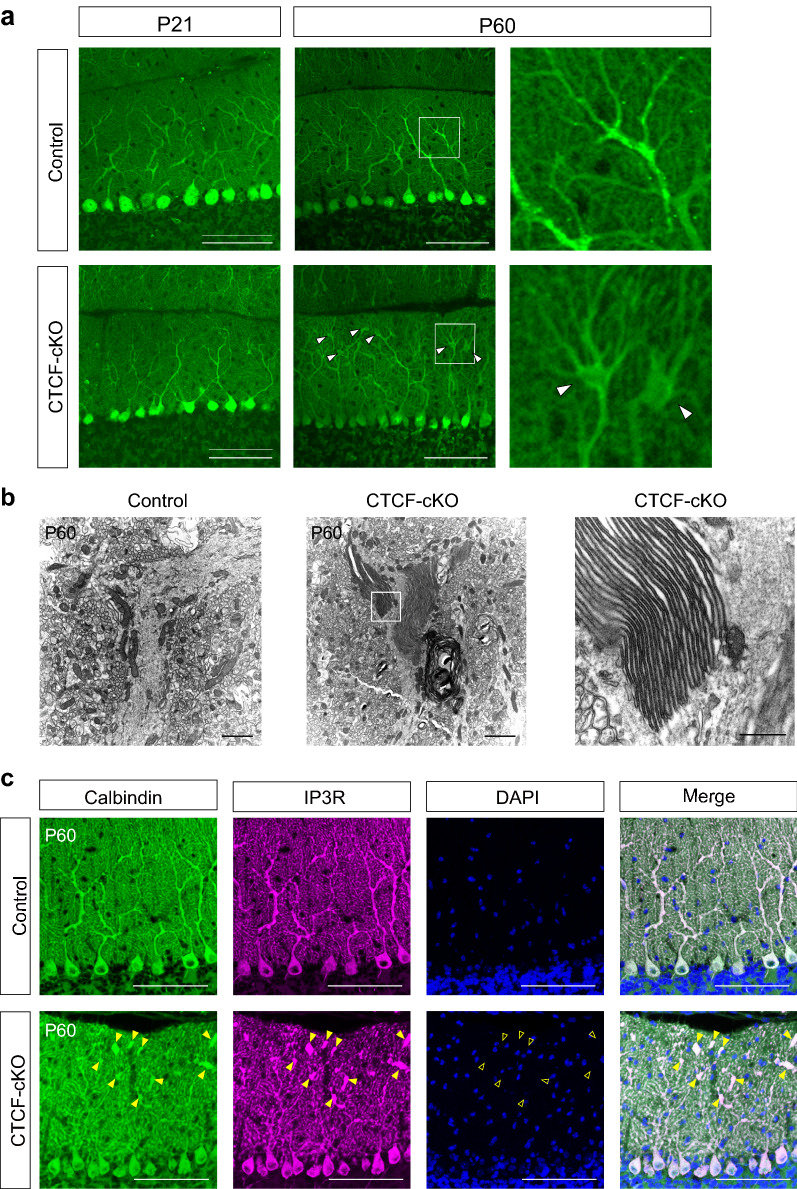
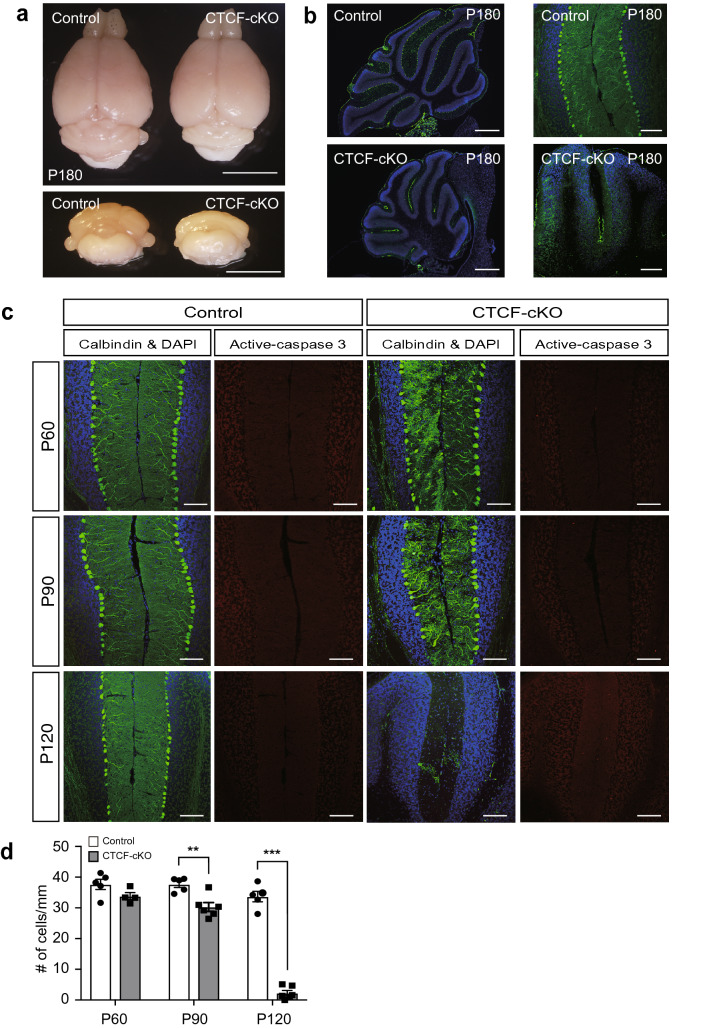
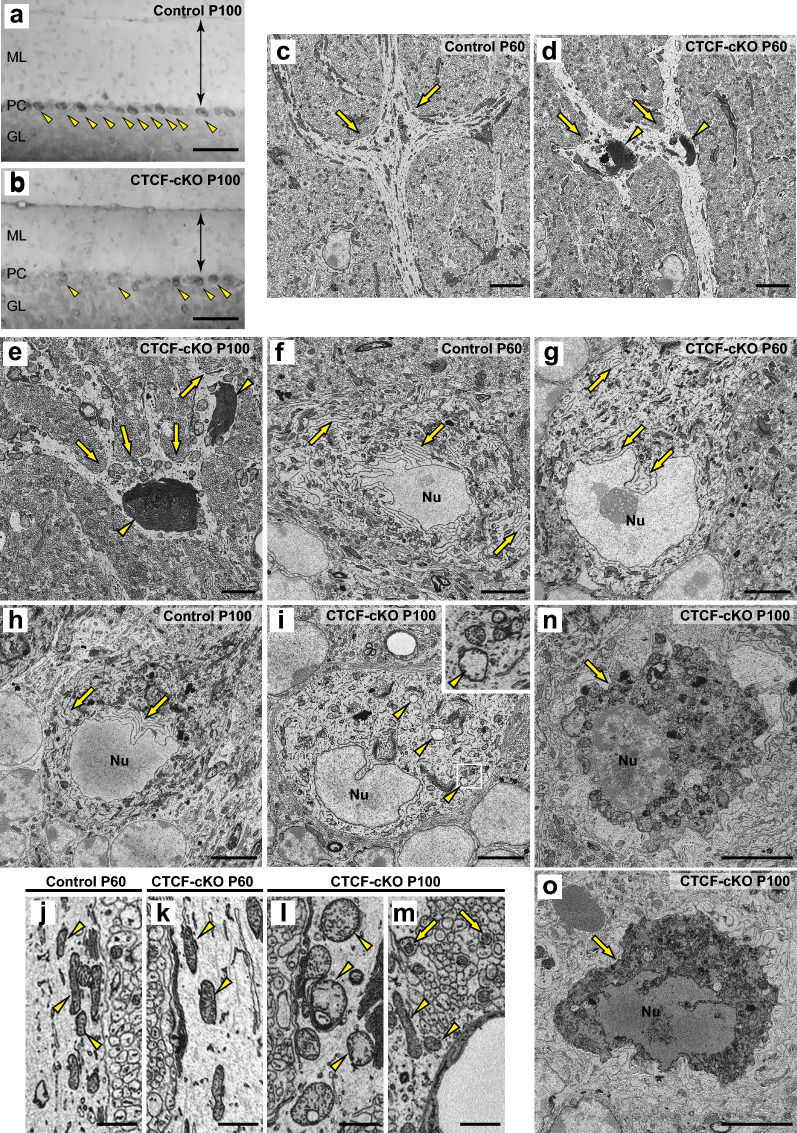
CCCTC-binding factor (CTCF) has a key role in higher-order chromatin architecture that is important for establishing and maintaining cell identity by controlling gene expression. In the mature cerebellum, CTCF is highly expressed in Purkinje cells (PCs) as compared with other cerebellar neurons. The cerebellum plays an important role in motor function by regulating PCs, which are the sole output neurons, and defects in PCs cause motor dysfunction. However, the role of CTCF in PCs has not yet been explored. Here we found that the absence of CTCF in mouse PCs led to progressive motor dysfunction and abnormal dendritic morphology in those cells, which included dendritic self-avoidance defects and a proximal shift in the climbing fibre innervation territory on PC dendrites. Furthermore, we found the peculiar lamellar structures known as "giant lamellar bodies" (GLBs), which have been reported in PCs of patients with Werdnig-Hoffman disease, 13q deletion syndrome, and Krabbe disease. GLBs are localized to PC dendrites and are assumed to be associated with neurodegeneration. They have been noted, however, only in case reports following autopsy, and reports of their existence have been very limited. Here we show that GLBs were reproducibly formed in PC dendrites of a mouse model in which CTCF was deleted. GLBs were not noted in PC dendrites at infancy but instead developed over time. In conjunction with GLB development in PC dendrites, the endoplasmic reticulum was almost absent around the nuclei, the mitochondria were markedly swollen and their cristae had decreased drastically, and almost all PCs eventually disappeared as severe motor deficits manifested. Our results revealed the important role of CTCF during normal development and in maintaining PCs and provide new insights into the molecular mechanism of GLB formation during neurodegenerative disease.

Keywords: CCCTC-binding factor; Giant lamellar body; Motor dysfunction; Neurodegeneration; Purkinje cell.


Conflict of interest statement

The authors have no competing interests to declare.

Figures

Fig. 1
Fig. 1
Grid2-Cre-mediated CTCF-cKO mice show progressive motor coordination deficits. a Confirmation of CTCF deletion by immunohistochemical staining of the cerebellum at P21. Positive anti-CTCF signals (magenta) were not detected in the PCs of CTCF-cKO mice (yellow arrowheads) or some molecular layer neurons (white arrowheads). Scale bars: 100 μm. b The body size of CTCF-cKO mice was smaller than that of control littermates. Mice at P30 are shown. c Body weight over time from P7 to P35 was measured for each genotype. n = 11 Ctcf;Grid2-Cre (+/fl; +/+), n = 8 Ctcf;Grid2-Cre (fl/fl; +/+), n = 9 Ctcf;Grid2-Cre (+/fl; +/Cre), n = 11 Ctcf;Grid2-Cre (fl/fl; +/Cre). Significant differences were found between Ctcf;Grid2-Cre (fl/fl; +/Cre) and other genotypes at P28 and P35. d Footprint analysis. Representative footprint patterns of control and CTCF-cKO mice at P60. Black, forepaws. Orange, hindpaws. Print separation and stride length and width are defined as indicated (right panel). Scale bars: 1 cm. e Print separation (left), front footprint ratio (width/length of forepaw, centre), and hind footprint ratio (width/length of hidpaw, right). n = 10 (control, cKO). f Footprint analysis. Representative footprint patterns of a control and CTCF-cKO mouse at P180. Orange, forepaws. Black, hindpaws. Scale bars: 1 cm. g–j Rotarod test. A total of six trials (T1–T6) were conducted for each mouse at P56–62 (g, h) and P175–182 (i, j). (g, i) In one set of trials, rod rotation occurred at a constant rate of 5 rpm over a 60-s period. (h, j) In a second set, rod rotation accelerated from 0 to 3 rpm over the first 60 s, and the mice were measured for a maximum of 120 s. g n = 11 (control), n = 19 (cKO); h n = 9 (control), n = 12 (cKO); i, j n = 6 (control), n = 7 (cKO). n.s., not statistically significant; *p < 0.05, **p < 0.01, ***p < 0.005. Error bars represent the SEM
Fig. 2
Fig. 2
Proximal shift of CF innervation territories in CTCF-cKO mice. a Interlobular distribution of recorded PCs in control (upper) and CTCF-cKO (lower) mouse brains. Open and closed circles represent mono-innervated and multiply innervated PCs, respectively. b (left) Frequency distribution of the number of CFs innervating individual PCs in control (n = 45 cells, 4 mice) and CTCF-cKO (n = 38 cells, 4 mice) mice aged P47–P59. (right) Representative CF-EPSC traces in a control (upper) and a CTCF-cKO (lower) mouse. Holding potential was − 10 mV. Several traces evoked around the threshold are superimposed. c Distribution of CF terminals in the molecular layer in control (upper) and CTCF-cKO (lower) mice at P60. CF terminals and PCs were stained using anti-VGluT2 (magenta) and anti-calbindin (green), respectively. Scale bars: 50 μm. d Relative densities of CF terminals in the molecular layer in control (n = 4) and CTCF-cKO (n = 4) mice. The molecular layer was evenly divided into five bins from the bottom to the pia surface, and the number of CF terminals in individual bins was determined (see Additional file 6 Fig. S4g, online resources). e Representative images of VGluT2-positive CF terminals (arrowheads) on the PC somata in control (upper) and CTCF-cKO (lower) mice. Scale bars: 10 μm. f Number of CF terminals on PC somata. n = 12 (control, cKO). *p < 0.05, ***p < 0.005. Error bars represent the SEM
Fig. 3
Fig. 3
Loss of CTCF causes abnormal dendritic arborization with dendritic crossing in PCs. a Neurobiotin staining of a control and CTCF-cKO PC at P47-59 (left) and the resulting traced PCs (middle). A dendrite located in the region of the red box is shown at higher magnification (right) for each PC. Neurobiotin was injected into PCs as part of the patch-clamp recording process. Scale bars: 50 μm. be Quantitative analysis of the number of self-crossing dendrites (b), total area (c), number of branches (d), and total dendritic length (e). n = 8 neurons (control), n = 6 neurons (cKO). **p < 0.01, ***p < 0.005. Error bars represent the SEM
Fig. 4
Fig. 4
GLBs are found in palm-like dendritic swelling of PC. a Anti-calbindin immunohistochemical staining at P21 and P60. Arrowheads indicate palm-like swelling at the dendritic branch points of PCs. Digitally zoomed images (right) correspond to the region in the white box in the middle panels. b Electron microscopy analysis at P60. GLBs were found in the PC dendrites of CTCF-cKO mice. A higher-magnification image of the region in the white box in the middle panel is shown (right). c Immunohistochemical staining with anti-IP3R (magenta). Whereas both arrowheads and open arrowheads indicate the location of palm-like swelling in PC dendrites, the open arrowheads further indicate that there were no DAPI-positive signals (blue) at those locations. Scale bars: 100 μm (a, c), 2 μm (b, left and middle panel), 500 μm (b, right panel)
Fig. 5
Fig. 5
Loss of PCs in CTCF-cKO mice. a typical picture of the whole brains of control and CTCF-cKO mice at P180. The size of the cerebellum in CTCF-cKO mice was smaller than that in control mice. b Sagittal sections of the cerebellum stained with anti-calbindin (green) and counterstained with DAPI (blue) at P180. The left panel shows that CTCF-cKO mice had smaller cerebellums than control mice. The right panel shows none of the calbindin-positive PCs in CTCF-cKO mice. c Temporal analysis of PC loss. The cerebellum was stained with anti-calbindin (green) and anti-active caspase-3 (red) and counterstained with DAPI (blue). PCs were dramatically lost from P90 to P120 in CTCF-cKO mice. We observed no staining differences for active caspase-3 between control and CTCF-cKO mice. d Quantification of the number of PCs. n > 4 at each stage for each genotype. **p < 0.01, ***p < 0.005. Error bars represent the SEM. Scale bars: 5 mm (a), 500 μm (b, left panel), 100 μm (b, right panel and c)
Fig. 6
Fig. 6
Temporal analysis of morphological changes in organelles in PCs by SBF-SEM. a, b Toluidine blue staining at P100. Arrowheads indicate PCs. Double-headed arrow indicates the molecular layer (ML). The Purkinje cell (PC) layer and granular layer (GL) are also shown. ce Typical SBF-SEM images of PC dendrites in control mice at P60 (c) and CTCF-cKO mice at P60 (d) and P100 (e). Arrows indicate the dendritic branch points, where GLBs typically form only in CTCF-cKO mice (d, e, arrowheads). fi Morphological changes in the nucleus (Nu) and around the nucleus. Nuclei and Nissl bodies (arrows) are shown in control mice at P60 (f) and P100 (h) and in CTCF-cKO mice at P60 (g) and P100 (i). Arrowheads in (i) indicate swollen mitochondria with reduced cristae. The area marked with a white box is magnified in the inset. jl Morphological changes in mitochondria in PC dendrites. Mitochondria in PC dendrites are shown for control mice at P60 (j) and in CTCF-cKO mice at P60 (k) and P100 (l). Arrowheads indicate thin normal mitochondria (j), slightly swollen mitochondria (k), and swollen mitochondria (l). m Normal mitochondria of parallel fibres (arrows) and processes of Bergmann glia (arrowheads) surrounding a blood vessel (BV) are shown in a CTCF-cKO mouse at P100. n, o PCs in CTCF-cKO mice at P100 that show cellular debris (arrow) without nuclear fragmentation. Scale bars: 100 μm (a, b), 5 μm (ci, n, o), and 1 μm (jm)

References

    1. Bastaki F, Nair P, Mohamed M, Malik EM, Helmi M, Al-Ali MT, Hamzeh AR. Identification of a novel CTCF mutation responsible for syndromic intellectual disability—a case report. BMC Med Genet. 2017;18:1–6. doi: 10.1186/s12881-017-0429-0. - DOI - PMC - PubMed
    1. Crawley JN. Behavioral phenotyping strategies for mutant mice. Neuron. 2008;57:809–818. doi: 10.1016/j.neuron.2008.03.001. - DOI - PubMed
    1. Cummings JF, de Lahunta A. A study of cerebellar and cerebral cortical degeneration in Miniature Poodle pups with emphasis on the ultrastructure of Purkinje cell changes. Acta Neuropathol. 1988;75:261–271. doi: 10.1007/BF00690534. - DOI - PubMed
    1. Dekker J, Mirny L. The 3D genome as moderator of chromosomal communication. Cell. 2016;164:1110–1121. doi: 10.1016/j.cell.2016.02.007. - DOI - PMC - PubMed
    1. Ehrlich M, Lacey M. DNA methylation and differentiation: silencing, upregulation and modulation of gene expression. Epigenomics. 2013;5:553–568. doi: 10.2217/epi.13.43. - DOI - PMC - PubMed

Publication types