. 2022 Dec;13(1):277-299.
doi: 10.1080/19491034.2022.2144013.

Image analysis workflows to reveal the spatial organization of cell nuclei and chromosomes

Affiliations

Image analysis workflows to reveal the spatial organization of cell nuclei and chromosomes

Ricardo S Randall et al. Nucleus. 2022 Dec.

Abstract

Nucleus, chromatin, and chromosome organization studies heavily rely on fluorescence microscopy imaging to elucidate the distribution and abundance of structural and regulatory components. Three-dimensional (3D) image stacks are a source of quantitative data on signal intensity level and distribution and on the type and shape of distribution patterns in space. Their analysis can lead to novel insights that are otherwise missed in qualitative-only analyses. Quantitative image analysis requires specific software and workflows for image rendering, processing, segmentation, setting measurement points and reference frames and exporting target data before further numerical processing and plotting. These tasks often call for the development of customized computational scripts and require an expertise that is not broadly available to the community of experimental biologists. Yet, the increasing accessibility of high- and super-resolution imaging methods fuels the demand for user-friendly image analysis workflows. Here, we provide a compendium of strategies developed by participants of a training school from the COST action INDEPTH to analyze the spatial distribution of nuclear and chromosomal signals from 3D image stacks, acquired by diffraction-limited confocal microscopy and super-resolution microscopy methods (SIM and STED). While the examples make use of one specific commercial software package, the workflows can easily be adapted to concurrent commercial and open-source software. The aim is to encourage biologists lacking custom-script-based expertise to venture into quantitative image analysis and to better exploit the discovery potential of their images.Abbreviations: 3D FISH: three-dimensional fluorescence in situ hybridization; 3D: three-dimensional; ASY1: ASYNAPTIC 1; CC: chromocenters; CO: Crossover; DAPI: 4',6-diamidino-2-phenylindole; DMC1: DNA MEIOTIC RECOMBINASE 1; DSB: Double-Strand Break; FISH: fluorescence in situ hybridization; GFP: GREEN FLUORESCENT PROTEIN; HEI10: HUMAN ENHANCER OF INVASION 10; NCO: Non-Crossover; NE: Nuclear Envelope; Oligo-FISH: oligonucleotide fluorescence in situ hybridization; RNPII: RNA Polymerase II; SC: Synaptonemal Complex; SIM: structured illumination microscopy; ZMM (ZIP: MSH4: MSH5 and MER3 proteins); ZYP1: ZIPPER-LIKE PROTEIN 1.

Keywords: 3D organization; Nucleus; RNA Pol II; SIM; STED imaging; chromatin; chromosome; crossovers; image analysis; meiosis; metaphase; mitosis; nuclear bodies; nuclear speckles; oligo FISH; pachytene; quantification; segmentation; spatial distribution; transcription factories.


Conflict of interest statement

Author contribution

The work was conceived by CB; carried out and conceptually refined by CB, RSR, DR, CJ, AN, KK, MK, MAA, VS, CT, IC, K, MP, IK, AS, SM, and SD; supervised by CB, CT, VS, ML, SH, RS, DS, and AP; and written by CB, RSR, CJ, AN, KK, MK, MAA, VS, CT, and IC. All authors read and revised the manuscript.

Figures
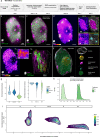
Figure 1.
Figure 1.
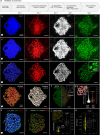
Analysis of the spatial distribution of RNA Pol II clusters in intact nuclei. (a) Overview of the workflow illustrated in b-i; (b) 3D projection of a 3D-STED image reporting on immunolabelled RNA Pol II (isoform phosphorylated on SerP, green, RNPII-ser2P) and DNA (magenta, Hoechst 580CP [26]), raw image; (c) Same image following deconvolution, nucleus contour segmentation and masking; (d) Intensity-coded coloring mode (Fire) of the DNA channel and frames magnified in the insets showing examples of chromocenters (CC, d1) and nanochromocenters (nanoCC, d2) in the original channel (left) and after segmentation and pseudo-coloring (right); (e) Intensity-coded coloring mode (Fire) of the RNPII-ser2P channel showing a dense distribution of clusters with identifiable intensity peaks, enabling segmentation as adaptive spots (e1, e2), e1: single plane showing the spot contours; e2, 3D segment of the image after segmentation, clusters pseudo-colored in green, DNA in magenta. (f) Fully segmented image containing surface (nucleus, nucleolus, CC and nanoCC) and spot objects (RNPII-ser2P, abbreviated S2P). (g-i) Data exploration using DataViz (github.com/barouxlab/DataViz, Supplemental File 1- Dataviz_guidelines). (g), Violin plots showing a similar DNA density distribution in CC and nanoCC but much lower density in S2P clusters (intensity mean, DNA channel, normalized per image) and a sharp peripheral location of CC as formerly described (Andrey et al., 2010; Fransz et al., 2002), contrasting with the more dispersed distribution of nanoCC and S2P clusters (distance to nucleus surface (0) normalized using the nucleus center of mass as reference);.(h) Example showing an application of the workflow, to compare the distribution of RNPII cluster intensities between two treatments: A and B. (i) Another example illustrating one of the many analyses enabled by the workflow and DataViz, with density scatter plots of DNA intensity means in RNPII clusters as a function of their distance to the nucleus surface. Scale bars: b-f, 2 µm; insets, as indicated.
Figure 2.
Figure 2.
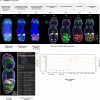
Analysis of the spatial distribution of a fluorescently tagged protein associated with the nuclear envelope. (a) Overview of the Image analysis workflow. Details of the parameters are in supplements. (b) Raw image of NE-GFP (Nuclear Envelope – associated protein fused to GFP) signal in a root nucleus; 3D rendering in gray levels suggests an enrichment of the protein at the equatorial region of the nucleus (white arrow). (c) Same image (3D) as in (b) using a fire color scale for NE-GFP signal intensities display (0–255), c1-c3 insets: cross sections at selected top, middle and bottom planes, respectively. (d) Result of the segmentation of the NE-GFP signal domain as a surface (gray); a spot (yellow) is created at the surface’ center-of-mass. (e) a new XYZ coordinate system (reference frame) is docked at the center-of-mass. (f) The NE-GFP signal is segmented as spots of adaptive size (‘growing spots’) using the channel masked by the surface; spots are classified according to their axial (z) position, the equatorial region is defined ±2 µm around the origin. Three spot classes are created located at the top, middle and bottom of the nucleus (blue, magenta, green, respectively). f1, f2 insets: XY and XZ sections. (g) The intensity mean of the spots is plotted as a function of their axial position (z) relative to the new reference frame for the image shown in (b-f). The colors indicate the ‘top’, ‘middle’ and ‘bottom’ classes, respectively. (h) The volume and normalized intensity mean of NE-GFP spots are plotted for each class, for n = 8 nuclei images segmented following this workflow. Kruskal-Wallis and Dunn’s multiple comparison tests with bottom vs middle and top vs middle indicate statistically significant differences with P < 0.001 (***) for both variables. Scale bars: 2 µm.
Figure 3.
Figure 3.
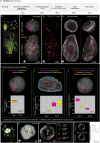
Analysis of crossover distribution in meiocytes. (a) Overview of the image analysis workflow in 5 steps illustrated on two images marking the synaptonemal complex (SC) and crossovers (CO) with different components (provided in Supplemental File 3): image 3a (b-g) represents a barley meiocyte at zygotene stage immunostained for DMC1, ZYP1 and ASY1 and counterstained for DNA using DAPI. The image was acquired by confocal microscopy (ZEISS LSM 710) as described (Colas et al., 2019). Image 3b (h-k) represents a barley meiocyte at the late pachytene stage immunostained for ASY1 (Ch = 2), ZYP1 (Ch = 3) and HEI10 (Ch = 4) and counterstained for DNA using DAPI (Ch = 1). The image was acquired by 3D-SIM as described previously (Hesse et al., 2019). (b) Original image acquired by confocal imaging, the different labeling are indicated. (c) image following deconvolution to resolve the SC and immunostained CO. (d) segmentation of the chromosomes as surface and masking of the ZYP1, ASY1 and DMC1 channels to remove background signal. It allows resolving DMC1 foci at high resolution (inset). (e) SC segmentation using the ZYP1 and ASY1 masked channels (f) DMC1 foci segmentation (left) and classification according to their intensity (right and inset = intensity plot per category), (g) classification of DMC1 foci according to their distance relative to the ZYP1 surface. (h) Original 3d SIM image (image 3b), (i) same image following ZYP1 and HEI10 segmentation, (j) HEI10 spots were classified according to their intensity (T1, T2, T3 on graph and inset); 20 foci were scored (automatic) for the T1 class as described in earlier studies, (k) HEI10 classes differ by the DNA density. Scale bars: 5 µm except for the inset d, DMC1 channel (200 nm), Plots (f, g, j, k): Imaris Vantage.
Figure 4.
Figure 4.
Analysis of the spatial distribution of nuclear speckles and bodies. (a) Overview of the image analysis workflow, details and training images are provided in Supplemental Files 4. The analysis of two images (Supplemental File 4 – image 4a and 4b) representing plant and animal nuclei are shown in (b-e) and (f-k), respectively. (b) Raw, STED image (3D projection) showing an isolated leaf nucleus stained for DNA (magenta, Hoechst 580CP [26],) and immunostained for SSSU (green). (c) Segmentation result: the nucleus, chromocenters (CC) and the nuclear speckles (SSSU) were segmented as surface objects (legend, right panel). (d) The position of CC and SSSU speckles was plotted relative to the nucleus’ periphery defined by the surface’s boundary (0 = at the boundary; negative values = toward the interior), n = 9 nuclei analyzed. (e) The relative enrichment of SSSU on chromatin was plotted as the SSSU:DNA mean signal intensity ratio for different classes of speckles defined by their distance to CC (in µm). Plots were generated using Dataviz (see Workflow 1) using data from n = 10 segmented nuclei. (f) Confocal image (3D projection) of a nucleus from a mouse naïve pluripotent embryonic stem cell stained for DNA (gray, DAPI), immunostained for the chromatin protein under study (CP, green) and H3K27me3 (magenta) forming large nuclear bodies; the arrows show truncated nuclei in the field of view undesirable for downstream analyses and eliminated upon masking at the next step. (g) Same image after 3D masking using the nucleus surface created at step 1. (h) Results of image segmentation: the nucleus, chromocenters (CC) and the nuclear bodies (CP and H3K27me3) were segmented as surface objects (legend, right panel). (i-k) Quantitative analysis of CC and nuclear bodies: volume: (i) distance to the nucleus periphery (j) and overlapping volume ratios (k, left: CC and CP overlap, right: CP and H3K27me3 overlap). Plots were generated using Imaris Vantage. Scale bar: (a-b), 2µm; (f-h), 3 µm.
Figure 5.
Figure 5.
Analysis of the metaphase chromosome ultrastructure using volume measurement of oligo-FISH labeled regions. (a) Overview of the image analysis workflow. (b) 3D-SIM raw image slice from a stack containing 30 slices at widefield resolution. (c) 3D-SIM processed image slice showing increased super-resolution. (d) Display adjustment to optimize the visualization of signals with varying intensities. (e) Segmentation results: the chromosome is segmented using the DAPI channel and the generated 3D surface is used as a mask to specifically retain chromosomal FISH signals and exclude the background. The segmentation is presented sequentially for different FISH probe groups (e1-e3), and the result is shown in the merge (e4). e1, telomere, centromere, and Stork probes; e2, Subtelomeres, Eagle, Rhea and Flamingo probes; e3, 45SrDNA (Nucleolus Organizing Region, NOR), Ostrich and Moa probes. The Oligo-FISH probes label the bottom part of chromosome 5HL. (f) Side view of a 3D movie generated via the ‘Animation‘ tool (Supplemental File 5 – video 1). (g) Volume data are read in the ‘Statistics’Tab for selected surfaces. (h) Data visualization using the ‘Vantage‘ tool for individual objects (top).
Figure 6.
Figure 6.
Analysis of centromere and telomere positioning in the interphase nucleus (continued). (a) Workflow overview showing the main steps to process the 3D image and identify centromeres and telomeres and their position in an interphase nucleus. The workflow is illustrated with seed nuclei from barley (a-f) and leaf nuclei from Limnanthes (g-i). (b) Barley plant, seeds and isolated nuclei stained by FISH for centromere and telomeric repeats (see main text for details). (c) Raw images (3D projections) of type I and type II nuclei showing centromeric (magenta) and telomeric (yellow) FISH probes signals, counterstained for DNA (DAPI, gray). (d) Telomeric (TEL) and centromeric (CEN) signals were segmented as spots. (e) 3D rendering together with nucleus surfaces (gray) following segmentation, whole nuclei (left) or clipped (right), exposing the CEN and TEL signals in the interior of the nucleus. (f) The distribution of telomeres and centromeres is described according to three measurements derived from spot-to-spot or spot-to-surface statistics: shortest distance between centromeres and telomeres (f1), shortest distance of centromeres to the nucleus surface and shortest distance of telomeres to the nucleus surface (f2), inter-centromere and inter-telomere distances computed as the average distance to the nearest 5 neighbor spots of the same category (f3). In blue, schematic representation of the measured distance. Distances were exported and normalized to the nucleus diameter (f1, f3) or nucleus volume (f2) and plotted using the ggplot GUI online tool (https://shiny.gmw.rug.nl/ggplotgui/). The lower and upper hinges of the boxplots correspond to the first and third quartiles of the data, respectively, the black lines within the boxes mark the median. Five to ten nuclei were used for each measurement. Black spots beyond the whiskers represent outliers. (g-j) Illustration of the workflow on a Limnanthes leaf nucleus, (g) Limnanthes floccosa subsp. bellingeriana, (h) Raw image (3D projection) of a nucleus stained for centromeric repeats (magenta), telomeric repeats (cyan) and rDNA repeats (yellow) by FISH, counterstained for DNA (DAPI, gray), imaged by confocal laser scanning microscopy, (i) 3D nucleus following segmentation of FISH signals and DNA as surfaces. (j) Distance of the different segmented groups relative to the nucleus surface were plotted in Imaris Vantage; images showing a distance-coded coloring are shown for centromeres (CEN) and telomeres (TEL).
Figure 7.
Figure 7.
Division angle measurement using surface-rendered cellular structures in living barley root cells. (next page). (a) Workflow overview showing the sequence of tasks to process a raw picture up to the setting of measurement lines within the 3D cell space. (b) Confocal imaging of barley root tissue from a young seedling expressing CFP-H2B marking the chromosomes (cyan) and RFP-CenH3 marking the centromeres (magenta). In addition, cell wall autofluorescence upon UV excitation was used to mark the cell’s boundaries (cyan). The image is a partial projection from a z-stack. (c) 3D cropping of the image to select a region of interest containing a dividing cell in mitotic anaphase (yellow frame). Orthogonal projections are shown in xy, yz and xz. (d) The cropped image is rendered in 3D using the ‘blend’ mode. (e) Surface’ rendering of segmented centromeres (magenta) and the cell wall (cyan). (f) Setting of ‘Measurement points’ and their connective lines. AB defines the axis along which chromosomes are pulled (orthogonal to the chromosome plates), BC defines the cell’s elongation axis. (g) Detailed visualization of the lower metaphase plate and angle formed between both axes defined by AB and BC measurement lines. The angle is measured in 3D by Imaris. Scale bars: b-f, 5 μm; g, 1 μm.

References

    1. Bagheri N, Carpenter AE, Lundberg E, et al. The new era of quantitative cell imaging-challenges and opportunities. Mol Cell. 2022;82:241–247. - PMC - PubMed
    1. Jerkovic I, Cavalli G.. Understanding 3D genome organization by multidisciplinary methods. Nat Rev Mol Cell Biol. 2021;22:511–528. - PubMed
    1. Dumur T, Duncan S, Graumann K, et al. Probing the 3D architecture of the plant nucleus with microscopy approaches: challenges and solutions. Nucleus. 2019;10(1):181–212. - PMC - PubMed
    1. Boettiger A, Murphy S. Advances in chromatin imaging at kilobase-scale resolution. Trends Genet. 2020;36:273–287. - PMC - PubMed
    1. Dar AS, Padha D. Medical image segmentation: a review of recent techniques, advancements and a comprehensive comparison. Int J Comput Sci Eng. 2019;7:114–124.

Publication types