. 2022;55(10):243.
doi: 10.1617/s11527-022-02080-x. Epub 2022 Nov 24.

A long-term study on structural changes in calcium aluminate silicate hydrates

Affiliations

A long-term study on structural changes in calcium aluminate silicate hydrates

Sonya Barzgar et al. Mater Struct. 2022.

Abstract

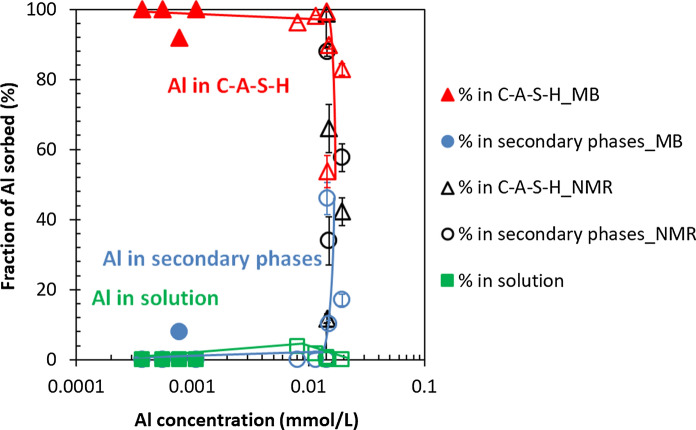
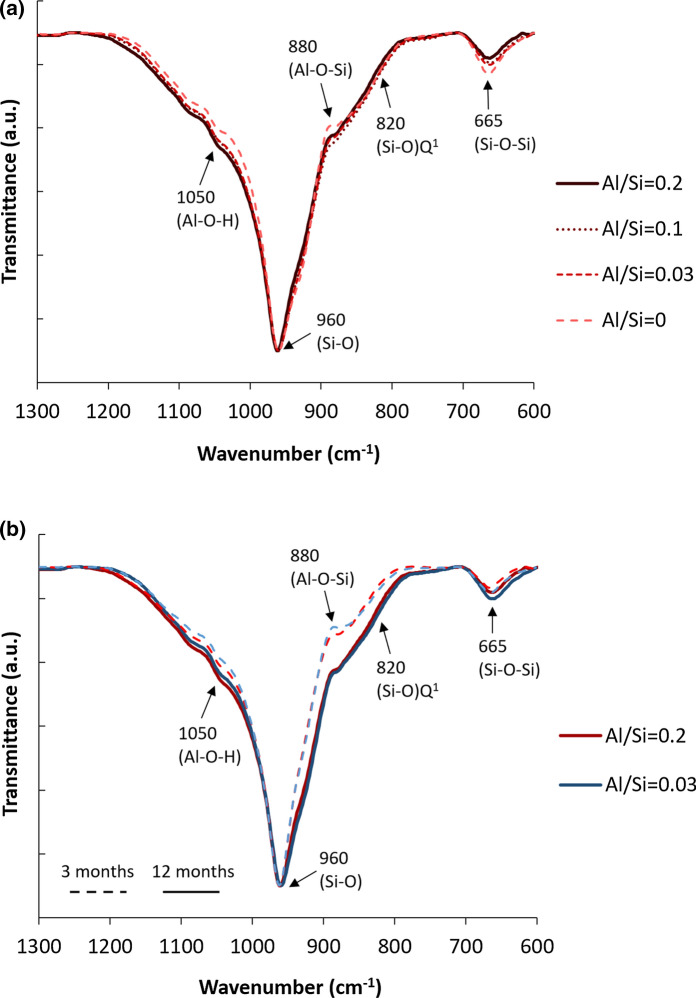
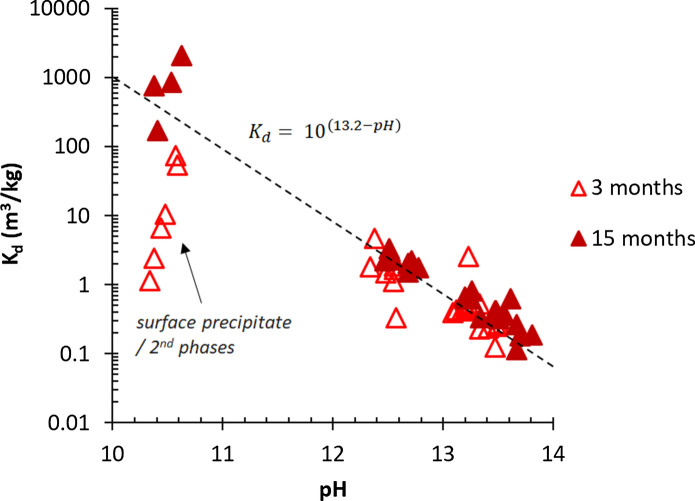
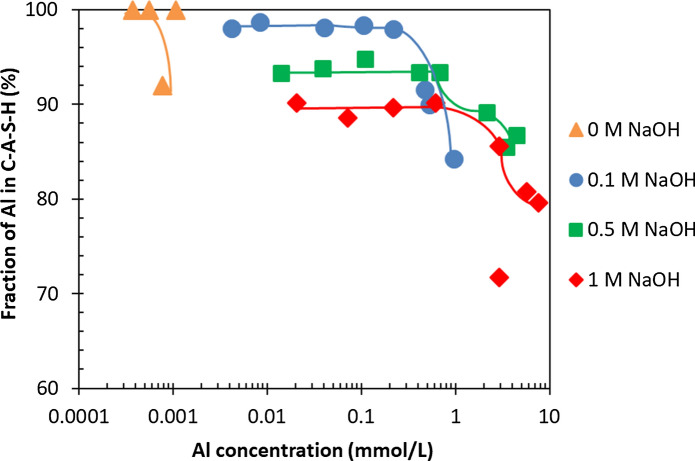
Production of blended cements in which Portland cement is combined with supplementary cementitious materials (SCM) is an effective strategy for reducing the CO2 emissions during cement manufacturing and achieving sustainable concrete production. However, the high Al2O3 and SiO2 contents of SCM change the chemical composition of the main hydration product, calcium aluminate silicate hydrate (C-A-S-H). Herein, spectroscopic and structural data for C-A-S-H gels are reported in a large range of equilibration times from 3 months up to 2 years and Al/Si molar ratios from 0.001 to 0.2. The 27Al MAS NMR spectroscopy and thermogravimetric analysis indicate that in addition to the C-A-S-H phase, secondary phases such as strätlingite, katoite, Al(OH)3 and calcium aluminate hydrate are present at Al/Si ≥ 0.03 limiting the uptake of Al in C-A-S-H. More secondary phases are present at higher Al concentrations; their content decreases with equilibration time while more Al is taken up in the C-A-S-H phase. At low Al contents, Al concentrations decrease strongly with time indicating a slow equilibration, in contrast to high Al contents where a clear change in Al concentrations over time was not observed indicating that the equilibrium has been reached faster. The 27Al NMR studies show that tetrahedrally coordinated Al is incorporated in C-A-S-H and its amount increases with the amount of Al present in the solution.

Supplementary information: The online version contains supplementary material available at 10.1617/s11527-022-02080-x.

Keywords: Aluminum; Blended cement; CO2 emission; C–A–S–H; Equilibration time; NMR.


Conflict of interest statement

Conflict of interestThe authors have no competing interests to declare that are relevant to the content of this article.

Figures

Fig. 1
Fig. 1
The effect of a Al content after 3 months equilibration and b equilibration time on secondary phases' content for target Ca/Si = 0.8 in the absence of NaOH
Fig. 2
Fig. 2
The 27Al MAS NMR spectra of the alkali-free C–A–S–H samples with target Al/Si ratios of 0.01 – 0.2 after equilibration times of 3 months and 2 years. The narrow Al(IV) resonance from strätlingite at 61 ppm is indicated by ‘S’
Fig. 3
Fig. 3
The molar Al/Si in C–A–S–H vs. target Al/Si ratios calculated using mass-balance based on TGA (MB) and 27Al MAS NMR. (The errors for mass-balance calculations are smaller than the symbols' size)
Fig. 4
Fig. 4
The Al fraction in solution, C–A–S–H and secondary phases as a function of the measured Al concentration for target Ca/Si = 0.8 in the absence of NaOH from mass-balance calculations based on TGA (MB) and 27Al MAS NMR results for 3 months (empty symbols) and from mass-balance calculations based on TGA after 12 months (filled symbols) equilibration. (The lines serve as eye-guides only and the errors for mass-balance calculations are smaller than the symbols' size)
Fig. 5
Fig. 5
The FTIR spectra for C–A–S–H samples at target Ca/Si = 0.8 and in the absence of NaOH for a 12 months equilibration with different Al/Si ratios and b different equilibration times with target Al/Si ratios of 0.03 and 0.2
Fig. 6
Fig. 6
29Si MAS NMR spectra (9.39 T, νR = 10.0 kHz) of the alkali-free C–A–S–H samples with target Al/Si ratios of 0.01–0.2 after equilibration times of 3 months and 2 years
Fig. 7
Fig. 7
The effect of a Al content after 3 months equilibration and b equilibration time on secondary phases’ content in the presence of 1 M NaOH for target Ca/Si = 0.8. (The samples at target Al/Si = 0.2 were analyzed after 15 months instead of 12 months)
Fig. 8
Fig. 8
The Al fraction in solution, C–A–S–H and secondary phases vs. measured Al concentration for target Ca/Si = 0.8 in the presence of 1 M NaOH after 3 months (empty symbols) and 15 months (filled symbols) equilibration. (The lines serve as eye-guides only and the errors are smaller than the symbols' size)
Fig. 9
Fig. 9
The FTIR spectra for C–A–S–H samples at target Ca/Si = 0.8 and in the presence of 1 M NaOH for a 15 months equilibration with different Al/Si ratios and b different equilibration times with target Al/Si ratios of 0.03 and 0.2
Fig. 10
Fig. 10
The Al sorption isotherm on C–A–S–H for target Ca/Si = 0.8 recorded after different equilibration times. The 3 months samples are represented by empty symbols and one year samples indicated by filled symbols. The alkali-free samples analyzed with.27Al MAS NMR after 3 months equilibration are indicated with black symbols. The samples at target Al/Si ≥ 0.05 were analyzed after 15 months instead of 1 year. The lines indicate the slope of the increase; slopes ≤ 1 indicate sorption; slopes > 1 indicate precipitation of an additional solid. (The errors for mass-balance calculations are smaller than the symbols' size)
Fig. 11
Fig. 11
The pH dependence of Al sorption on C–A–S–H for target Ca/Si = 0.8. The Kd can be expressed as 10.(13.2−pH) as visualized by the dashed line. (The errors are smaller than the symbols’ size)
Fig. 12
Fig. 12
The Al fraction in C–A–S–H for target Ca/Si = 0.8 in the absence of NaOH and presence of 0.1, 0.5 and 1 M NaOH after 1 year equilibration. Samples at target Al/Si ≥ 0.05 were analyzed after 15 months instead of 1 year. (The errors are smaller than the symbols’ size)
Fig. 13
Fig. 13
The FTIR spectra for C–A–S–H samples in the absence of NaOH and presence of 1 M NaOH for target Ca/Si = 0.8 with target Al/Si ratios of 0.03 and 0.2 after 3 months equilibration. Dashed lines with light colors represent the samples without NaOH and solid lines with dark colors show those with 1 M NaOH

References

    1. Glavind M (2009) Sustainability of cement, concrete and cement replacement materials in construction In: Sustainability of Construction Materials. Woodhead publishing, Cambridge, UK. 10.1533/9781845695842.120
    1. Saleh HM, Eskander SB (2020) Innovative cement-based materials for environmental protection and restoration. In: Samui P, Kim D, Iyer NR, Chaudhary S (eds) New materials in civil engineering, Butterworth-Heinemann, UK, pp 613–641
    1. Thomas M, Barcelo L, Blair B, et al. Lowering the carbon footprint of concrete by reducing clinker content of cement. Transp Res Rec. 2012 doi: 10.3141/2290-13. - DOI
    1. Gartner E. Industrially interesting approaches to “low-CO2” cements. Cem Concr Res. 2004;34:1489–1498. doi: 10.1016/j.cemconres.2004.01.021. - DOI
    1. Monteiro PJM, Miller SA, Horvath A. Towards sustainable concrete. Nat Mater. 2017;16:698–699. doi: 10.1038/nmat4930. - DOI - PubMed

LinkOut - more resources