. 2023 Jan 6;132(1):52-71.
doi: 10.1161/CIRCRESAHA.122.321538. Epub 2022 Nov 30.

TXNIP Suppresses the Osteochondrogenic Switch of Vascular Smooth Muscle Cells in Atherosclerosis

Affiliations

TXNIP Suppresses the Osteochondrogenic Switch of Vascular Smooth Muscle Cells in Atherosclerosis

Sang-Ho Woo et al. Circ Res. .

Abstract

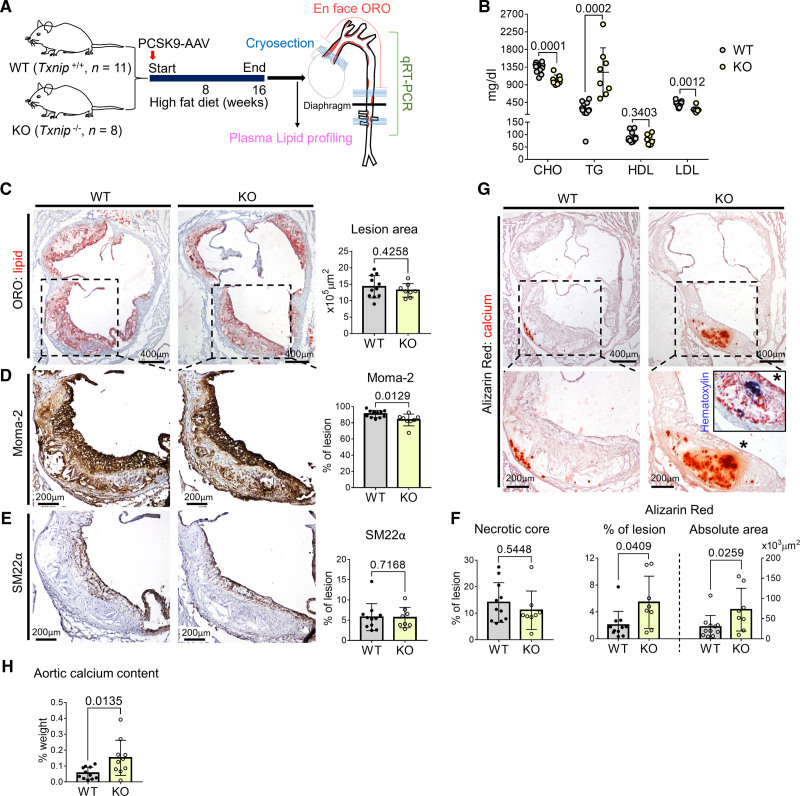
Background: The osteochondrogenic switch of vascular smooth muscle cells (VSMCs) is a pivotal cellular process in atherosclerotic calcification. However, the exact molecular mechanism of the osteochondrogenic transition of VSMCs remains to be elucidated. Here, we explore the regulatory role of TXNIP (thioredoxin-interacting protein) in the phenotypical transitioning of VSMCs toward osteochondrogenic cells responsible for atherosclerotic calcification.

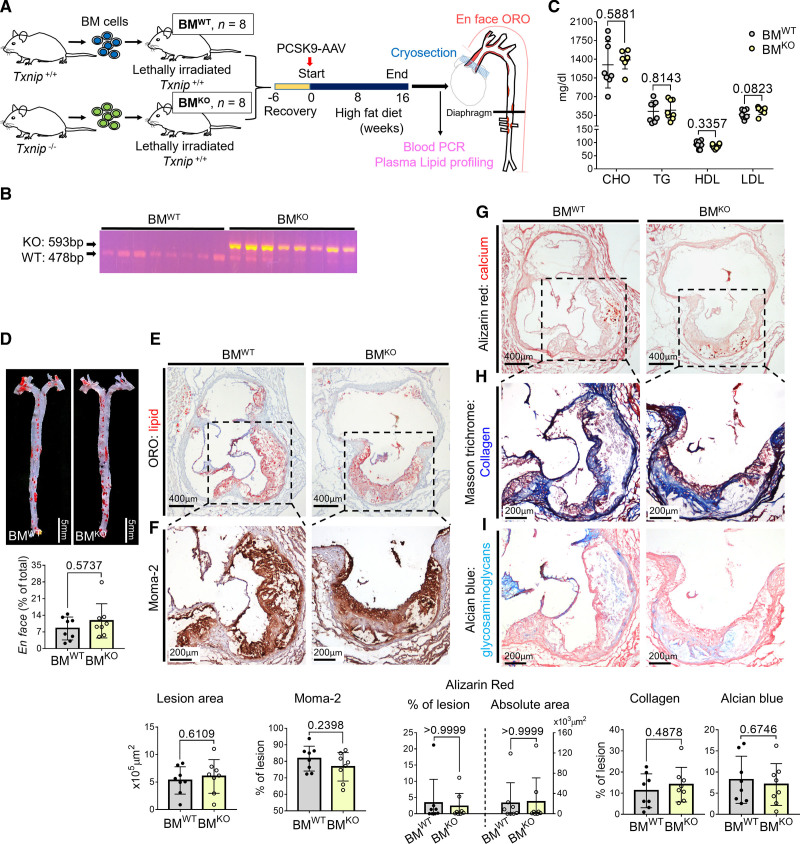
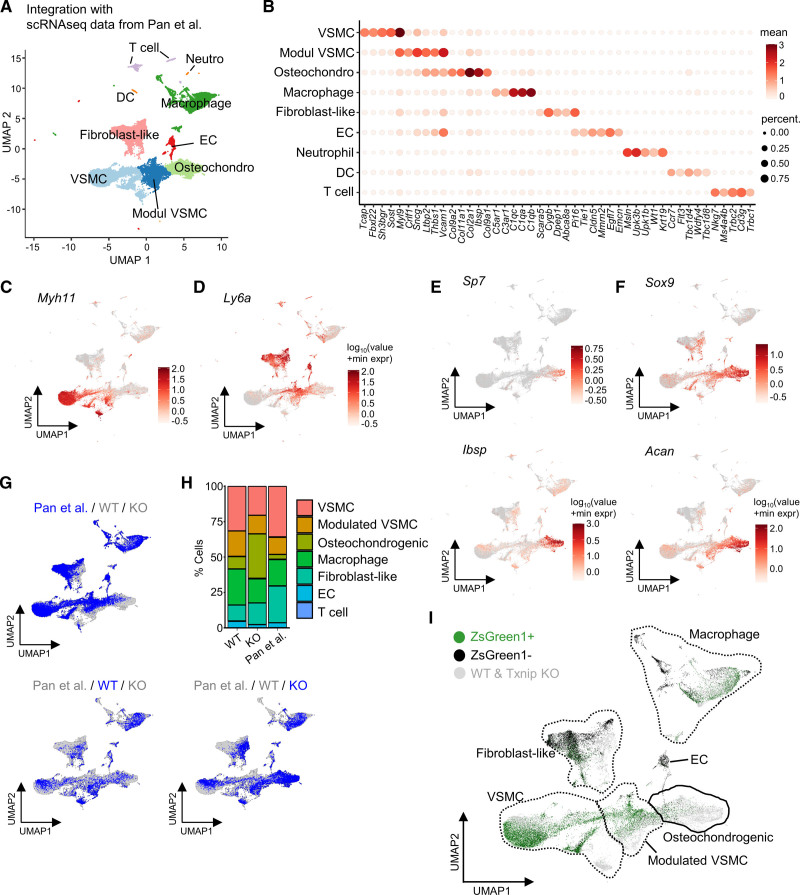
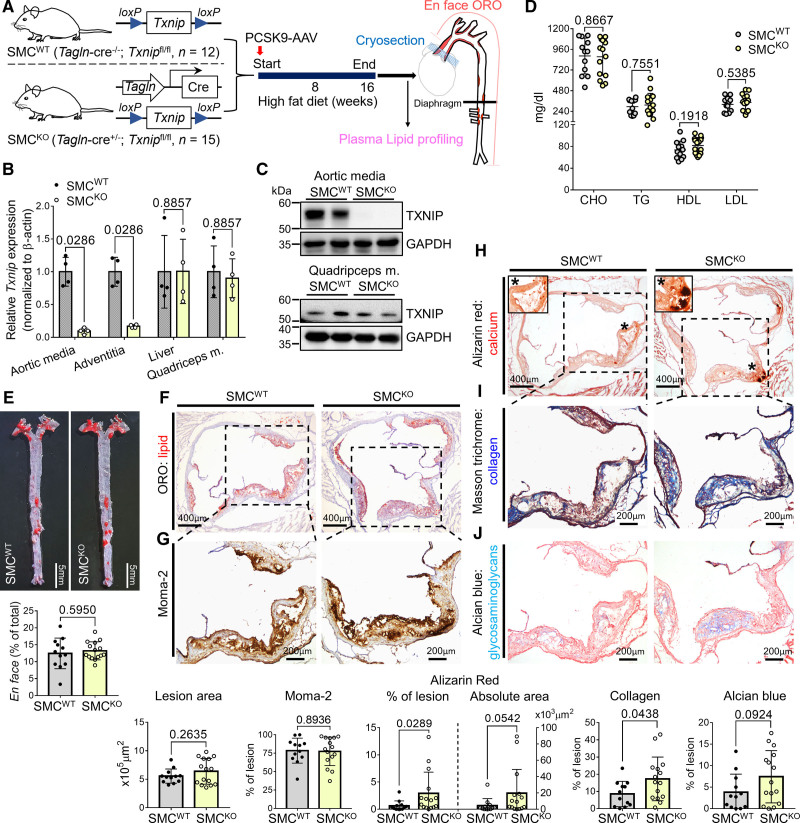
Methods: The atherosclerotic phenotypes of Txnip-/- mice were analyzed in combination with single-cell RNA-sequencing. The atherosclerotic phenotypes of Tagln-Cre; Txnipflox/flox mice (smooth muscle cell-specific Txnip ablation model), and the mice transplanted with the bone marrow of Txnip-/- mice were analyzed. Public single-cell RNA-sequencing dataset (GSE159677) was reanalyzed to define the gene expression of TXNIP in human calcified atherosclerotic plaques. The effect of TXNIP suppression on the osteochondrogenic phenotypic changes in primary aortic VSMCs was analyzed.

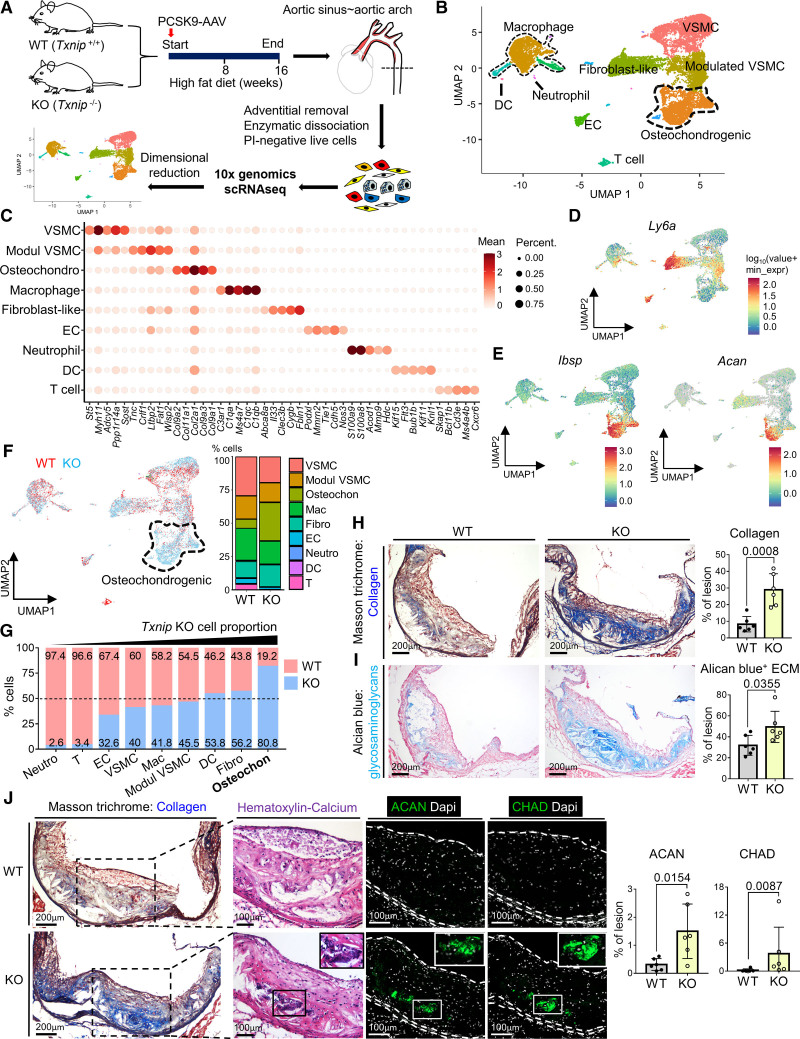
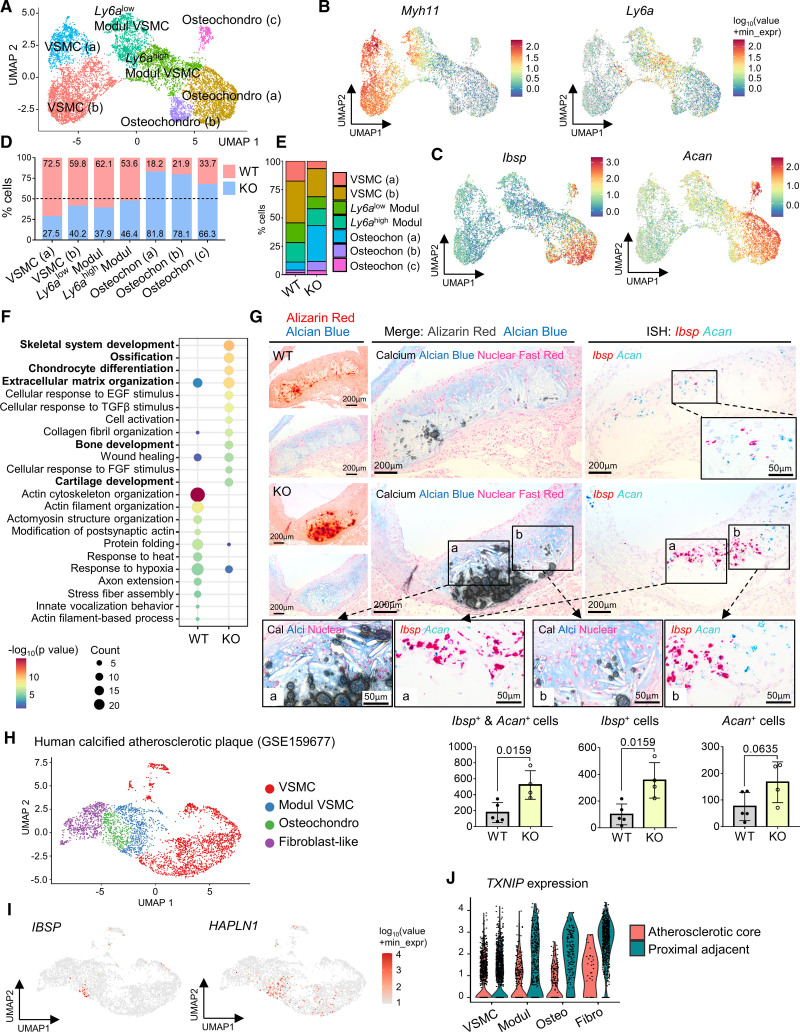
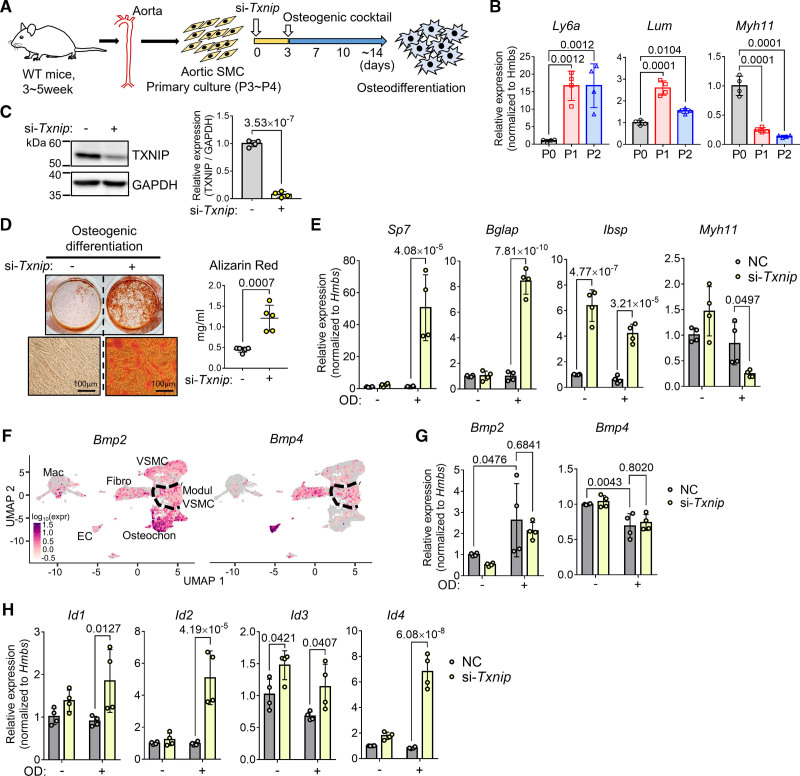
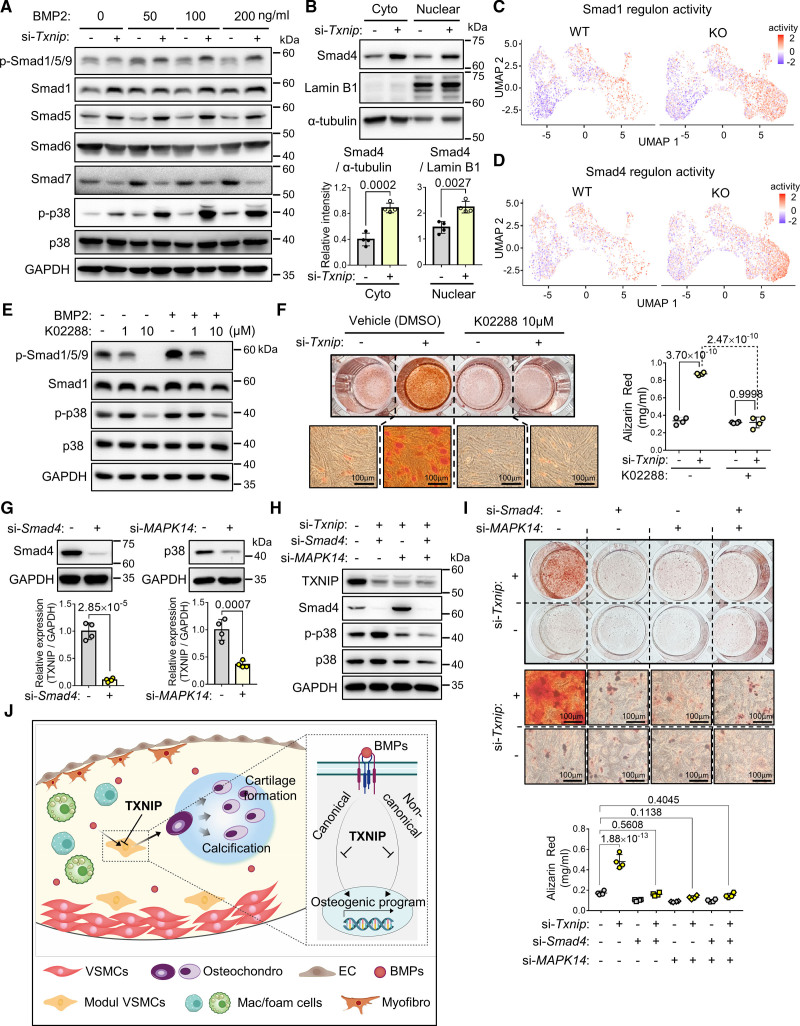
Results: Atherosclerotic lesions of Txnip-/- mice presented significantly increased calcification and deposition of collagen content. Subsequent single-cell RNA-sequencing analysis identified the modulated VSMC and osteochondrogenic clusters, which were VSMC-derived populations. The osteochondrogenic cluster was markedly expanded in Txnip-/- mice. The pathway analysis of the VSMC-derived cells revealed enrichment of bone- and cartilage-formation-related pathways and bone morphogenetic protein signaling in Txnip-/- mice. Reanalyzing public single-cell RNA-sequencing dataset revealed that TXNIP was downregulated in the modulated VSMC and osteochondrogenic clusters of human calcified atherosclerotic lesions. Tagln-Cre; Txnipflox/flox mice recapitulated the calcification and collagen-rich atherosclerotic phenotypes of Txnip-/- mice, whereas the hematopoietic deficiency of TXNIP did not affect the lesion phenotype. Suppression of TXNIP in cultured VSMCs accelerates osteodifferentiation and upregulates bone morphogenetic protein signaling. Treatment with the bone morphogenetic protein signaling inhibitor K02288 abrogated the effect of TXNIP suppression on osteodifferentiation.

Conclusions: Our results suggest that TXNIP is a novel regulator of atherosclerotic calcification by suppressing bone morphogenetic protein signaling to inhibit the transition of VSMCs toward an osteochondrogenic phenotype.

Keywords: TXNIP; atherosclerosis; calcification; osteochondrogenic; vascular smooth muscle cell.


Figures

Figure 1.
Figure 1.
Txnip knockout mice (Txnip KO) have increased atherosclerotic calcification. A, Schematic illustration of the experiment. The mice were injected with PCSK9-AAV (adeno-associated virus serotype 8 encoding mouse proprotein convertase subtilisin/kexin type 9) and fed high fat diet (HFD) for 16 weeks. n=11/8 for wild type (WT)/Txnip KO. B, Plasma concentrations of total cholesterol (CHO), triglyceride (TG), high-density lipoprotein (HDL), and low-density lipoprotein (LDL). C–G, Characterization of atherosclerotic lesions using the 7 μm of perpendicular serial sections (total 70–80 sections) prepared from the aortic sinus. Representative serial sections and quantification results of Oil Red O (ORO) staining (C, for lesion size), Moma-2 immunostaining (D, for monocyte/macrophage), smooth muscle protein 22-α (SM22α) immunostaining (E, for SM22α positive area), necrotic core area (F), and Alizarin red staining (G, for calcium). H, Result of total calcium content measurement. Aortas ranging from the aortic sinus to the aortic arch, which mostly contains advanced plaques expected to be rich in calcification were used. Data are presented as a percentage of dry tissue weight. n=11/10 for WT/Txnip KO. The applied statistical tests and results are summarized in the Table S11. The error bars denote standard deviation. The exact P values are specified. qRT-PCR indicates quantitative reversed transcriptase PCR.
Figure 2.
Figure 2.
Single-cell RNA-sequencing (scRNA-seq) analysis reveals the osteochondrogenic cluster enriched with bone- and cartilage-related genes, which is markedly expanded in Txnip knockout mice (Txnip KO) mice. A, Overall experimental procedure. The atherosclerotic plaques of 4 mice from each wild type (WT) and Txnip KO were pooled. After adventitial removal, the atherosclerotic lesion cells were enzymatically dissociated, and propidium iodide (PI)-negative cells were subjected to scRNA-seq. B, Uniform manifold approximation and projection (UMAP) visualization of integrated WT and Txnip KO scRNA-seq data. C, Top 5 differentially expressed genes (DEG) for each cluster. D and E, Feature plots for Ly6a, osteogenic marker Ibsp, and chondrogenic marker Acan (aggrecan). F, UMAP and cluster-annotated bar charts showing distributions of WT and Txnip KO cell. G, The bar graphs showing the proportions of WT and Txnip KO for each cluster. H and I, Representative serial sections and quantification results of Masson trichrome staining (H, for collagen), Alcian blue (I, for glycosaminoglycan extracellular matrix [ECM]) on the aortic sinus of WT and Txnip KO. n=6/6 for WT/Txnip KO. J, Representative serial section images showing the Masson trichrome staining, Hematoxylin and Eosin (H&E) staining, and immunostaining of the ACAN and CHAD (chondroadherin) on the aortic sinus sections of WT and Txnip KO. Masson trichrome staining, ACAN, and CHAD immunostainings are sequentially performed on 7 um of serial cryosections. H&E staining was performed on the CHAD-stained slides by removing the coverslips. ACAN and CHAD-positive areas were quantified (n=6/6 for WT/Txnip KO). The applied statistical tests and results are summarized in the Table S11. The error bars denote standard deviation. The exact P values are specified. Dapi indicates 4’‚6-diamidino-2-phenylindole; DC, dendritic cells; EC, endothelial cells; and Modul VSMC, modulated vascular smooth muscle cells.
Figure 3.
Figure 3.
Hematopoietic deficiency of TXNIP (thioredoxin-interacting protein) does not affect the lesion phenotype. A, Schematic illustration of the experiment. Bone marrow (BM) cells of wild type (WT) or Txnip knockout mice (Txnip KO) were transplanted into WT mice. After 6 weeks of recovery, the mice were injected with PCSK9-AAV and fed HFD for 16 weeks. n=8/8 for bone marrow cells of wild type mice (BMWT)/ bone marrow cells of Txnip KO mice (BMKO). B, Blood PCR result indicating the successful transfusion of the WT and Txnip KO BM cells. C, The plasma concentrations of total cholesterol (CHO), triglyceride (TG), high-density lipoprotein (HDL), and low-density lipoprotein (LDL). D, Comparison of the Oil Red O (ORO)-positive areas between BMWT and BMKO on en-face aorta. E–I, Characterization of atherosclerotic lesions using the 7 μm of perpendicular serial sections (total 70–80 sections) prepared from the aortic sinus. Representative serial sections and quantification results of Oil Red O (ORO) staining (E, for lesion size), Moma-2 immunostaining (F, for monocyte/macrophage), Alizarin red staining (G, for calcium), Masson trichrome staining (H, for collagen), Alcian blue (I, for glycosaminoglycan ECM). The applied statistical tests and results are summarized in the Table S11. The error bars denote standard deviation. The exact P values are specified.
Figure 4.
Figure 4.
Integration of the single-cell RNA-sequencing (scRNA-seq) data reveals the modulated vascular smooth muscle cell (VSMC) and osteochondrogenic clusters are primarily originated from VSMCs. Pan et al conducted scRNA-seq of atherosclerotic lesions using ZsGreen1-lineage traced smooth muscle cell (SMC) (ROSA26ZsGreen1/+; Ldlr−/−; Myh11-CreERT2). A, Uniform manifold approximation and projection (UMAP) visualization of 2 integrated scRNA-seq datasets. B, Heatmap showing the top 5 differentially expressed genes (DEG) for each cluster. C and D, Feature plots for Myh11 and Ly6a. E and F, Feature plots for representative osteogenic genes Sp7 and Ibsp, and chondrogenic genes Sox9 and Acan. G, Separate visualization of Pan et al, wild type (WT), and Txnip knockout mice (Txnip KO) cells on UMAPs. H, Bar charts showing proportions of each clusters of Pan et al, WT, and Txnip KO. I, ZsGreen1 fluorescence-positive and -negative cells are shown on UMAP. DC indicates dendritic cells; and EC‚ endothelial cells.
Figure 5.
Figure 5.
Analyzing vascular smooth muscle cell (VSMC)-derived cell clusters reveals the enhancement of bone and cartilage formation pathways in Txnip knockout mice (Txnip KO) mice, and the downregulation of TXNIP (thioredoxin-interacting protein) in human calcified atherosclerotic plaques. A, Uniform manifold approximation and projection (UMAP) of sub-clustered VSMC-derived cells. Modul, modulated. B and C, Feature plots for Myh11, Ly6a, Ibsp, and Acan. D and E, Bar graphs showing the proportions of wild type (WT) and Txnip KO mice for each cluster. F, Results of gene ontology pathway analysis using differentially expressed genes (DEG) of VSMC-derived cells from WT and Txnip KO.G, Characterizing osteogenic and chondrogenic populations. Alizarin Red and Alcian Blue staining were sequentially performed on the same sections (see Supplemental Methods). Double in situ hybridizations of Ibsp and Acan were performed on the 3-μm adjacent serial sections. Alizarin Red signals were converted to grayish-scale and superimposed on the Alcian Blue sections using Photoshop software (see Supplemental Methods). n=5/4 for WT/Txnip KO. H–J, Downregulation of TXNIP in the modulated VSMCs and osteochondrogenic cells of human calcified atherosclerotic plaques. Alsaigh et al (GSE159677) conducted single-cell RNA-sequencing (scRNA-seq) on the atherosclerotic core portion (AC) of endarterectomized type VII calcified plaques matched with the proximal adjacent regions (PA). VSMC cluster (MYH11 and ACTA2 positive cluster) of GSE159677 was reanalyzed. H, UMAP showing reprocessed VSMC cluster. I, Feature plots for IBSP (osteogenic) and HAPLN1 (chondrogenic). J, Violin plots showing the expressions of TXNIP. The applied statistical tests and results are summarized in the Table S11. The error bars denote standard deviation. The exact P values are specified. EGF indicates epidermal growth factor; FGF, fibroblast growth factor; ISH, in situ hybridization; Modul, modulated; and TGFβ, transforming growth factor β.
Figure 6.
Figure 6.
Vascular smooth muscle cell (VSMC)-specific Txnip (thioredoxin-interacting protein) ablation recapitulates the calcification-rich plaque phenotype of whole-body Txnip knockout mice (Txnip KO) mice. A, Schematic illustration of the experiment. Tagln-cre; Txnipflox/flox (SMCKO) mice and their littermate controls that did not have Tagln-cre (SMCWT) were subjected to atherosclerosis. The mice were injected with PCSK9-AAV (adeno-associated virus serotype 8 encoding mouse proprotein convertase subtilisin/kexin type 9) and fed high fat diet (HFD) for 16 weeks. n of SMCWT/SMCKO mice=12/15. B and C, Validation of SMC-specific ablation of Txnip. B, qRT-PCR data showing Txnip mRNA expression in the aortic media, adventitia, liver, and quadriceps muscle (n=4 mice for both groups). Txnip expression was normalized to that of β-actin. C, Western blot showing TXNIP level in the aortic media and quadriceps muscle. The representative blot images of 2 mice per group (a total of 4 mice per group were analyzed). D, The plasma concentrations of the total cholesterol (CHO)‚ triglyceride (TG)‚ high-density lipoprotein (HDL)‚ and low-density lipoprotein (LDL). E, Comparison of the Oil Red O (ORO)-positive areas between SMCWT and SMCKO on en-face aorta. F–J, Characterization of atherosclerotic lesions using the 7 μm of perpendicular serial sections (total 70–80 sections) prepared from the aortic sinus. Representative serial sections and quantification results of ORO staining (F, for lesion size), Moma-2 immunostaining (G, for monocyte/macrophage), Alizarin red staining (H, for calcium), Masson trichrome staining (I, for collagen), Alcian Blue (J, for glycosaminoglycan ECM). The applied statistical tests and results are summarized in the Table S11. The error bars denote standard deviation. The exact P values are specified.
Figure 7.
Figure 7.
Txnip (thioredoxin-interacting protein) knockdown in vascular smooth muscle cells (VSMC) accelerates osteodifferentiation and augments BMP (bone morphogenetic protein) signaling. A, Schematic illustration of the experiment. The pooled VSMCs from 2 to 3 wild type (WT) mice constituted 1 biological replicate. Cultured VSMCs were treated with negative control (NC) siRNA or Txnip siRNA (si-Txnip) and were subjected to osteodifferentiation by osteogenic cocktail (β-glycerophosphate, L-ascorbic acid, and H2O2) incubation. B, qRT-PCR results showing the changes in gene expressions of Ly6a and Lum (upregulated in the modulated VSMC cluster), and the Myh11 (contractile gene; VSMC marker) along the culture passages. n=4. C, Western blot confirming knockdown of TXNIP by si-Txnip. TXNIP expression was normalized to glyceraldehyde 3-phosphate dehydrogenase (GAPDH) for quantification. n=4. D, Alizarin Red staining results of osteodifferentiation (end point). The staining was quantified by cetylpyridinium chloride extraction. n=5. E, qRT-PCR results showing the expressions of Sp7, Bglap, Ibsp (which are the osteochondrogenic marker genes), and Myh11 (which is a contractile gene; VSMC marker) in the NC and si-Txnip treated VSMCs with or without osteodifferentiation. n=4. F, Feature plots showing Bmp2 and Bmp4 expression in WT and Txnip knockout mice (Txnip KO) single-cell RNA-sequencing (scRNA-seq) data. G, qRT-PCR results showing the expressions of Bmp2 and Bmp4 in the NC and si-Txnip treated VSMCs with or without osteodifferentiation. n=4. H, qRT-PCR results showing the mRNA expressions of inhibitor of DNA binding (Id) proteins, which are transcribed by BMP as a crucial target of BMP signaling. n=4. E, G, and H, Hmbs was used as a housekeeping gene for qRT-PCR. The applied statistical tests and results are summarized in Table S11. The error bars denote standard deviation. The exact P values are specified. EC indicates endothelial cell; Fibro, fibroblast-like; Mac, macrophage; Modul, modulated; OD, osteodifferentiation; Osteochon, osteochondrogenic; and P, passage.
Figure 8.
Figure 8.
Txnip (thioredoxin-interacting protein) knockdown in vascular smooth muscle cells (VSMC) upregulates both canonical and noncanonical BMP (bone morphogenetic protein) signaling leading to osteodifferentiation. A, Western blot showing canonical and noncanonical BMP signaling upon si-Txnip treatment. The results at 16 hours after BMP treatment. The representative images for n=4. B, Western blot showing cytoplasmic and nuclear fractions of Smad4 upon Txnip siRNA treatment. α-tubulin and Lamin B1 were used as the loading controls for the cytoplasmic and nuclear fractions, respectively. n=4. C and D, Feature plots showing the regulon activities of Smad1 and Smad4 in VSMC-derived cells of wild type (WT) and Txnip knockout mice (Txnip KO). E, Western blot showing the validation result of determining the concentration of the BMP signaling inhibitor K02288. Representative images of n=2. F, Alizarin Red staining results showing abrogation of the effect of Txnip knockdown on osteodifferentiation. In total, 10 μM of K02288 was treated in advance of siRNA transfection, and was added to the osteogenic cocktail for every medium replacement. The staining was quantified by cetylpyridinium chloride extraction. n=4. G, Western blot confirming knockdown of Smad4 and p38 by si-Smad4 and si-MAPK14, respectively. Expressions were normalized to glyceraldehyde 3-phosphate dehydrogenase (GAPDH) for quantification. n=4. H, Western blot showing efficacy validation of si-TXNIP, si-Smad4, and si-MAPK14 when used in combination, and the reduction of p-p38 by si-MAPK14. Representative images of n=2. I, Alizarin Red staining results showing the abrogation of the effect of Txnip knockdown on osteodifferentiation by blocking either the canonical (si-Smad4) or noncanonical (si-MAPK14) BMP signaling pathway. Cetylpyridinium chloride extraction quantification. n=4. The applied statistical tests and results are summarized in Table S11. The error bars denote standard deviation. The exact P values are specified.

References

    1. Bentzon JF, Otsuka F, Virmani R, Falk E. Mechanisms of plaque formation and rupture. Circ Res. 2014;114:1852–1866. doi: 10.1161/CIRCRESAHA.114.302721 - PubMed
    1. Libby P. The changing landscape of atherosclerosis. Nature. 2021;592:524–533. doi: 10.1038/s41586-021-03392-8 - PubMed
    1. Alexopoulos N, Raggi P. Calcification in atherosclerosis. Nat Rev Cardiol. 2009;6:681–688. doi: 10.1038/nrcardio.2009.165 - PubMed
    1. Greenland P, Bonow RO, Brundage BH, Budoff MJ, Eisenberg MJ, Grundy SM, Lauer MS, Post WS, Raggi P, Redberg RF, et al. . ACCF/AHA 2007 clinical expert consensus document on coronary artery calcium scoring by computed tomography in global cardiovascular risk assessment and in evaluation of patients with chest pain: a report of the American College of Cardiology Foundation Clinical Expert Consensus Task Force (ACCF/AHA writing committee to update the 2000 Expert consensus document on electron beam computed tomography) developed in collaboration with the society of atherosclerosis imaging and prevention and the society of cardiovascular computed tomography. J Am Coll Cardiol. 2007;49:378–402. doi: 10.1016/j.jacc.2006.10.001 - PubMed
    1. Virmani R, Kolodgie FD, Burke AP, Farb A, Schwartz SM. Lessons from sudden coronary death: a comprehensive morphological classification scheme for atherosclerotic lesions. Arterioscler Thromb Vasc Biol. 2000;20:1262–1275. doi: 10.1161/01.atv.20.5.1262 - PubMed

Publication types