. 2023 Feb 12;191(2):1138-1152.
doi: 10.1093/plphys/kiac533.

FER and LecRK show haplotype-dependent cold-responsiveness and mediate freezing tolerance in Lotus japonicus

Affiliations

FER and LecRK show haplotype-dependent cold-responsiveness and mediate freezing tolerance in Lotus japonicus

Yusdar Mustamin et al. Plant Physiol. .

Abstract

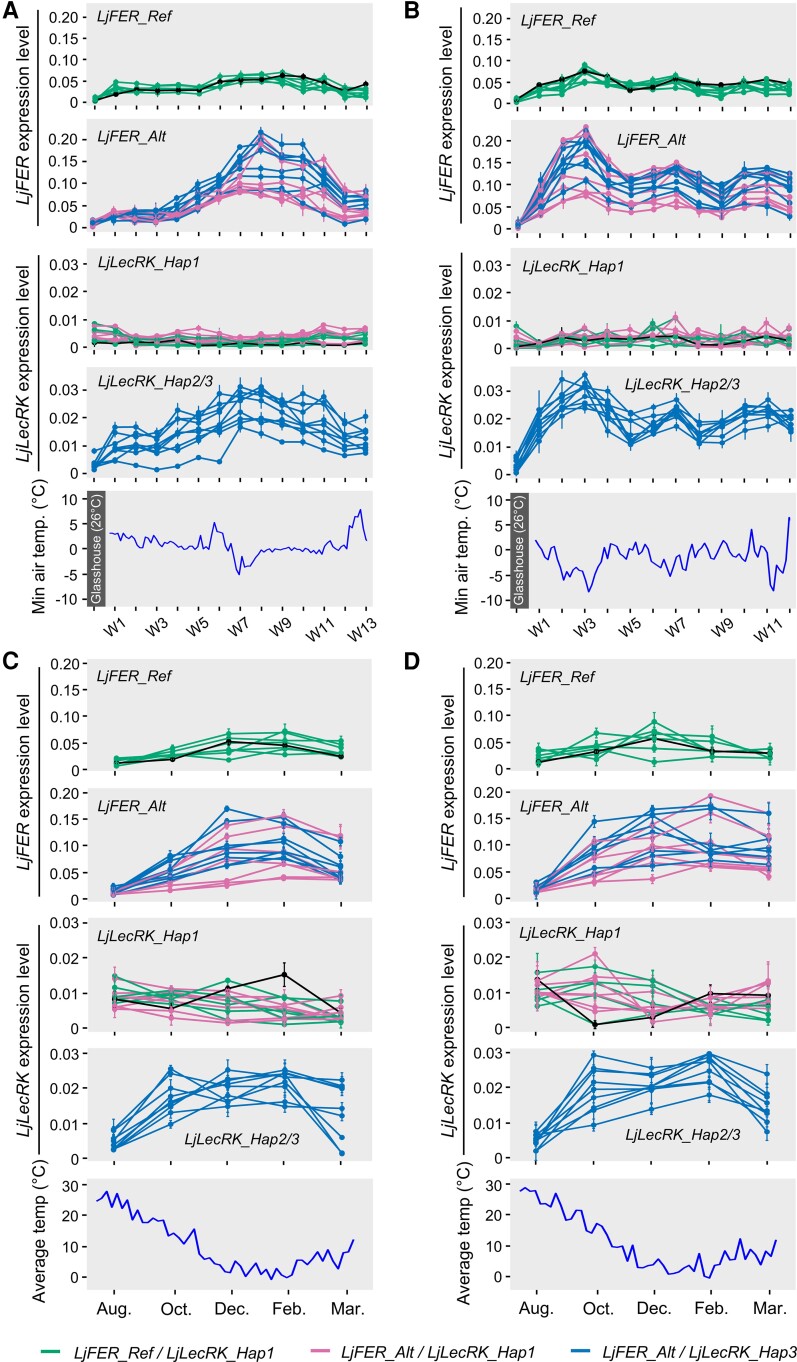
Many plant species have succeeded in colonizing a wide range of diverse climates through local adaptation, but the underlying molecular genetics remain obscure. We previously found that winter survival was a direct target of selection during colonization of Japan by the perennial legume Lotus japonicus and identified associated candidate genes. Here, we show that two of these, FERONIA-receptor like kinase (LjFER) and a S-receptor-like kinase gene (LjLecRK), are required for non-acclimated freezing tolerance and show haplotype-dependent cold-responsive expression. Our work suggests that recruiting a conserved growth regulator gene, FER, and a receptor-like kinase gene, LecRK, into the set of cold-responsive genes has contributed to freezing tolerance and local climate adaptation in L. japonicus, offering functional genetic insight into perennial herb evolution.


Conflict of interest statement

Conflict of interest statement. None declared.

Figures

Figure 1
Figure 1
Winter-survival candidate genes. A, The Manhattan plot of a GWA scan for winter survival in 2014 at the Tohoku field site. LjFER and LjLecRK SNPs are highlighted (red dots). B, Origins of the 12 accessions selected for seasonal transcriptional profiling. Pie charts indicate their pop3 membership (dark gray slice). Their Northern latitude and Pop3 membership (Pop3) binary classification in the logistic regression analysis are indicated. C, LjFER haplotype distribution. D, LjLecRK haplotype distribution. Red letters indicate differences with respect to the Gifu haplotype (Ref or Hap1). E and F, Winter survival in 2014 for accessions split by the LjFER and LjLecRK haplotypes or haplotype combinations indicated. The bottom and top of the boxes are the first and third quartiles, respectively, the middle line is the median, the whiskers are the most extreme values with 1.5× interquartile range below or above the first and third quartiles, and the remaining outlier data points are shown as individual dots (one-way ANOVA with post hoc Tukey's test: ns, no significant (P > 0.05), *P < 0.05, **P < 0.01, ***P < 0.001).
Figure 2
Figure 2
Glasshouse experiment with outdoor winter challenge. A, Origins and LjFER/LjLecRK haplotypes of the 23 accessions selected for the glasshouse experiments. B and C, Accession recovery rate and outdoor air temperature winter 2019/2020 (B) and 2020/2021 (C). The period of the outdoor challenge is indicated at the bottom of the upper panel. For example W1-4 indicates that the plants were exposed to outdoor winter conditions in Weeks 1 through 4 in 2021. Survival rates were determined after 2 weeks of recovery inside the glasshouse following the outdoor exposure. The x-axis on the lower panels indicates the week number in which the temperature was measured. (n = 13–16). D, Boxplots showing recovery rate grouped by LjLecRK and LjFER haplotypes. Each dot represents the recovery rate when the temperature minimum occurred (W7–W12 in winter 2019/2020 and W1–W6 in winter 2020/2021). The bottom and top of the boxes are the first and third quartiles, respectively, the middle line is the median, the whiskers are the most extreme values with 1.5× interquartile range below or above the first and third quartiles, and the remaining outlier data points are shown as individual dots (paired Student's t test: ns, no significant, ****P < 0.0001). Data points from Gifu are highlighted in black.
Figure 3
Figure 3
fer and lecrk LORE1 mutants. A, LORE1 insertion sites in LjFER (fer-1) and LjLecRK (lecrk-1, -2, -3). B, Final recovery rates, and (C) the phenotypes of the indicated genotypes in the 2019/2020 glasshouse with outdoor exposure experiment (n = 14 each). D and E, LjFER (D) and LjLecRK (E) induction by cold treatment in Week-1 (W1) and Week-3 (W3) of winter 2020/2021 experiment (Exp-1). The gene expression bars indicate the mean value ± Sd of six biological replicates combined with three technical replicates (paired Student's t test: ns, no significant, **P < 0.01, ****P < 0.0001). Additional experimental replicates are shown in Supplemental Figure 6.
Figure 4
Figure 4
Temperature- and haplotype-dependent LjFER and LjLecRK expression patterns. A and B, Gene expression during winter 2019/2020 (A) and winter 2020/2021 (B). Leaf samples were collected 1 week after initiation of outdoor exposure. Glasshouse indicates the sample collected prior to outdoor exposure. C and D, Gene expression levels observed in samples from the Tohoku field site for first year plants (C) and second year plants (D) at five sampling times across the growth season. The leaf samples from first and second year plants were collected from the same plant growing for two consecutive years. Data are presented as mean ± Sd of three biological replicates with three technical replicates. The graphs are colored by LjFER/LjLecRK haplotype combinations. Gifu data in LjFER_Ref and LjLecRK_Hap1 are highlighted in black lines. Graphs colored by accession identities are found in Supplemental Figures 11 and 12.
Figure 5
Figure 5
Single freezing temperature exposure. A and B, Gene expression trends of LjFER (A) and LjLecRK (B) before (BT), and after 1, 3, and 5 days of freezing (−4°C) exposure. The accessions were grouped and colored based on their haplotypes. For each group, the accessions were ordered by the latitude of their geographical origin, indicated by a dark (northern) to light (southern) red or blue gradient. The expression bars indicate the mean values ± Sd of three biological replicates combined with three technical replicates. C and D, Boxplots showing the LjFER (C) and LjLecRK (D) gene expression grouped by haplotype. Each dot represents the gene expression level of three biological replicates after 3 days of exposure. Black dots represent the northern accessions and white dots represents southern accessions, with MG008 selected as the lower border for northern accessions. The bottom and top of the boxes are the first and third quartiles, respectively, the middle line is the median, the whiskers are the most extreme values with 1.5× interquartile range below or above the first and third quartiles, and the remaining outlier data points are shown as individual dots (one-way ANOVA with post hoc Tukey's test: ****P < 0.0001). E and F, Scatter plots of LjFER (E) and LjLecRK (F) expression level versus accession geographical origin latitude. Red dots represent the LjFER_Ref and LjLecRK_Hap1 and blue dots represent LjFER_Alt and LjLecRK_Hap2/3. G and H, LjFER (G) and LjLecRK (H) induction by freezing exposure. fer-1_N.I indicates a sibling line to fer-1, which does not carry an insertion in FER. The expression bars indicate the mean values ± Sd of six biological replicates combined with three technical replicates. Different letters indicates significant differences by one-way ANOVA with post hoc Tukey's test.

References

    1. Alonso-Blanco C, Gomez-Mena C, Llorente F, Koornneef M, Salinas J, Martínez-Zapater JM (2005) Genetic and molecular analyses of natural variation indicate CBF2 as a candidate gene for underlying a freezing tolerance quantitative trait locus in Arabidopsis. Plant Physiol 139(3): 1304–1312 - PMC - PubMed
    1. Atwell S, Huang YS, Vilhjálmsson BJ, Willems G, Horton M, Li Y, Meng D, Platt A, Tarone AM, Hu TT, et al. (2010) Genome-wide association study of 107 phenotypes in Arabidopsis thaliana inbred lines. Nature 465(7298): 627–631 - PMC - PubMed
    1. Barah P, Jayavelu ND, Rasmussen S, Nielsen HB, Mundy J, Bones AM (2013) Genome-scale cold stress response regulatory networks in ten Arabidopsis thaliana ecotypes. BMC Genomics 14(1): 722. - PMC - PubMed
    1. Browning BL, Zhou Y, Browning SR (2018) A one-penny imputed genome from next-generation reference panels. Am J Hum Genet 103(3): 338–348 - PMC - PubMed
    1. Chen J, Yu F, Liu Y, Du C, Li X, Zhu S, Wang X, Lan W, Rodriguez PL, Liu X, et al. (2016) FERONIA Interacts with ABI2-type phosphatases to facilitate signaling cross-talk between abscisic acid and RALF peptide in Arabidopsis. Proc Natl Acad Sci USA 113(37): E5519–E5527 - PMC - PubMed

Publication types