. 2022 Dec 14;14(49):54458-54477.
doi: 10.1021/acsami.2c13868. Epub 2022 Nov 30.

Development and Characterization of Bioinspired Lipid Raft Nanovesicles for Therapeutic Applications

Affiliations

Development and Characterization of Bioinspired Lipid Raft Nanovesicles for Therapeutic Applications

Lalithasri Ramasubramanian et al. ACS Appl Mater Interfaces. .

Abstract

Lipid rafts are highly ordered regions of the plasma membrane enriched in signaling proteins and lipids. Their biological potential is realized in exosomes, a subclass of extracellular vesicles (EVs) that originate from the lipid raft domains. Previous studies have shown that EVs derived from human placental mesenchymal stromal cells (PMSCs) possess strong neuroprotective and angiogenic properties. However, clinical translation of EVs is challenged by very low, impure, and heterogeneous yields. Therefore, in this study, lipid rafts are validated as a functional biomaterial that can recapitulate the exosomal membrane and then be synthesized into biomimetic nanovesicles. Lipidomic and proteomic analyses show that lipid raft isolates retain functional lipids and proteins comparable to PMSC-EV membranes. PMSC-derived lipid raft nanovesicles (LRNVs) are then synthesized at high yields using a facile, extrusion-based methodology. Evaluation of biological properties reveals that LRNVs can promote neurogenesis and angiogenesis through modulation of lipid raft-dependent signaling pathways. A proof-of-concept methodology further shows that LRNVs could be loaded with proteins or other bioactive cargo for greater disease-specific functionalities, thus presenting a novel type of biomimetic nanovesicles that can be leveraged as targeted therapeutics for regenerative medicine.

Keywords: angiogenesis; drug delivery; extracellular vesicles; lipid rafts; neuroregeneration.


Conflict of interest statement

The authors declare no competing financial interest.

Figures

Figure 1
Figure 1
Isolation and characterization of PMSC lipid rafts and LRNVs. (A) Overall schematic of lipid raft isolation and synthesis of LRNVs. (B) Representative image of OptiPrep gradient ultracentrifugation. Box highlights the collection of lipid raft fragments at the 20–30% fraction. (C) Dot plot analysis of caveolin-1 (cav-1), GRASP55, and HSP60 expression at different fractions (1 at 0%, 10 at 35%) of the gradient. (D) Five micrograms of whole cell lysates and lipid raft isolates from the same cell line was resolved by SDS-PAGE, and proteins were visualized using Imperial Protein gel stain. (E) Representative Western blot of whole cell lysates and lipid raft isolates probed for common EV markers (ALIX, TSG101, CD9, CD63), lipid raft marker cav-1, and mitochondrial marker HSP60 as the negative control.
Figure 2
Figure 2
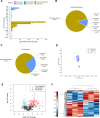
Lipidomic analysis of PMSC-derived EVs and lipid rafts using LC-MS/MS. (A) A total of 490 unique lipid molecules divided into six lipid classes were identified in both EV and lipid raft samples. The lipid composition of (B) lipid rafts and (C) EVs were compared based on the normalized abundance of lipids in each lipid class. (D) First and second principal component scores for lipid ions detected in whole cell lysates (n = 1 cell line), EVs (n = 3 cell lines), and lipid rafts (n = 3 cell lines). Shapes represent the cluster membership at a 95% confidence interval. (E) The volcano plot depicts the 207 differentially expressed lipids in lipid rafts compared to EVs, defined as p-value < 0.05 (Student’s t-test) and a fold change >1.5. (F) Hierarchical cluster analysis with Euclidean distance measurement was used to generate a heatmap of distinct clusters of enriched lipid molecules in EVs or lipid rafts. (G) Differentially expressed lipid species in lipid raft samples compared to EVs were quantified by log 2(Fold Change), and the top 20 upregulated and downregulated lipid species are shown. The complete list of differentially expressed lipid (DEL) species can be found in the Supporting Information. Major types of differentially expressed lipids include (H) sphingomyelin and (I) phosphatidylcholine. *** p < 0.001 by Student’s t-test.
Figure 2
Figure 2
Lipidomic analysis of PMSC-derived EVs and lipid rafts using LC-MS/MS. (A) A total of 490 unique lipid molecules divided into six lipid classes were identified in both EV and lipid raft samples. The lipid composition of (B) lipid rafts and (C) EVs were compared based on the normalized abundance of lipids in each lipid class. (D) First and second principal component scores for lipid ions detected in whole cell lysates (n = 1 cell line), EVs (n = 3 cell lines), and lipid rafts (n = 3 cell lines). Shapes represent the cluster membership at a 95% confidence interval. (E) The volcano plot depicts the 207 differentially expressed lipids in lipid rafts compared to EVs, defined as p-value < 0.05 (Student’s t-test) and a fold change >1.5. (F) Hierarchical cluster analysis with Euclidean distance measurement was used to generate a heatmap of distinct clusters of enriched lipid molecules in EVs or lipid rafts. (G) Differentially expressed lipid species in lipid raft samples compared to EVs were quantified by log 2(Fold Change), and the top 20 upregulated and downregulated lipid species are shown. The complete list of differentially expressed lipid (DEL) species can be found in the Supporting Information. Major types of differentially expressed lipids include (H) sphingomyelin and (I) phosphatidylcholine. *** p < 0.001 by Student’s t-test.
Figure 3
Figure 3
Proteomic analysis of PMSC-derived lipid rafts. Number of common proteins was compared between (A) whole cell lysates, EVs, and lipid rafts from the same line and (B) between lipid raft samples from three different cell lines. (C) The 6168 conserved proteins in lipid rafts from all donors were analyzed for vital structural and signaling proteins. Gene ontology searches for (D) biological processes, (E) cellular components, (F) molecular functions, and (G) KEGG pathway analysis were conducted using FunRich software and DAVID.
Figure 4
Figure 4
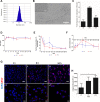
Lipid rafts were extruded through polycarbonate membranes to generate LRNVs. (A) NTA measurements of LRNV size (diameter). (B) Representative cryoEM image of LRNV particles; scale bar: 100 nm. Inset showing higher resolution image of a single LRNV particle; scale bar: 50 nm. (C) Following synthesis, LRNVs were probed for surface expressions of tetraspanins CD9, CD63, and CD81 using ExoView analysis to ensure retention of surface markers (n = 3). Hydrodynamic stability of LRNVs was measured over 15 days at 4 °C in water or 37 °C in phosphate buffered saline (PBS) by assessing changes in the (D) size, (E) concentration, and (F) ζ-potential (n = 3, ±S.D). (G) Fluorescent images of human umbilical vein endothelial cells (HUVECs) after incubation with DiD-labeled LRNVs (red). Nuclei were visualized with 4′,6-diamidino-2-phenylindole (DAPI) (blue). Cells were incubated with DiD-LRNVs for 4, 6, or 24 h. (i–iii) Images at 20× magnification; scale bar: 50 μm, and (iv–vi) 60× magnification; scale bar: 20 μm. (H) LRNV uptake at all three timepoints was semiquantitatively measured using relative fluorescent intensity (n = 3).
Figure 5
Figure 5
Cell signaling properties of lipid rafts and LRNVs. (A) PMSCs were immunolabeled for caveolin-1 (green) and galectin-1 (top) or β-catenin (bottom) (red) to visualize colocalization of bioactive signaling proteins within the lipid raft microdomains. Scale bar: 20 μm. (B) Colocalization was further confirmed with co-immunoprecipitation of β-catenin or galectin-1 with caveolin-1. Mouse-IgG (M-IgG) was used as an antibody control for caveolin-1. (C) HUVECs were treated with LRNVs for 48 h and assessed for Akt expression using Western blotting. Glyceraldehyde-3-phosphate dehydrogenase (GAPDH) was used as a loading control. (D) Akt expression was quantified after GAPDH normalization (n = 3 donor cell banks and repeated with three independent experiments). *p < 0.05 versus untreated control using a one-sample t-test.
Figure 6
Figure 6
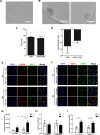
Neuroregenerative properties of LRNVs by direct coculture. (A–E) LRNVs were added directly to SH-SY5Y cells and incubated for 48 h for a neurogenesis model. Repeated n = 3 times in triplicate. (A) Top: calcein AM staining, bottom: Wimasis WimNeuron image analysis of representative images of cells in the presence or absence of LRNVs. Scale bar: 100 μm. WimNeuron quantification of (B) circuitry length (px), (C) branching points, and (D) total segments length (px). (E) The effect of LRNVs on SH-SY5Y proliferation was assessed with an MTS assay. Repeated 5 times in triplicate. (F–I) Neurorescue effects of LRNVs were assessed using a neuroprotection model. Apoptosis was induced in SH-SY5Y cells with staurosporine, and cells were then treated with or without LRNVs. Repeated n = 4 times in triplicate (F) Top: calcein AM staining, bottom: Wimasis WimNeuron image analysis of representative images of cells with or without LRNV treatment. Scale bar: 100 μm. Images were quantified for (G) circuitry length (px), (H) branching points, and (I) total segments length (px). n = 3 donor cell banks for all assays. *p < 0.05 versus untreated control using a one-sample t-test.
Figure 7
Figure 7
Angiogenic properties of LRNVs. (A) Representative images of HUVEC tube formation in the absence or presence of LRNV after 6 h incubation. Scale bar: 100 μm. ImageJ quantification of (B) number of nodes, (C) number of branches, and (D) vessel density normalized to the control group with no LRNV treatment. (E) Representative images of HUVEC migration at 0 and 8 h incubation with or without LRNV treatment. Scale bar: 100 μm. (F) Quantification of cells migrated into the wound area normalized to no treatment group. (G) MTS assay to assess HUVEC proliferation with LRNV treatment and normalized to the control group without LRNV (n = 3 donor cell banks for all assays). Repeated four times in triplicate for tube formation and migration assays and repeated five times in triplicate for an MTS assay. *p < 0.05 versus untreated control using a one-sample t-test.
Figure 8
Figure 8
Proof-of-concept cargo loading into LRNVs and cell internalization. Tetramethylrhodamine-conjugated bovine serum albumin (rhBSA) was loaded into LRNVs using sonication. CryoEM images of (A) empty, sonicated LRNVs and (B) rhBSA-loaded LRNVs shown as single particles in two fields of view. Resulting rhBSA-loaded LRNVs were measured for (C) size and (D) ζ-potential. (E–I) Uptake and internal trafficking of free rhBSA and rhbSA-LRNV into HUVECs were visualized with confocal microscopy. Representative images of rhBSA uptake and colocalization with (E) endosomes and (F) lysosomes at 1 and 6 h postincubation are shown. Red: free rhBSA or rhBSA-LRNVs, blue: nuclei, green: EEA1 (endosome) or LAMP1 (lysosome). Colocalization is indicated in yellow. Scale bar: 20 μm. (G) Images were quantified for total uptake using integrated density measurements. Particle colocalization in (H) endosome or (I) lysosome was quantified using Pearson’s coefficients. n = 2 biological replicates, three fields of view per replicate were used for quantification. ***p < 0.001, ****p < 0.0001 using a two-way analysis of variance (ANOVA) with Bonferroni post hoc test.

References

    1. Ouweneel A. B.; Thomas M. J.; Sorci-Thomas M. G. The Ins and Outs of Lipid Rafts: Functions in Intracellular Cholesterol Homeostasis, Microparticles, and Cell Membranes. J. Lipid Res. 2020, 61, 676–686. 10.1194/jlr.TR119000383. - DOI - PMC - PubMed
    1. Pike L. J. Lipid Rafts: Bringing Order to Chaos. J. Lipid Res. 2003, 44, 655–667. 10.1194/jlr.R200021-JLR200. - DOI - PubMed
    1. Lajoie P.; Nabi I. R.. Lipid Rafts, Caveolae, and Their Endocytosis. In International Review of Cell and Molecular Biology; Elsevier, 2010; Vol. 282, pp 135–16310.1016/S1937-6448(10)82003-9. - DOI - PubMed
    1. Smart E. J.; Graf G. A.; McNiven M. A.; Sessa W. C.; Engelman J. A.; Scherer P. E.; Okamoto T.; Lisanti M. P. Caveolins, Liquid-Ordered Domains, and Signal Transduction. Mol. Cell. Biol. 1999, 19, 7289–7304. 10.1128/MCB.19.11.7289. - DOI - PMC - PubMed
    1. Slaughter N.; Laux I.; Tu X.; Whitelegge J.; Zhu X.; Effros R.; Bickel P.; Nel A. The Flotillins Are Integral Membrane Proteins in Lipid Rafts That Contain TCR-Associated Signaling Components: Implications for T-Cell Activation. Clin. Immunol. 2003, 108, 138–151. 10.1016/S1521-6616(03)00097-4. - DOI - PubMed