A Clinical Study Provides the First Direct Evidence That Interindividual Variations in Fecal β-Lactamase Activity Affect the Gut Mycobiota Dynamics in Response to β-Lactam Antibiotics
- PMID: 36448778
- PMCID: PMC9765473
- DOI: 10.1128/mbio.02880-22
A Clinical Study Provides the First Direct Evidence That Interindividual Variations in Fecal β-Lactamase Activity Affect the Gut Mycobiota Dynamics in Response to β-Lactam Antibiotics
Abstract
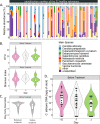
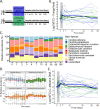
Antibiotics disturb the intestinal bacterial microbiota, leading to gut dysbiosis and an increased risk for the overgrowth of opportunistic pathogens. It is not fully understood to what extent antibiotics affect the fungal fraction of the intestinal microbiota, the mycobiota. There is no report of the direct role of antibiotics in the overgrowth in healthy humans of the opportunistic pathogenic yeast Candida albicans. Here, we have explored the gut mycobiota of 22 healthy subjects before, during, and up to 6 months after a 3-day regimen of third-generation cephalosporins (3GCs). Using ITS1-targeted metagenomics, we highlighted the strong intra- and interindividual diversity of the healthy gut mycobiota. With a specific quantitative approach, we showed that C. albicans prevalence was much higher than previously reported, with all subjects but one being carriers of C. albicans, although with highly variable burdens. 3GCs significantly altered the mycobiota composition and the fungal load was increased both at short and long term. Both C. albicans relative and absolute abundances were increased but 3GCs did not reduce intersubject variability. Variations in C. albicans burden in response to 3GC treatment could be partly explained by changes in the levels of endogenous fecal β-lactamase activity, with subjects characterized by a high increase of β-lactamase activity displaying a lower increase of C. albicans levels. A same antibiotic treatment might thus affect differentially the gut mycobiota and C. albicans carriage, depending on the treated subject, suggesting a need to adjust the current risk factors for C. albicans overgrowth after a β-lactam treatment. IMPORTANCE Fungal infections are redoubtable healthcare-associated complications in immunocompromised patients. Particularly, the commensal intestinal yeast Candida albicans causes invasive infections in intensive care patients and is, therefore, associated with high mortality. These infections are preceded by an intestinal expansion of C. albicans before its translocation into the bloodstream. Antibiotics are a well-known risk factor for C. albicans overgrowth but the impact of antibiotic-induced dysbiosis on the human gut mycobiota-the fungal microbiota-and the understanding of the mechanisms involved in C. albicans overgrowth in humans are very limited. Our study shows that antibiotics increase the fungal proportion in the gut and disturb the fungal composition, especially C. albicans, in a subject-dependent manner. Indeed, variations across subjects in C. albicans burden in response to β-lactam treatment could be partly explained by changes in the levels of endogenous fecal β-lactamase activity. This highlighted a potential new key factor for C. albicans overgrowth. Thus, the significance of our research is in providing a better understanding of the factors behind C. albicans intestinal overgrowth, which might lead to new means to prevent life-threatening secondary infections.
Keywords: Candida albicans; antibiotics; beta-lactamases; gut mycobiota; healthy individuals.
Conflict of interest statement
The authors declare no conflict of interest.
Figures


References
-
- Milani C, Ticinesi A, Gerritsen J, Nouvenne A, Lugli GA, Mancabelli L, Turroni F, Duranti S, Mangifesta M, Viappiani A, Ferrario C, Maggio M, Lauretani F, De Vos W, van Sinderen D, Meschi T, Ventura M. 2016. Gut microbiota composition and Clostridium difficile infection in hospitalized elderly individuals: a metagenomic study. Sci Rep 6:25945. doi:10.1038/srep25945. - DOI - PMC - PubMed
-
- Zuo T, Zhang F, Lui GCY, Yeoh YK, Li AYL, Zhan H, Wan Y, Chung ACK, Cheung CP, Chen N, Lai CKC, Chen Z, Tso EYK, Fung KSC, Chan V, Ling L, Joynt G, Hui DSC, Chan FKL, Chan PKS, Ng SC. 2020. Alterations in gut microbiota of patients with COVID-19 during time of hospitalization. Gastroenterology 159:944–955.e8. doi:10.1053/j.gastro.2020.05.048. - DOI - PMC - PubMed
-
- Burdet C, Nguyen TT, Duval X, Ferreira S, Andremont A, Guedj J, Mentré F, Ait-Ilalne B, Alavoine L, Duval X, Ecobichon JL, Ilic-Habensus E, Laparra A, Nisus ME, Ralaimazava P, Raine S, Tubiana S, Vignali V, Chachaty E, the DAV132-CL-1002 Study Group . 2019. Impact of antibiotic gut exposure on the temporal changes in microbiome diversity. Antimicrob Agents Chemother 63. doi:10.1128/AAC.00820-19. - DOI - PMC - PubMed
MeSH terms
Substances
LinkOut - more resources
Full Text Sources

