

Can a supranational medicines agency restore trust after vaccine suspensions? The case of Vaxzevria
- PMID: 36449501
- PMCID: PMC9710792
- DOI: 10.1371/journal.pone.0277554
Can a supranational medicines agency restore trust after vaccine suspensions? The case of Vaxzevria
Abstract
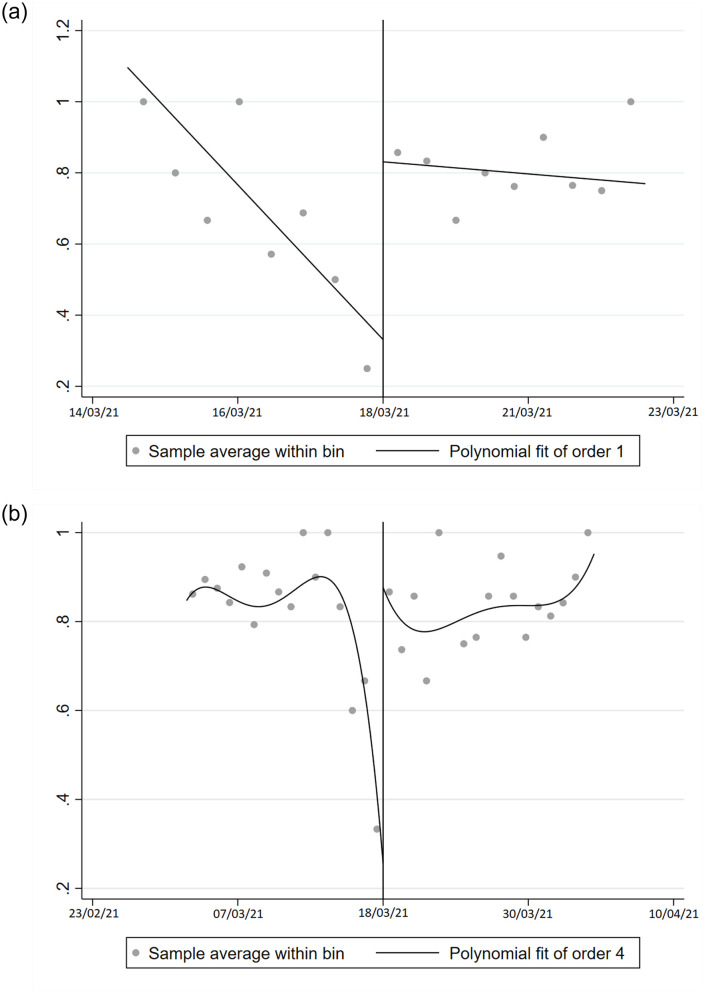
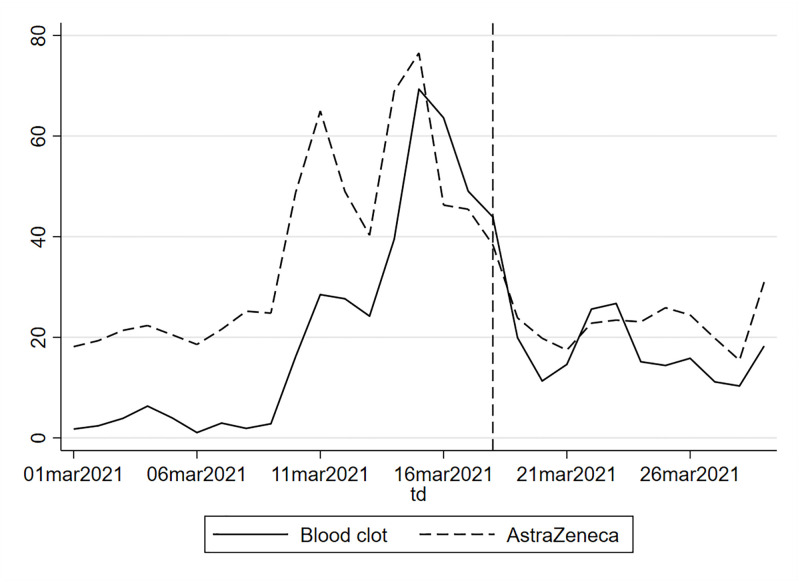
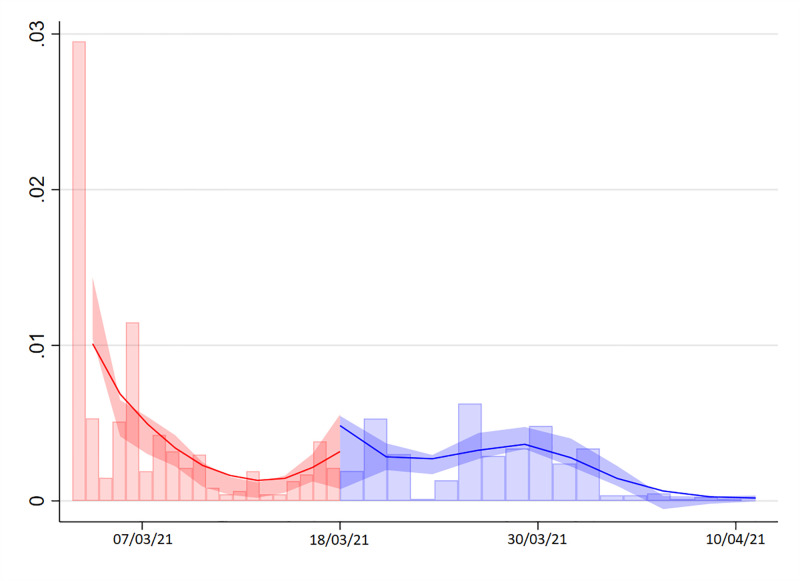
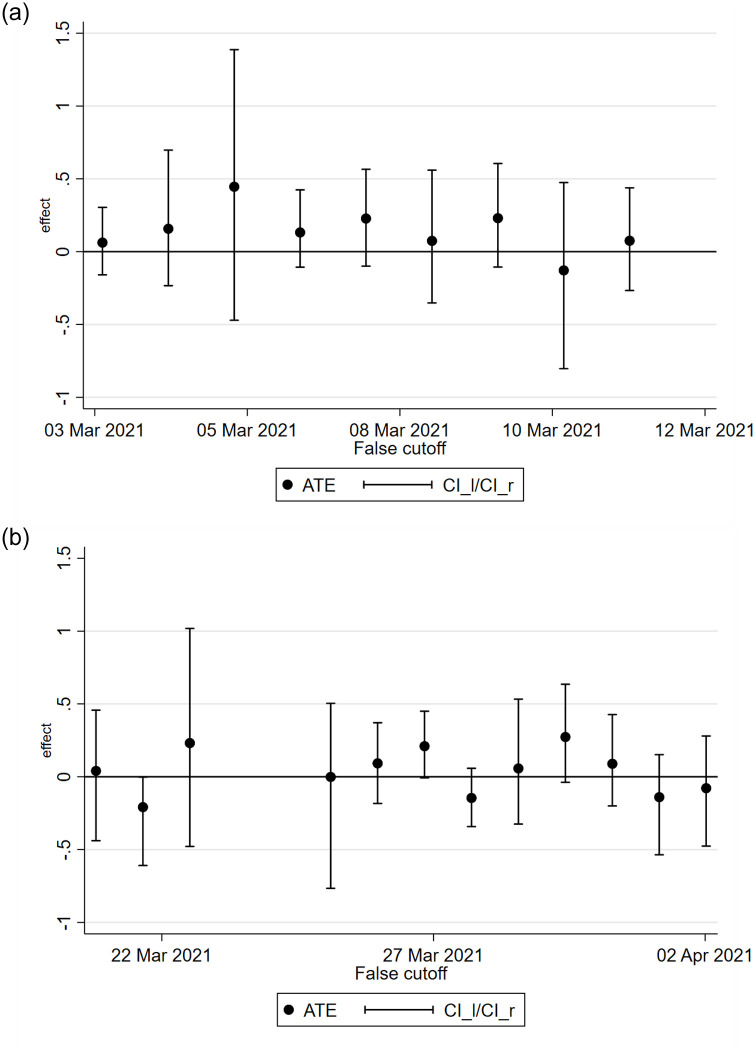
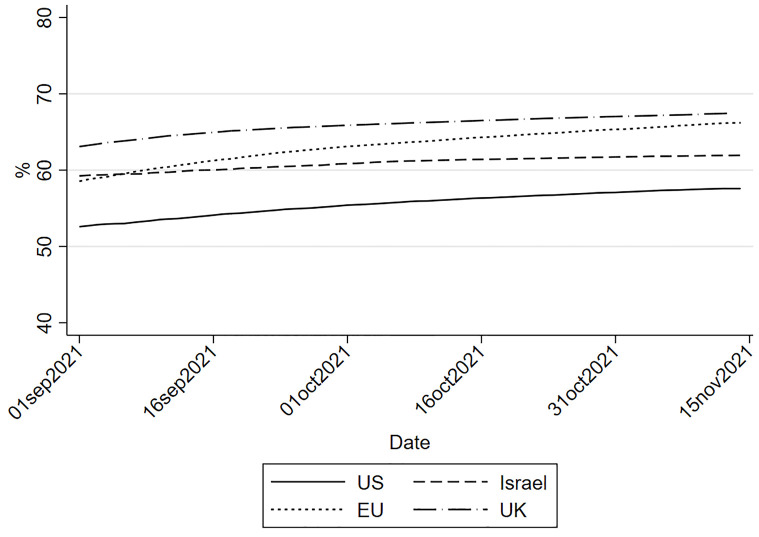
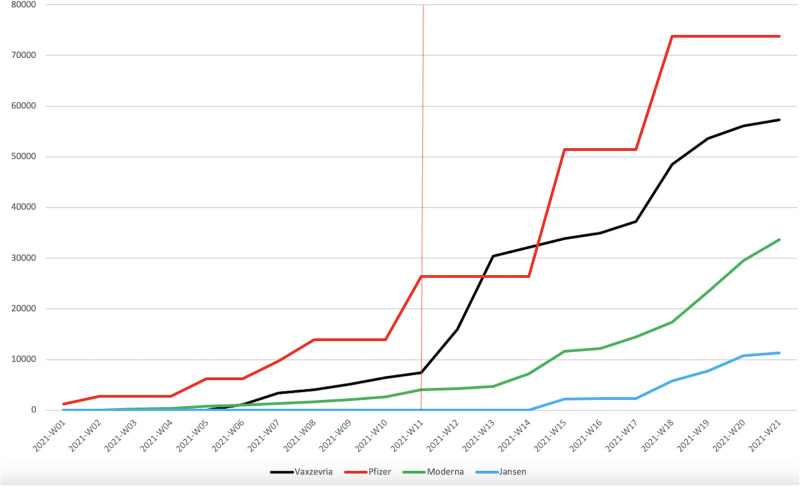
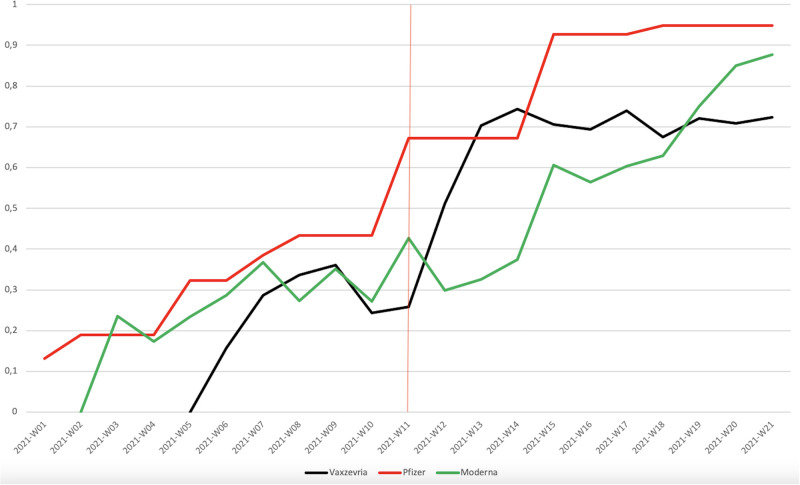
Over the first half of March 2021, the majority of European governments suspended Astrazeneca's Vaxzevria vaccine as a precaution following media reports of rare blood clots. We analyse the impact of the European Medicines Agency's (EMA) March 18th statement assuring the public of the safety of Vaxzevria and the immediate reinstatement of the vaccine by most countries on respondents' intention to get vaccinated. By relying on survey data collected in Luxembourg and neighbouring areas between early March and mid-April, we observe that the willingness to be vaccinated was severely declining in the days preceding the EMA statement. We implement a regression discontinuity design exploiting the time at which respondents completed the survey and find that the vaccine reinstatement substantially restored vaccination intentions.
Copyright: © 2022 Albanese et al. This is an open access article distributed under the terms of the Creative Commons Attribution License, which permits unrestricted use, distribution, and reproduction in any medium, provided the original author and source are credited.
Conflict of interest statement
The authors have declared that no competing interests exist.
Figures
Similar articles
-
The effect of framing and communicating COVID-19 vaccine side-effect risks on vaccine intentions for adults in the UK and the USA: A structured summary of a study protocol for a randomized controlled trial.Trials. 2021 Sep 6;22(1):592. doi: 10.1186/s13063-021-05484-2. Trials. 2021. PMID: 34488843 Free PMC article.
-
The psychological and behavioural correlates of COVID-19 vaccine hesitancy and resistance in Ireland and the UK.Acta Psychol (Amst). 2022 May;225:103550. doi: 10.1016/j.actpsy.2022.103550. Epub 2022 Feb 28. Acta Psychol (Amst). 2022. PMID: 35259642 Free PMC article.
-
Mandatory vaccination support and intentions to get vaccinated for COVID-19: Results from a nationally representative general population survey in October 2020 in Greece.J Eval Clin Pract. 2021 Aug;27(4):996-1003. doi: 10.1111/jep.13588. Epub 2021 Jun 1. J Eval Clin Pract. 2021. PMID: 34060686 Free PMC article.
-
Trust in government, intention to vaccinate and COVID-19 vaccine hesitancy: A comparative survey of five large cities in the United States, United Kingdom, and Australia.Vaccine. 2022 Apr 14;40(17):2498-2505. doi: 10.1016/j.vaccine.2021.06.048. Epub 2021 Jun 23. Vaccine. 2022. PMID: 34218963 Free PMC article.
-
Insights into COVID-19 Vaccine Development Based on Immunogenic Structural Proteins of SARS-CoV-2, Host Immune Responses, and Herd Immunity.Cells. 2021 Oct 29;10(11):2949. doi: 10.3390/cells10112949. Cells. 2021. PMID: 34831172 Free PMC article. Review.
References
MeSH terms
Substances
LinkOut - more resources
Full Text Sources
Research Materials
Miscellaneous
