. 2023 Jan 1;324(1):E42-E55.
doi: 10.1152/ajpendo.00165.2022. Epub 2022 Nov 30.

High-resolution analysis of the cytosolic Ca2+ events in β cell collectives in situ

Affiliations

High-resolution analysis of the cytosolic Ca2+ events in β cell collectives in situ

Sandra Postić et al. Am J Physiol Endocrinol Metab. .

Abstract

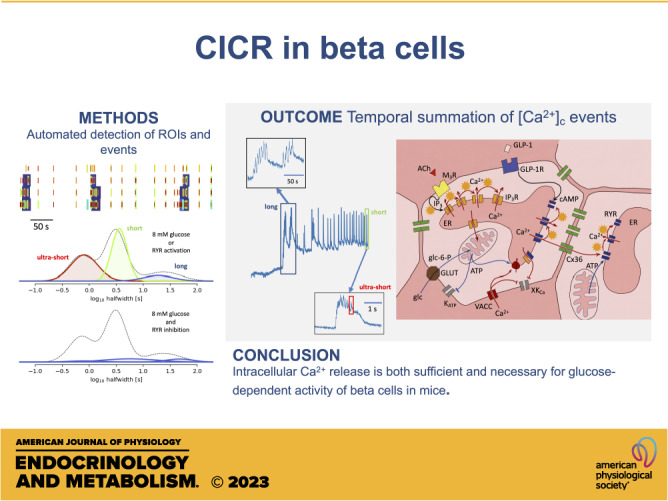
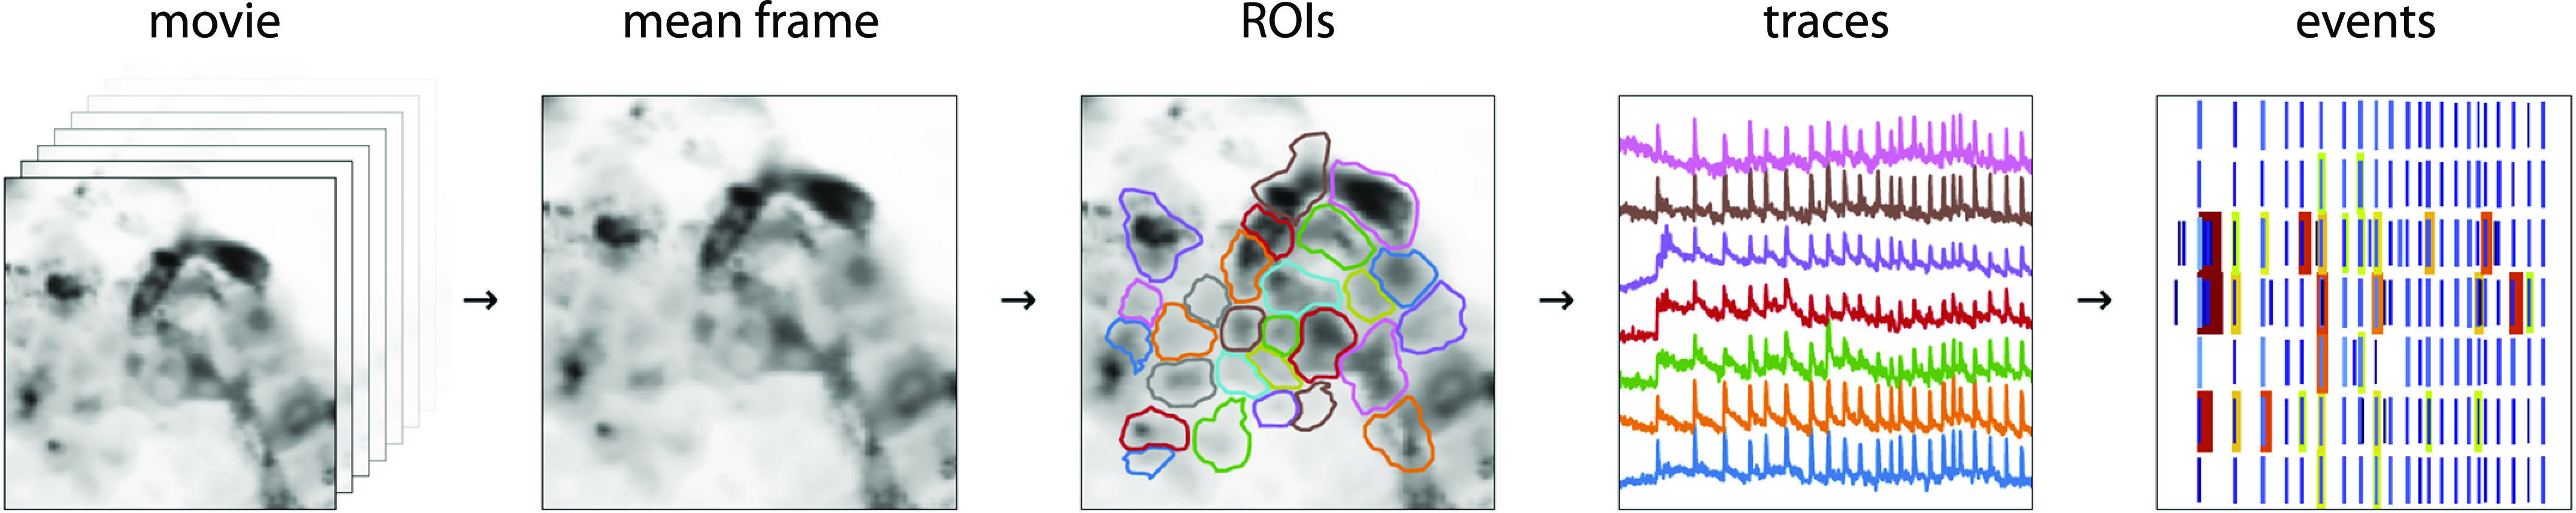
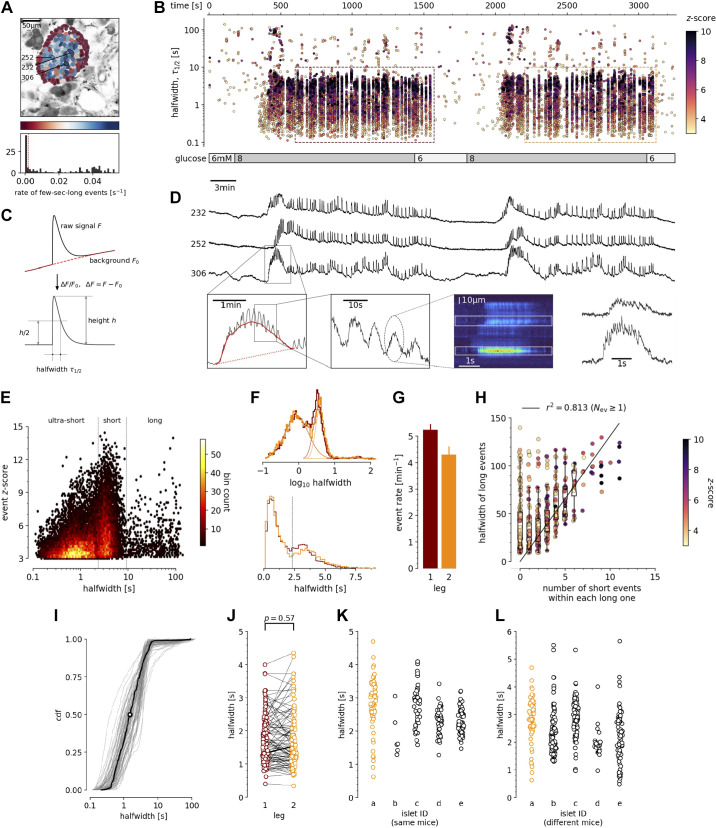
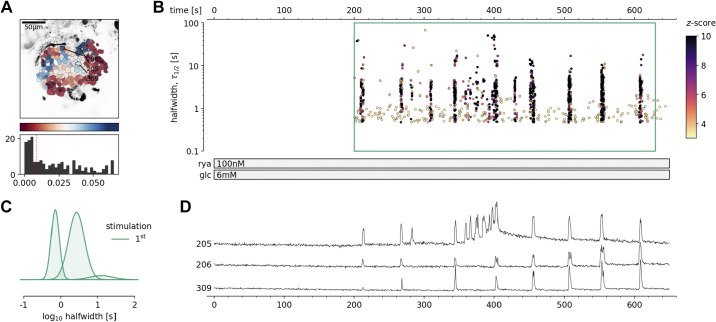
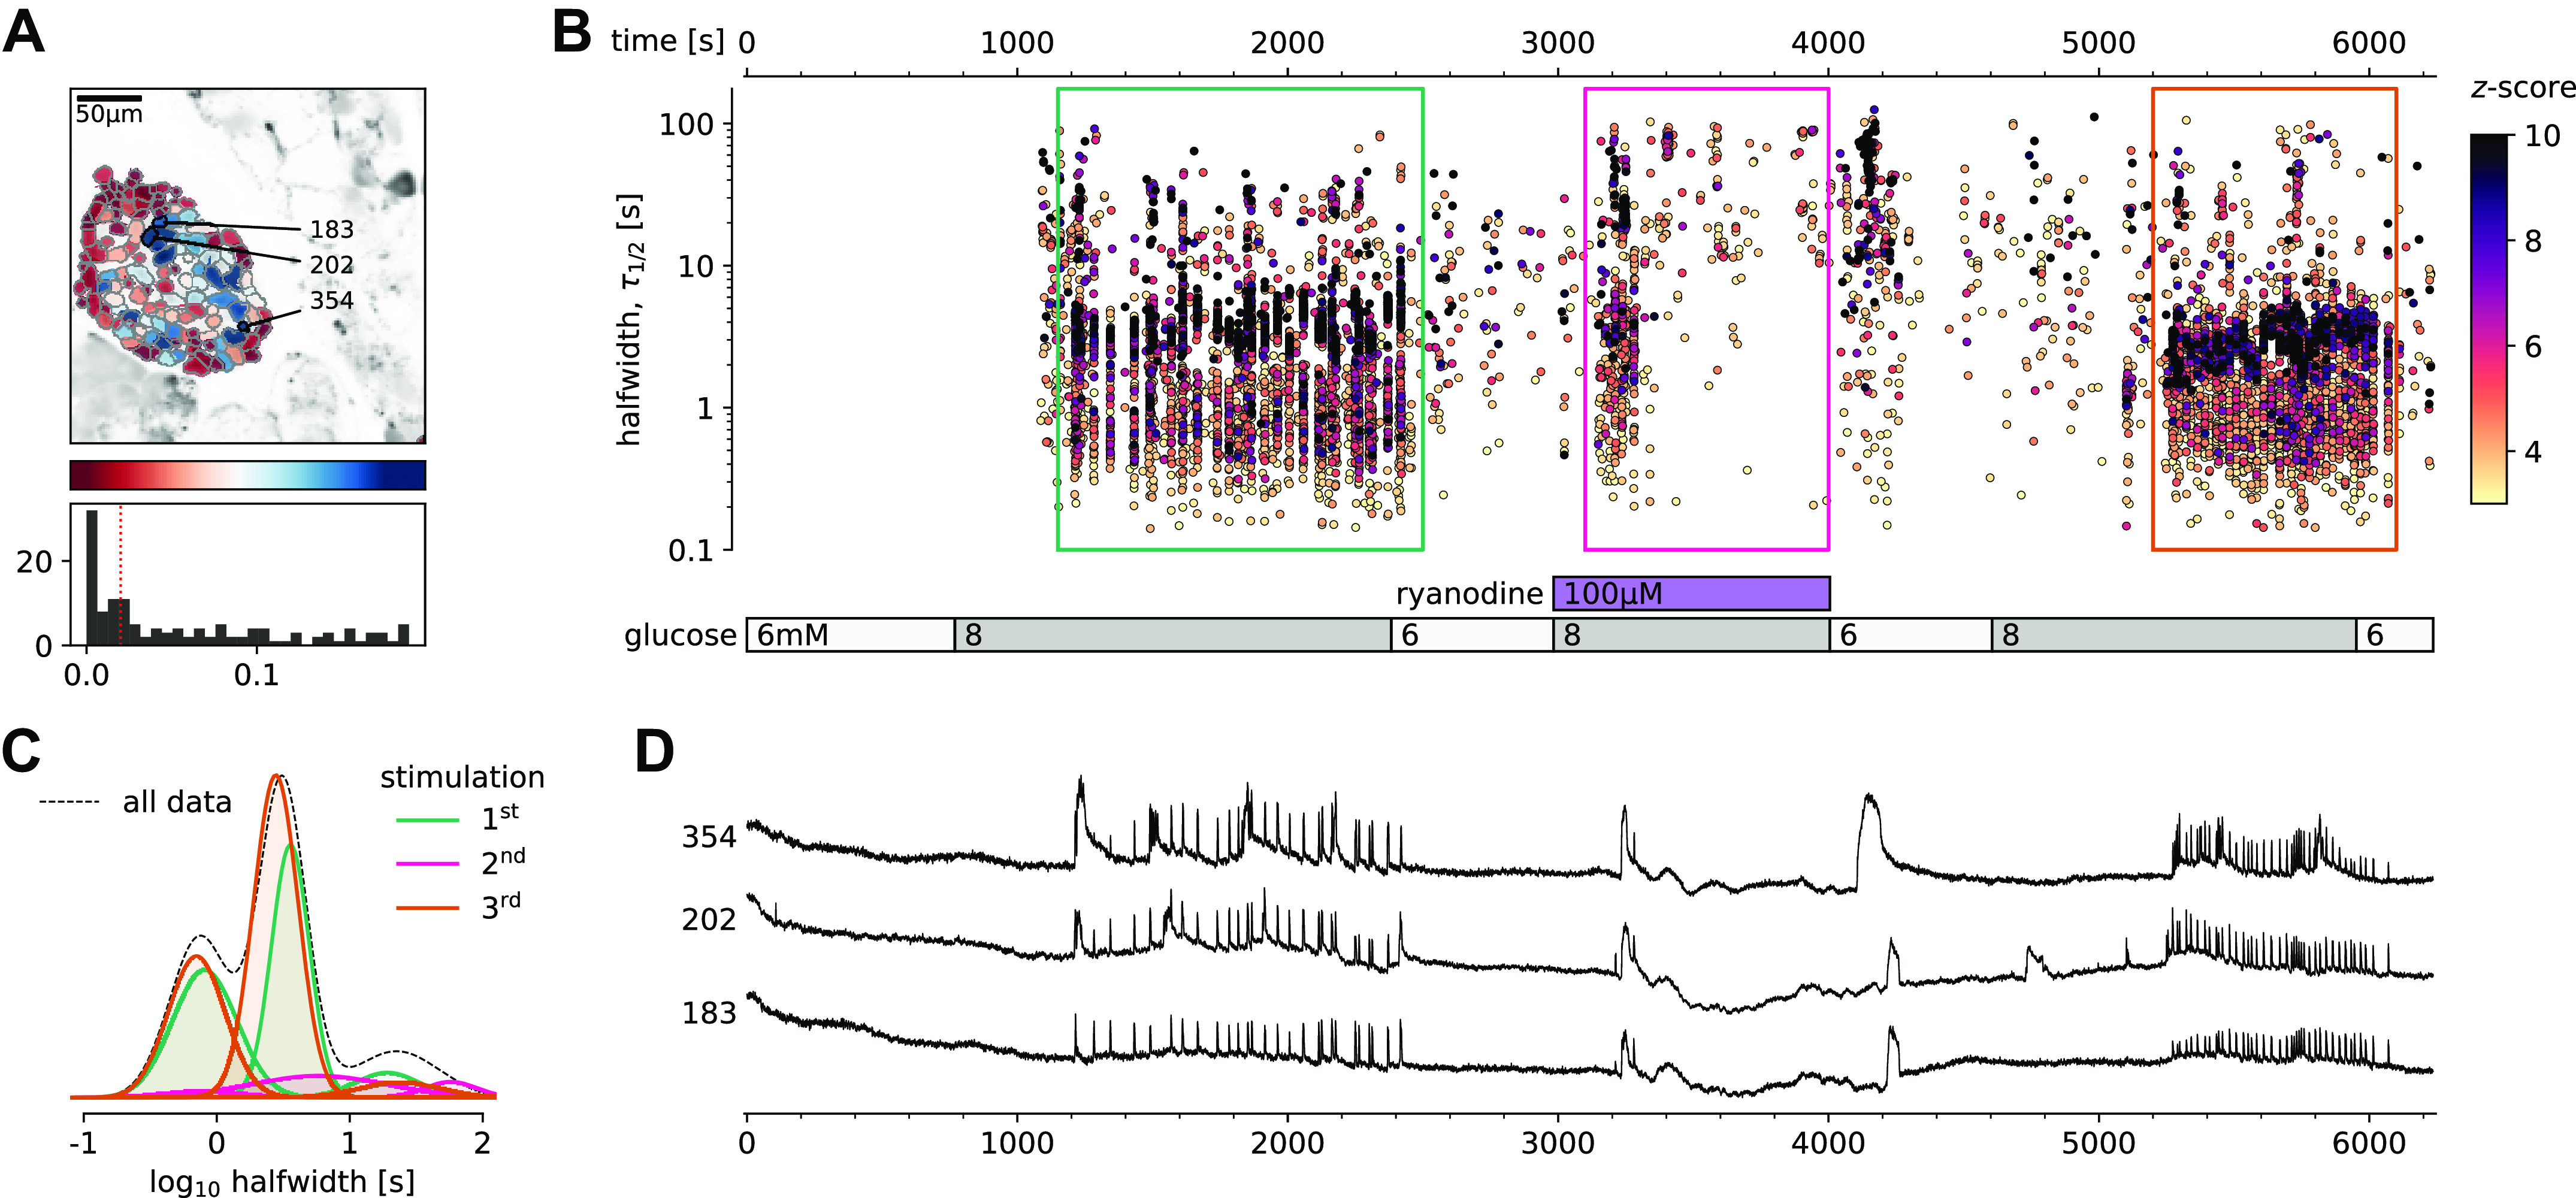
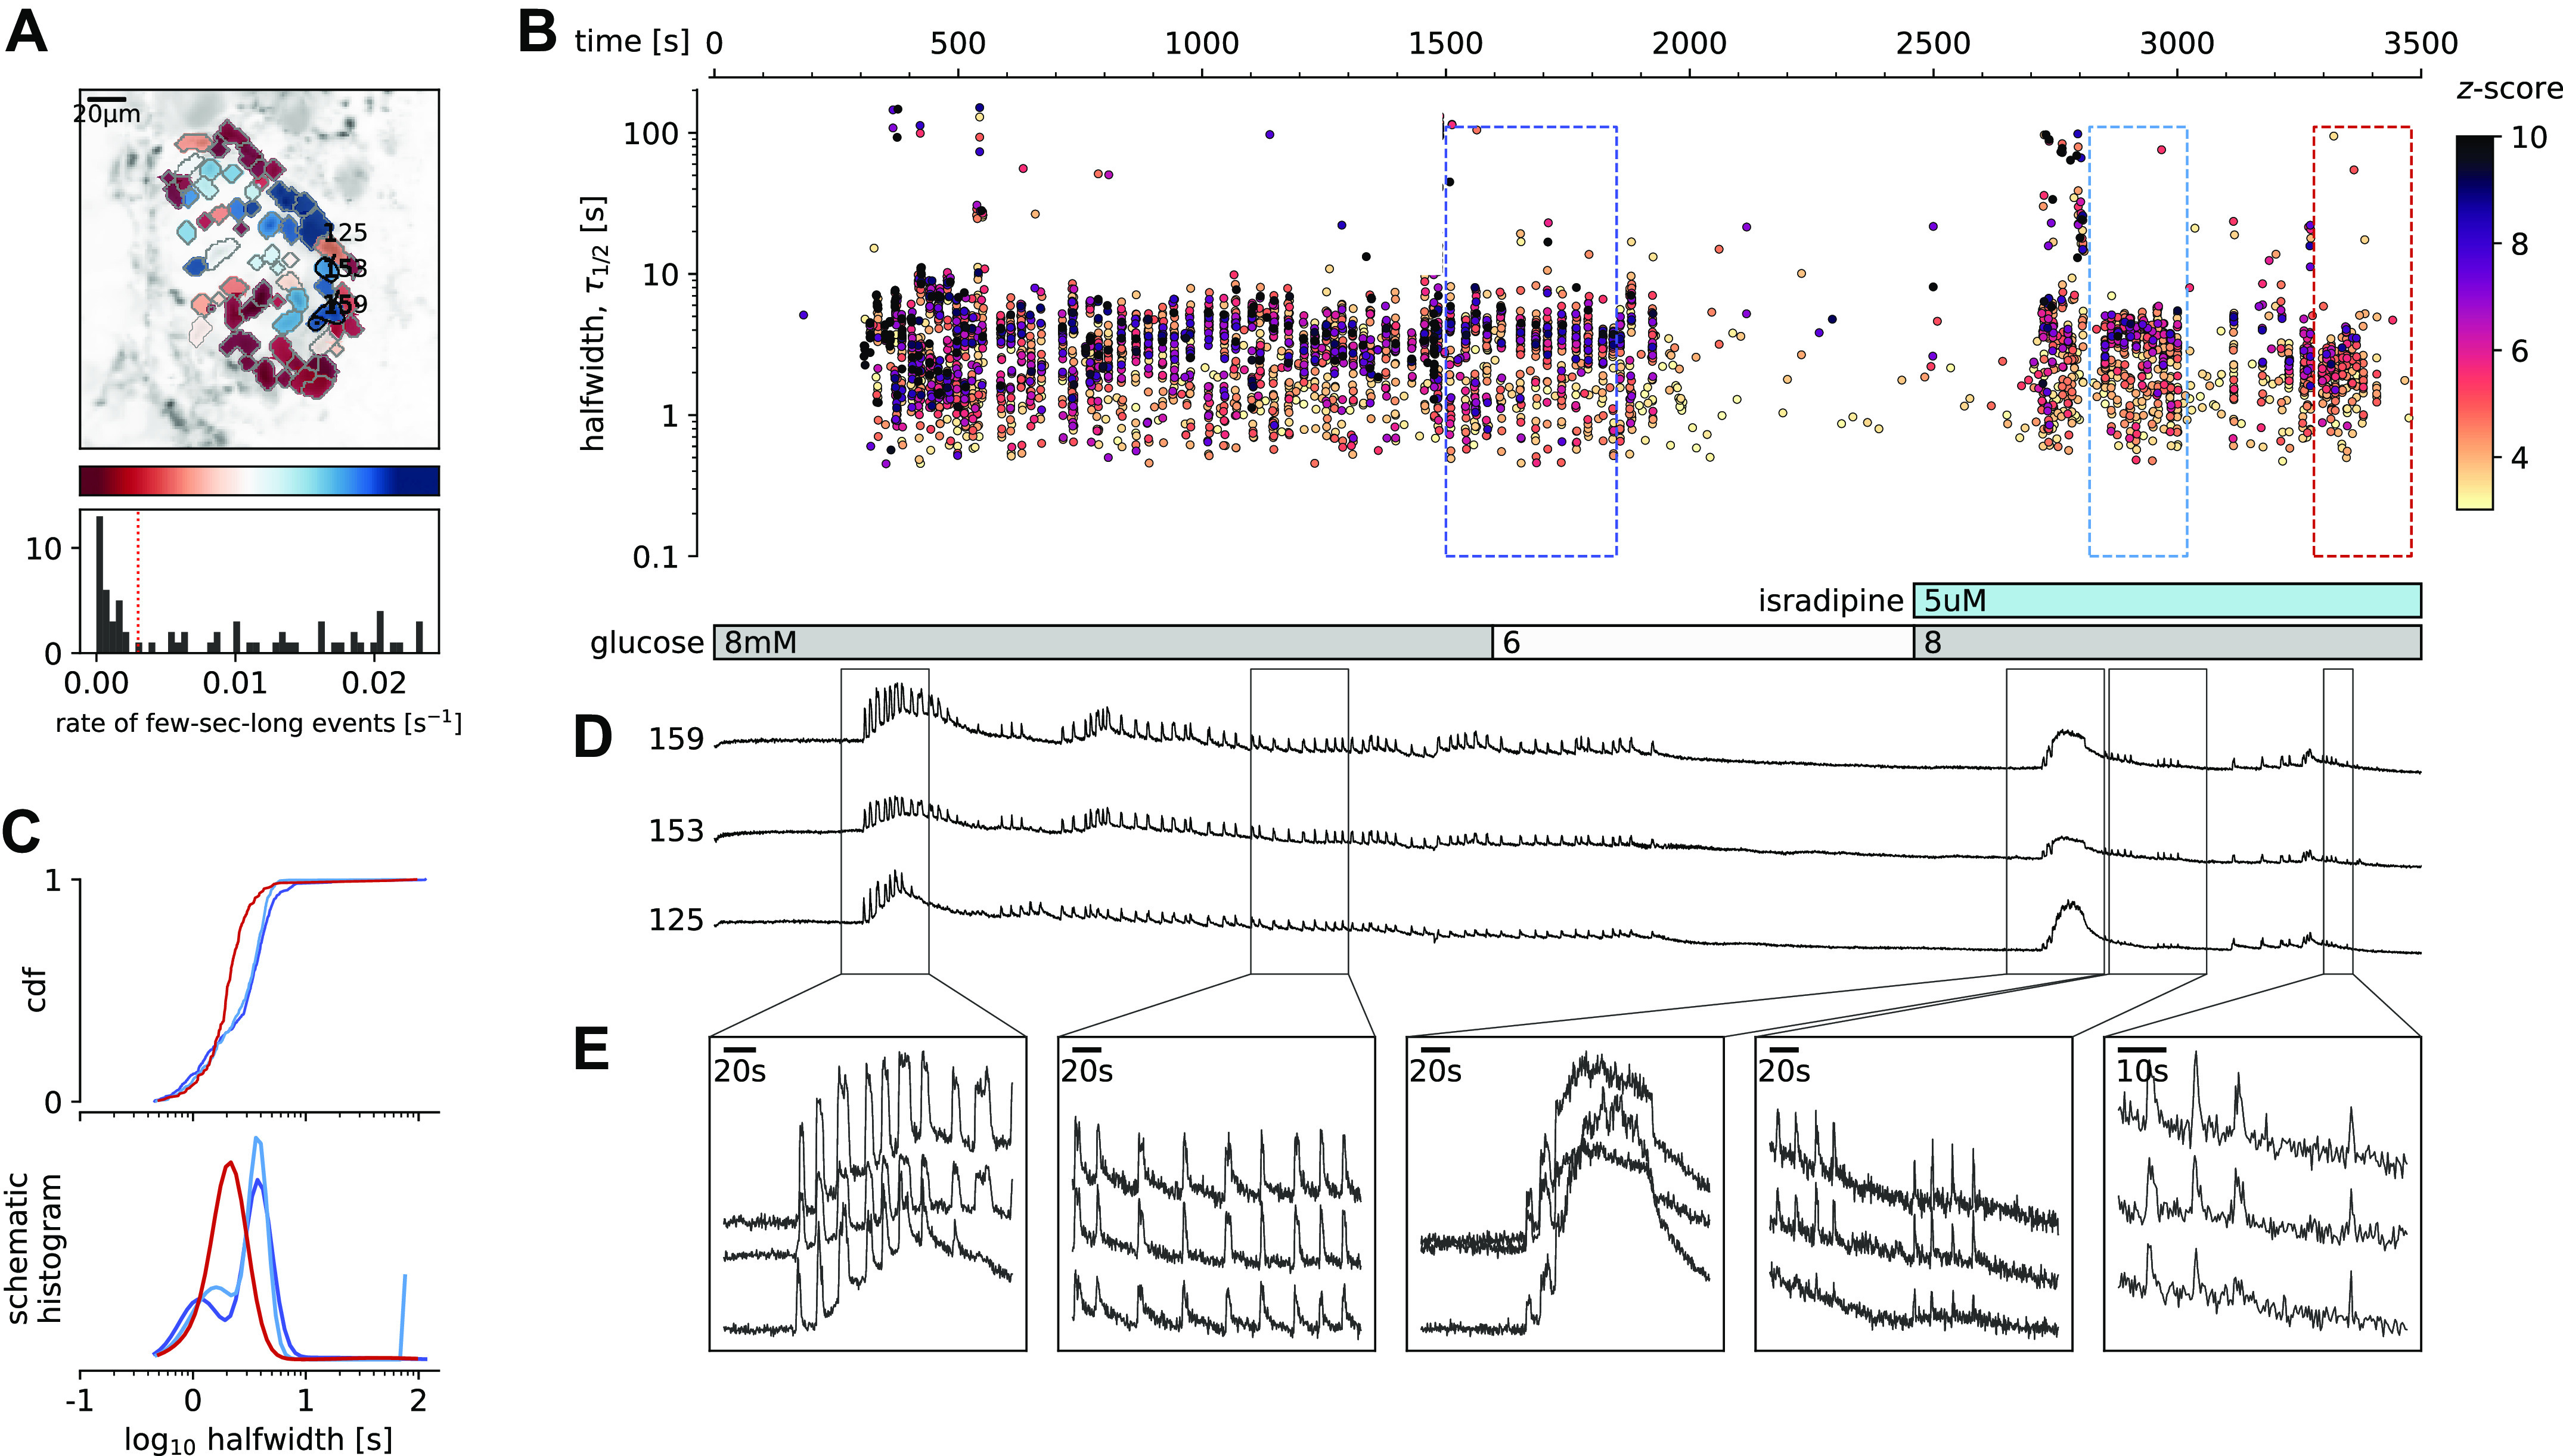
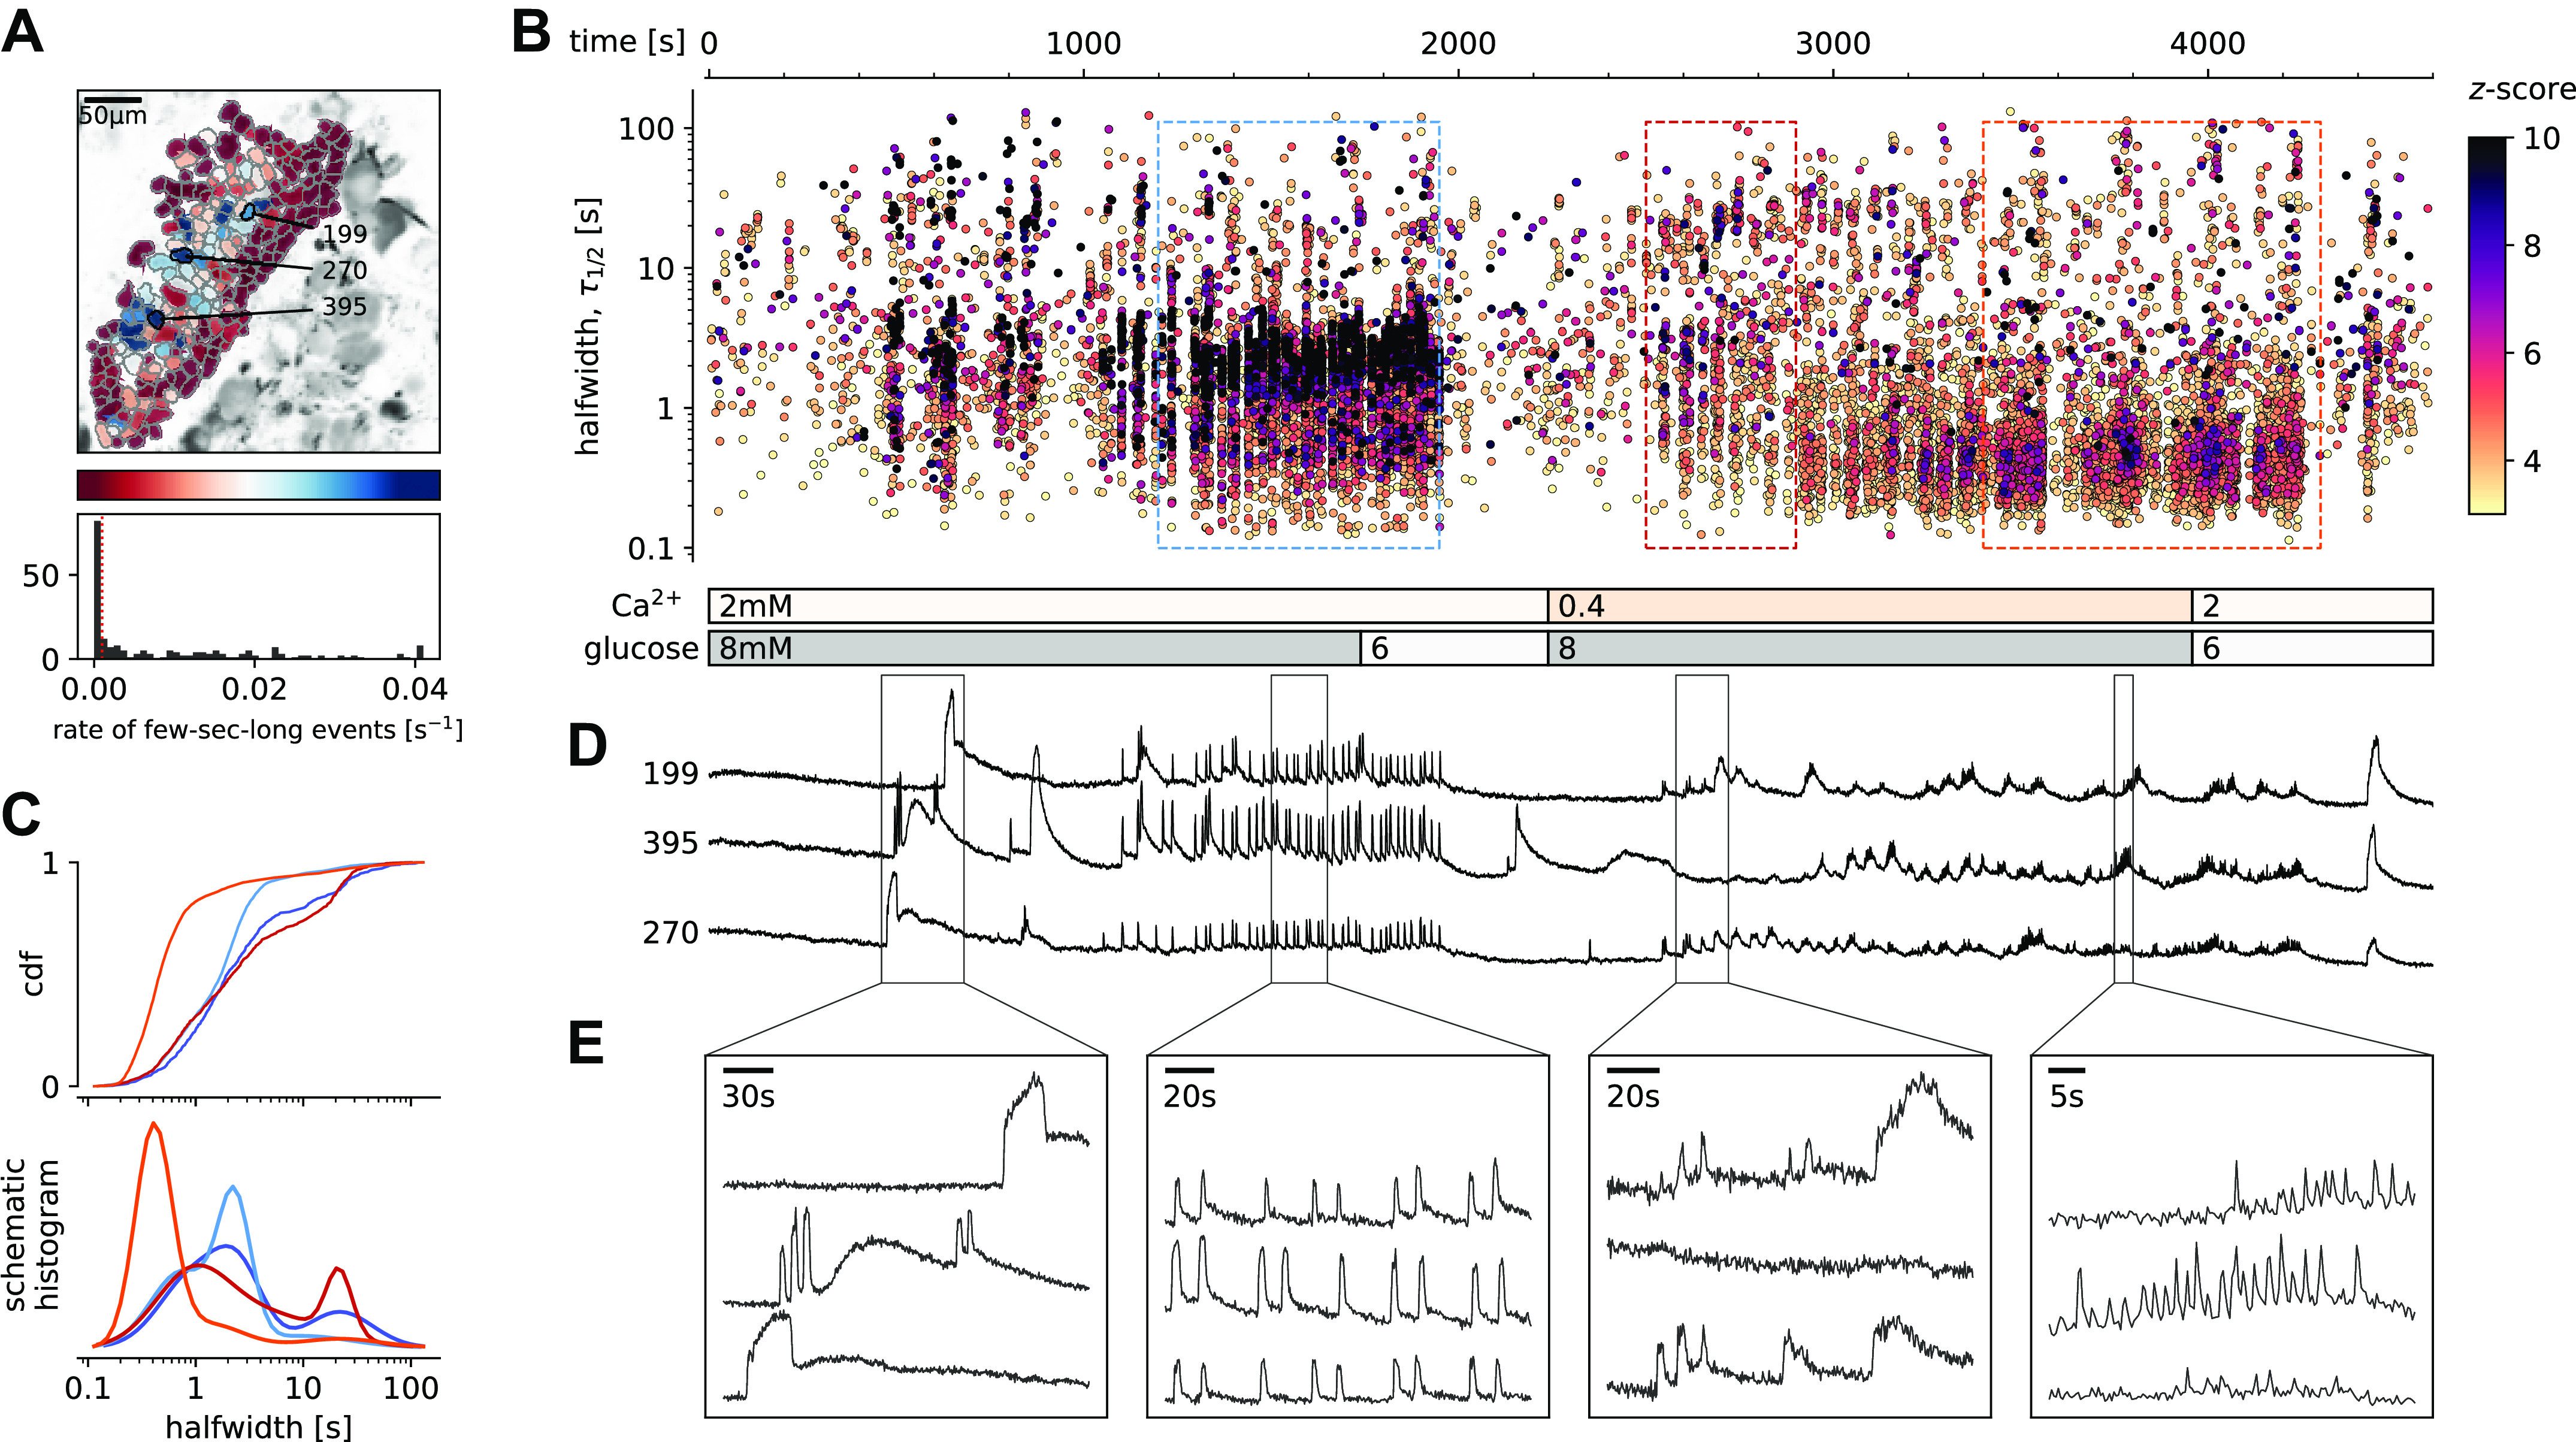
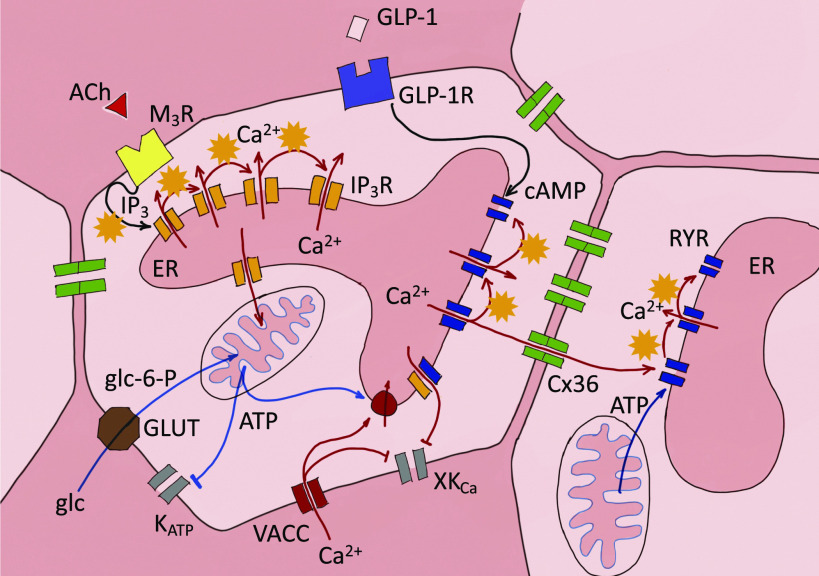
The release of peptide hormones is predominantly regulated by a transient increase in cytosolic Ca2+ concentration ([Ca2+]c). To trigger exocytosis, Ca2+ ions enter the cytosol from intracellular Ca2+ stores or from the extracellular space. The molecular events of late stages of exocytosis, and their dependence on [Ca2+]c, were extensively described in isolated single cells from various endocrine glands. Notably, less work has been done on endocrine cells in situ to address the heterogeneity of [Ca2+]c events contributing to a collective functional response of a gland. For this, β cell collectives in a pancreatic islet are particularly well suited as they are the smallest, experimentally manageable functional unit, where [Ca2+]c dynamics can be simultaneously assessed on both cellular and collective level. Here, we measured [Ca2+]c transients across all relevant timescales, from a subsecond to a minute time range, using high-resolution imaging with a low-affinity Ca2+ sensor. We quantified the recordings with a novel computational framework for automatic image segmentation and [Ca2+]c event identification. Our results demonstrate that under physiological conditions the duration of [Ca2+]c events is variable, and segregated into three reproducible modes, subsecond, second, and tens of seconds time range, and are a result of a progressive temporal summation of the shortest events. Using pharmacological tools we show that activation of intracellular Ca2+ receptors is both sufficient and necessary for glucose-dependent [Ca2+]c oscillations in β cell collectives, and that a subset of [Ca2+]c events could be triggered even in the absence of Ca2+ influx across the plasma membrane. In aggregate, our experimental and analytical platform was able to readily address the involvement of intracellular Ca2+ receptors in shaping the heterogeneity of [Ca2+]c responses in collectives of endocrine cells in situ.NEW & NOTEWORTHY Physiological glucose or ryanodine stimulation of β cell collectives generates a large number of [Ca2+]c events, which can be rapidly assessed with our newly developed automatic image segmentation and [Ca2+]c event identification pipeline. The event durations segregate into three reproducible modes produced by a progressive temporal summation. Using pharmacological tools, we show that activation of ryanodine intracellular Ca2+ receptors is both sufficient and necessary for glucose-dependent [Ca2+]c oscillations in β cell collectives.

Keywords: automated analysis; calcium dynamics; cell collective; pancreas tissue slices; β cell.


Conflict of interest statement

No conflicts of interest, financial or otherwise, are declared by the authors.

Figures

None
Graphical abstract
Figure 1.
Figure 1.
Processing pipeline to automatically detect regions of interest (ROIs) and [Ca2+]c events at all time scales within an experiment. From a full movie, we calculated the mean (or other statistic) across all frames. We passed the mean image through a bandpass filter and define ROIs by detecting local peaks of light intensity. We then saved ROIs with all the important information (time traces, ROI coordinates, movie statistics, recording frequency, pixel size, etc.). Traces contained features at very different timescales—with different timescales presumably being important for different cell types. We collected them into separable events for analysis.
Figure 2.
Figure 2.
Quantification and analysis of [Ca2+]c dynamics in physiological stimulatory glucose. A: regions of interest (ROIs) obtained by our segmentation algorithm. The color indicates the number of events identified in the ROI trace, upon a high-pass filtering at 0.2 Hz. We discarded ROIs with number of events below the threshold (red dashed line in the histogram in the bottom). Indicated are the ROI numbers whose filtered traces correlate best with the average trace for the whole islet; the correlation coefficients being 0.835, 0.818, and 0.807 (from top down in D). B: events’ halfwidth duration through time. Note the ranges of halfwidth duration occurring, the events’ synchronicity, and the phenotype’s reproducibility in sequential glucose stimulation. Color indicates the statistical significance in terms of z-score. Only events with a z-score higher than 3 were included. The stimulation protocol is indicated in the bar at the bottom of the pane. The plateau phases in both stimulations are indicated by a color coded rectangles. There is a prominent superposition of the short events on the plateau phases between the ROIs. C: an schematic of a transient event to describe the features of [Ca2+]c events from background subtraction of the raw data, to height and halfwidth duration. Peak-point is the time of highest amplitude of an event. D, top: time courses from ROIs indicated in A, exposed to a double stimulation protocol, and rebinned to 2 Hz (recorded 20 Hz). The abscissa is shared with B and is indicated there. Bottom: illustration of the compounding nature of transients. The left-most panel is a closeup of the trace above to highlight the long transient in red. In the second closeup, we emphasize the structure within the long transient. The third panel shows data from a different experiment, in same conditions (8 mM glucose), recorded as a line scan. In the final panel, we plot the time course of the indicated spatial regions, to illustrate the structure of subsecond events. E: in a z-score vs. halfwidth density plot, the events are clearly separated into three groups, which we named ultra-short, short, and long, with a typical separation between the groups at 2 s and 8.5 s. The dominant time scale of the events had a halfwidth duration of 2–5 s. F: normalized Gaussian fit through the logarithmic distribution of halfwidth duration for events for both first and second stimulation as indicated in B. G: the rate of events for the dominant short [Ca2+]c time scale for both stimulations indicated. H: evidence that the long events resulted from a progressive temporal summation of the (ultra-)short events. Some of the long events are less likely to contain substructure of short events, have lower z-scores, and contribute only little to the least square fit. I: cumulative distribution frequency (CDF) of the halfwidth duration of dominant short events during the plateau phase of the first stimulation for a randomly selected ROI. Thick black line indicates the median distribution. J: comparison between the halfwidth durations of events in individual ROIs during first and second glucose stimulation. K: comparison of halfwidth durations of events from all ROIs from different islets of the same mouse. L: comparison of halfwidth durations of events of all ROIs from islets of different mice.
Figure 3.
Figure 3.
Pharmacological activation of intracellular ryanodine receptor (RYR) Ca2+ receptors in mouse β cells at subthreshold glucose concentration. A: regions of interest (ROIs) obtained by our segmentation algorithm. The color indicates the number of events identified in the ROI trace, upon a high-pass filtering at 0.2 Hz. We discarded ROIs with number of events below the threshold (red dashed line in the histogram in the bottom). Indicated are the ROI numbers whose filtered traces correlate best with the average trace for the whole islet. B: events’ halfwidth duration through time. Note the ranges of halfwidth duration occurring, the events’ synchronicity, and the phenotype’s reproducibility in ryanodine stimulation. Color indicates the statistical significance in terms of z-score. The stimulation protocol is indicated in the bar at the bottom of the pane. There is a prominent superposition of the short events on the plateau phases between the ROIs. C: normalized Gaussian fit through the logarithmic distribution of halfwidth duration during ryanodine stimulation, indicated temporal summation producing three discrete modes. D: time courses from ROIs indicated in A, exposed to a double stimulation protocol, and rebinned to 2 Hz (recorded at 20 Hz). The abscissa is shared with B and is indicated there.
Figure 4.
Figure 4.
Pharmacological inhibition of intracellular ryanodine receptor (RYR) Ca2+ channels in mouse β cells selectively inhibits the plateau [Ca2+]c oscillations. A: regions of interest (ROIs) obtained by our segmentation algorithm. The color indicates the number of events identified in the ROI trace, upon a high-pass filtering at 0.2 Hz. We discarded ROIs with number of events below the threshold (red dashed line in the histogram in the bottom). Indicated are the ROI numbers whose filtered traces correlate best with the average trace for the whole islet. B: events’ halfwidth duration through time for an islet exposed to a triple 8 mM glucose stimulation protocol. Inhibitory ryanodine (100 µM) was applied in the middle section of the protocol. The stimulation protocol is indicated in the bar at the bottom of the pane. There is a prominent superposition of the short events on the plateau phases between the ROIs. C: normalized Gaussian fit through the logarithmic distribution of halfwidth duration during control conditions and RYR inhibition, indicated temporal summation producing three discrete peaks. Note a complete absence of short events during the plateau phase of the second stimulation in the presence of high ryanodine. D: time courses from ROIs indicated in A, exposed to a triple stimulation protocol, and rebinned to 2 Hz (recorded at 20 Hz). The abscissa is shared with B and is indicated there. Note the reduced [Ca2+]c level during the exposure to high ryanodine.
Figure 5.
Figure 5.
Glucose-dependent activation of β cells in the presence of inhibitory isradipine concentration to block voltage-activated Ca2+ channels (VACCs). A: regions of interest (ROIs) obtained by our segmentation algorithm. The color indicates the number of events identified in the ROI trace, upon a high-pass filtering at 0.2 Hz. We discarded ROIs with number of events below the threshold (red dashed line in the histogram in the bottom). Indicated are the ROI numbers whose filtered traces correlate best with the average trace for the whole islet. B: events’ halfwidth duration through time for an islet exposed to a double 8 mM glucose stimulation protocol. Saturating concentration of VACC blocker isradipine (5 µM) was applied in the second section of the protocol. The stimulation protocol is indicated in the bar at the bottom of the pane. There is a prominent superposition of the short events on the plateau phases between the ROIs. C, top: cumulative distribution frequency (CDF) of a mean halfwidth duration of events during the plateau phase of the both stimulations. Bottom: normalized Gaussian fit through the logarithmic distribution of halfwidth duration during control conditions and inhibition of VACCs. Note a shift toward shorter events during the late plateau phase in the presence of isradipine. D: time courses from ROIs indicated in A, exposed to a double stimulation protocol, and rebinned to 2 Hz (original frequency is 20 Hz). The abscissa is shared with B and is indicated there. E: expanded time traces from a representative ROI indicating (as indicated in C) the a long event from the initial transient phase, followed by a plateau phase in control, long event during initiation of the second stimulation, short events from early plateau phase, and further shortened events from a late plateau phase.
Figure 6.
Figure 6.
Glucose-dependent activation of β cells at subphysiological extracellular Ca2+ concentration. A: regions of interest (ROIs) obtained by our segmentation algorithm. The color indicates the number of events identified in the ROI trace, upon a high-pass filtering at 0.2 Hz. We discarded ROIs with number of events below the threshold (red dashed line in the histogram in the bottom). Indicated are the ROI numbers whose filtered traces correlate best with the average trace for the whole islet. B: events’ halfwidth duration through time for an islet exposed to a double 8 mM glucose stimulation protocol. Subphysiological extracellular Ca2+ level (400 µM) was applied in the second section of the protocol. The stimulation protocol is indicated in the bar at the bottom of the pane. There is a prominent superposition of the short events on the plateau phases between the ROIs. C, top: cumulative distribution frequency (CDF) of a mean halfwidth duration of events during the plateau phase of the both stimulations. Events from the initial transient phase are in dark colors, events from the plateau phase are in light color. Bottom: normalized Gaussian fit through the logarithmic distribution of halfwidth duration during control conditions and inhibition of voltage-activated Ca2+ channels (VACCs). Note a shift toward shorter events during the plateau phase in the conditions of subphysiological extracellular Ca2+ concentration. D: time courses from ROIs indicated in A, exposed to a double stimulation protocol, and rebinned to 2 Hz (recorded at 20 Hz). The abscissa is shared with B and is indicated there. E: expanded time traces from a representative ROI indicating (as indicated in C) the a long event from the initial transient phase, followed by a plateau phase in control, long event during initiation of the second stimulation, and short events from early plateau phase in low extracellular Ca2+ concentration.
Figure 7.
Figure 7.
Proposed model of the role of intracellular ryanodine receptor (RYR) and inositol (1,4,5)-trisphosphate (IP3) Ca2+ release channels in activation and activity of the mouse β cell. The basic principle in different patterns of [Ca2+]c oscillation is intermolecular Ca2+-induced Ca2+ release-like (CICR, orange stars). Physiological glucose stimulation activates both IP3R and RYR activity, which is followed by repetitive bursts of RYRs activity. The subcellular arrangement of RYRs enables intercellular communication through the Cx36 proteins and synchronized propagation of the Ca2+ events. ATP-dependent closure of KATP channels contributes to the synchronization. VACCs are critical for refilling of the internal stores. [Ca2+]c changes are registered by different plasma membrane K+ channels (XKCa). GLP-1R stimulation of cAMP production and ATP from the mitochondrial metabolism can modulate the RYR activity. Ca2+ concentration in the extracellular space and in different compartments of the cell is color coded, with the lowest [Ca2+]c in the cytosol.

Similar articles

Cited by

References

    1. Drews G, Krippeit-Drews P, Düfer M. Electrophysiology of islet cells. Adv Exp Med Biol 654: 115–163, 2010. doi:10.1007/978-90-481-3271-3_7. - DOI - PubMed
    1. Rorsman P, Ashcroft FM. Pancreatic β-cell electrical activity and insulin secretion: of mice and men. Physiol Rev 98: 117–214, 2018. doi:10.1152/physrev.00008.2017. - DOI - PMC - PubMed
    1. Skelin Klemen M, Dolenšek J, Slak Rupnik M, Stožer A. The triggering pathway to insulin secretion: functional similarities and differences between the human and the mouse β cells and their translational relevance. Islets 29, 109–139, 2017. doi:10.1080/19382014.2017.1342022. - DOI - PMC - PubMed
    1. Cook DL. Isolated islets of Langerhans have slow oscillations of electrical activity. Metabolism 32: 681–685, 1983. doi:10.1016/0026-0495(83)90124-5. - DOI - PubMed
    1. Sanchez-Andres JV, Pomares R, Malaisse WJ. Adaptive short-term associative conditioning in the pancreatic β-cell. Physiol Rep 8: e14403, 2020. doi:10.14814/phy2.14403. - DOI - PMC - PubMed

Publication types

LinkOut - more resources