. 2022 Nov 30;14(673):eabq6146.
doi: 10.1126/scitranslmed.abq6146. Epub 2022 Nov 30.

Generation and multiomic profiling of a TP53/CDKN2A double-knockout gastroesophageal junction organoid model

Affiliations

Generation and multiomic profiling of a TP53/CDKN2A double-knockout gastroesophageal junction organoid model

Hua Zhao et al. Sci Transl Med. .

Abstract

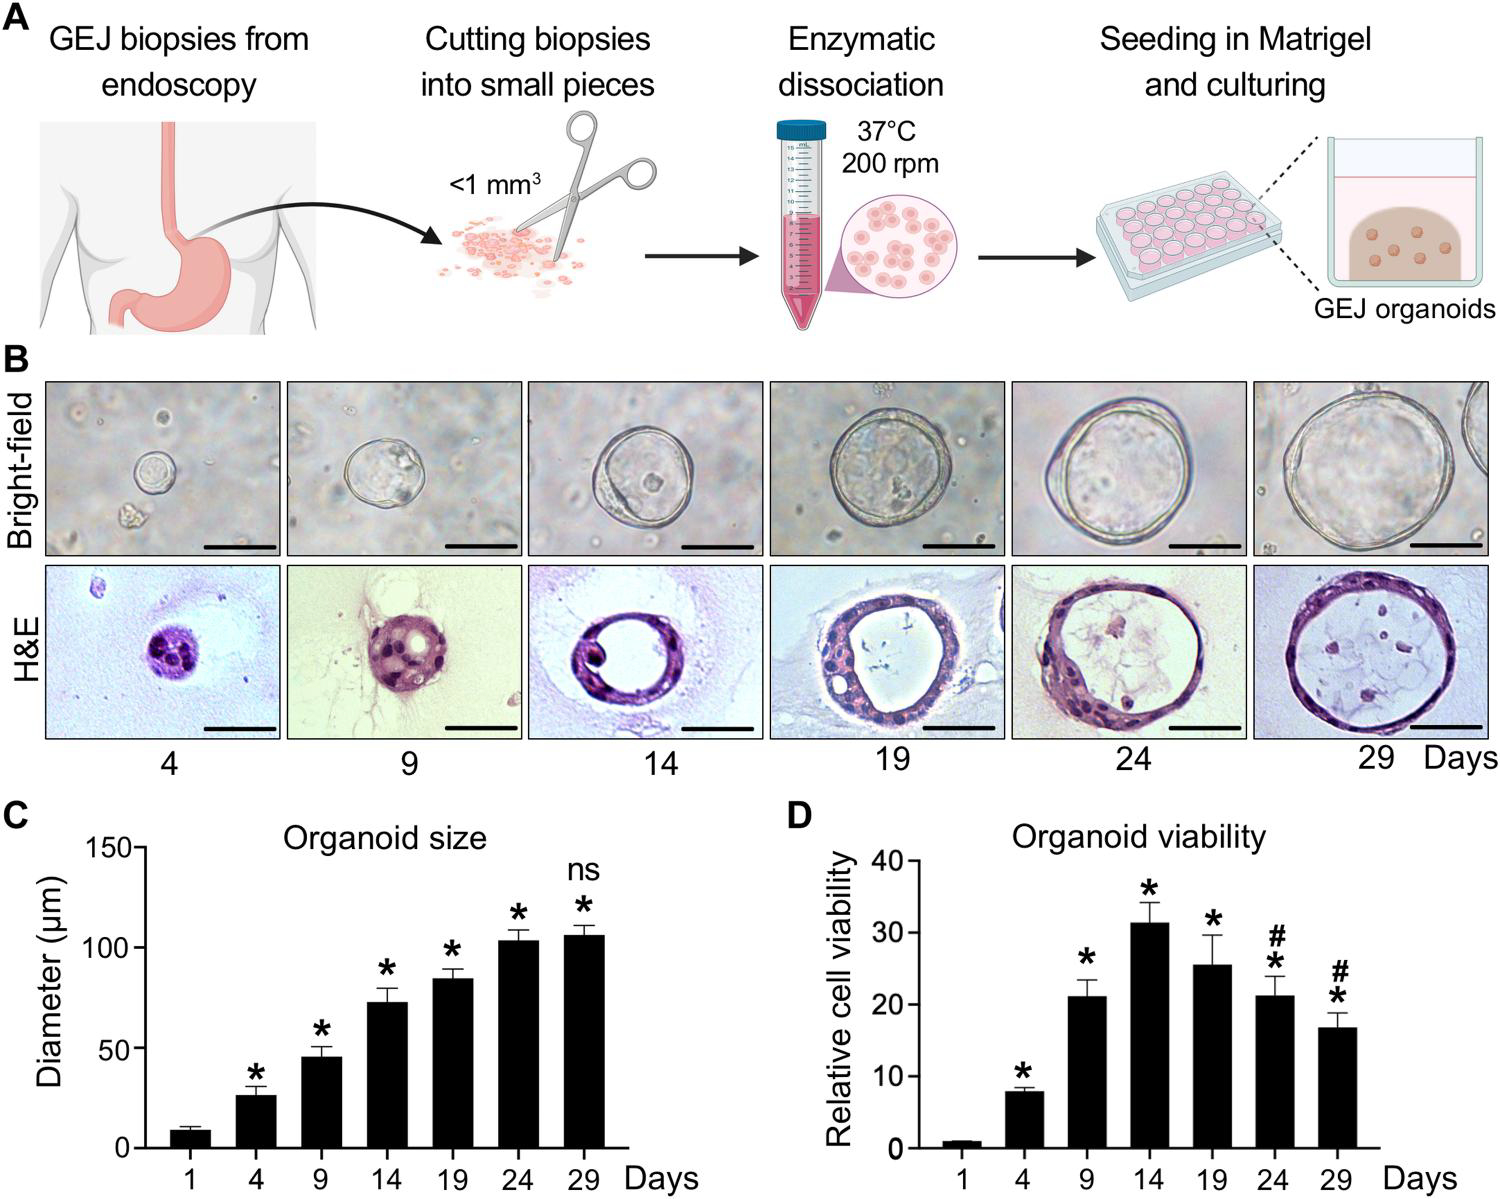
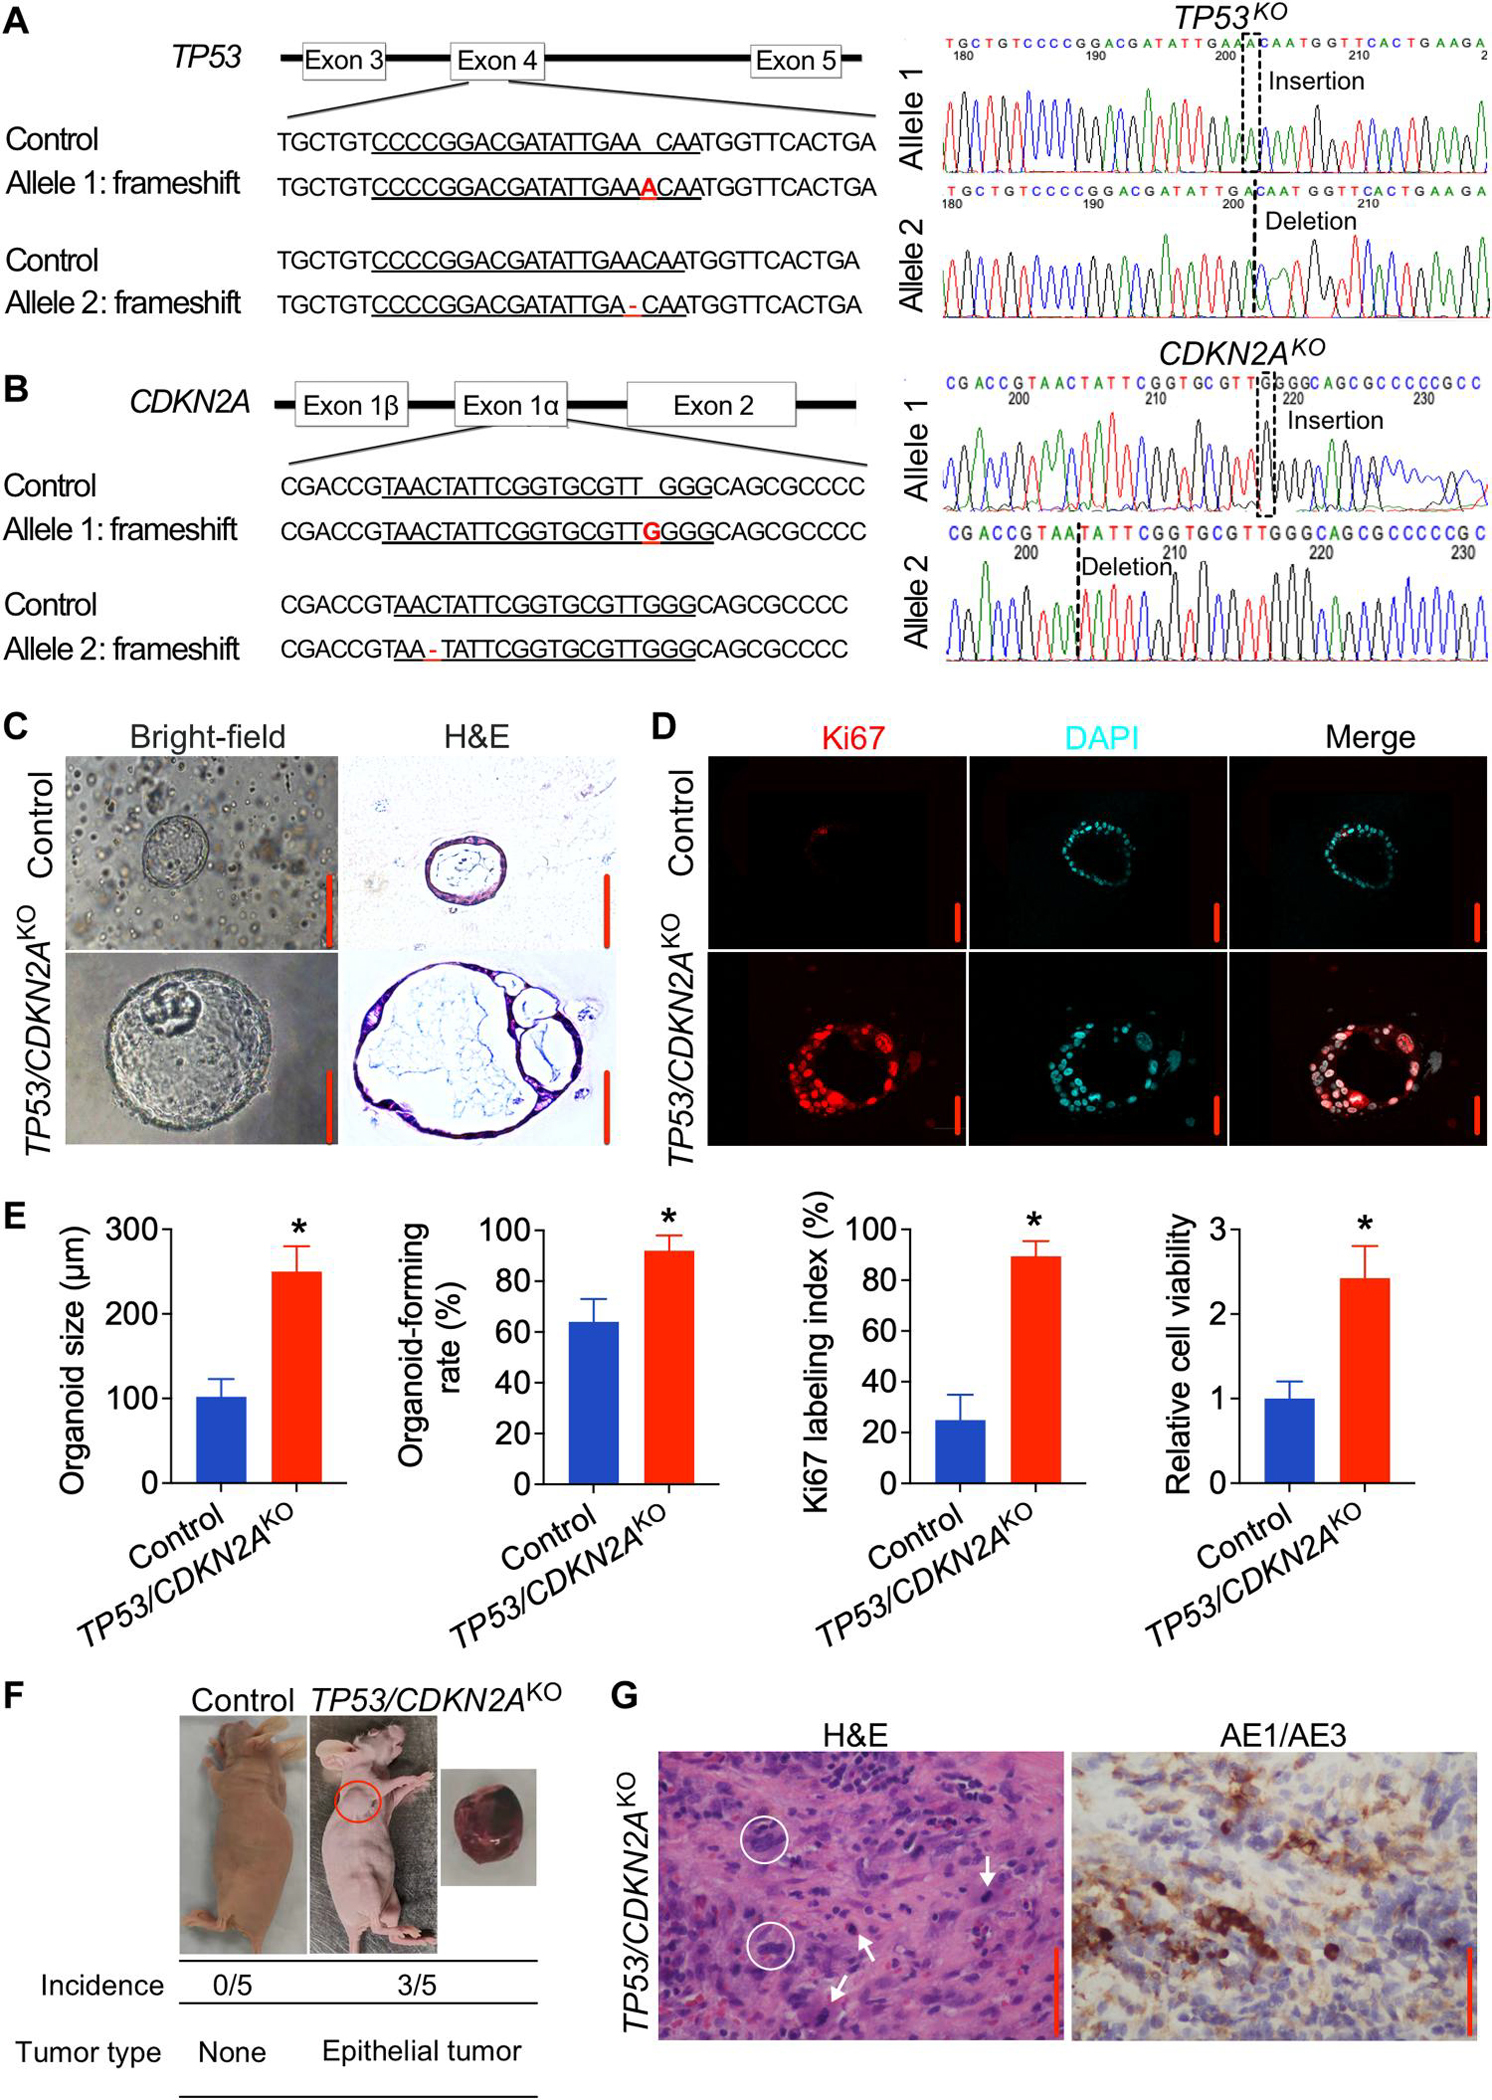
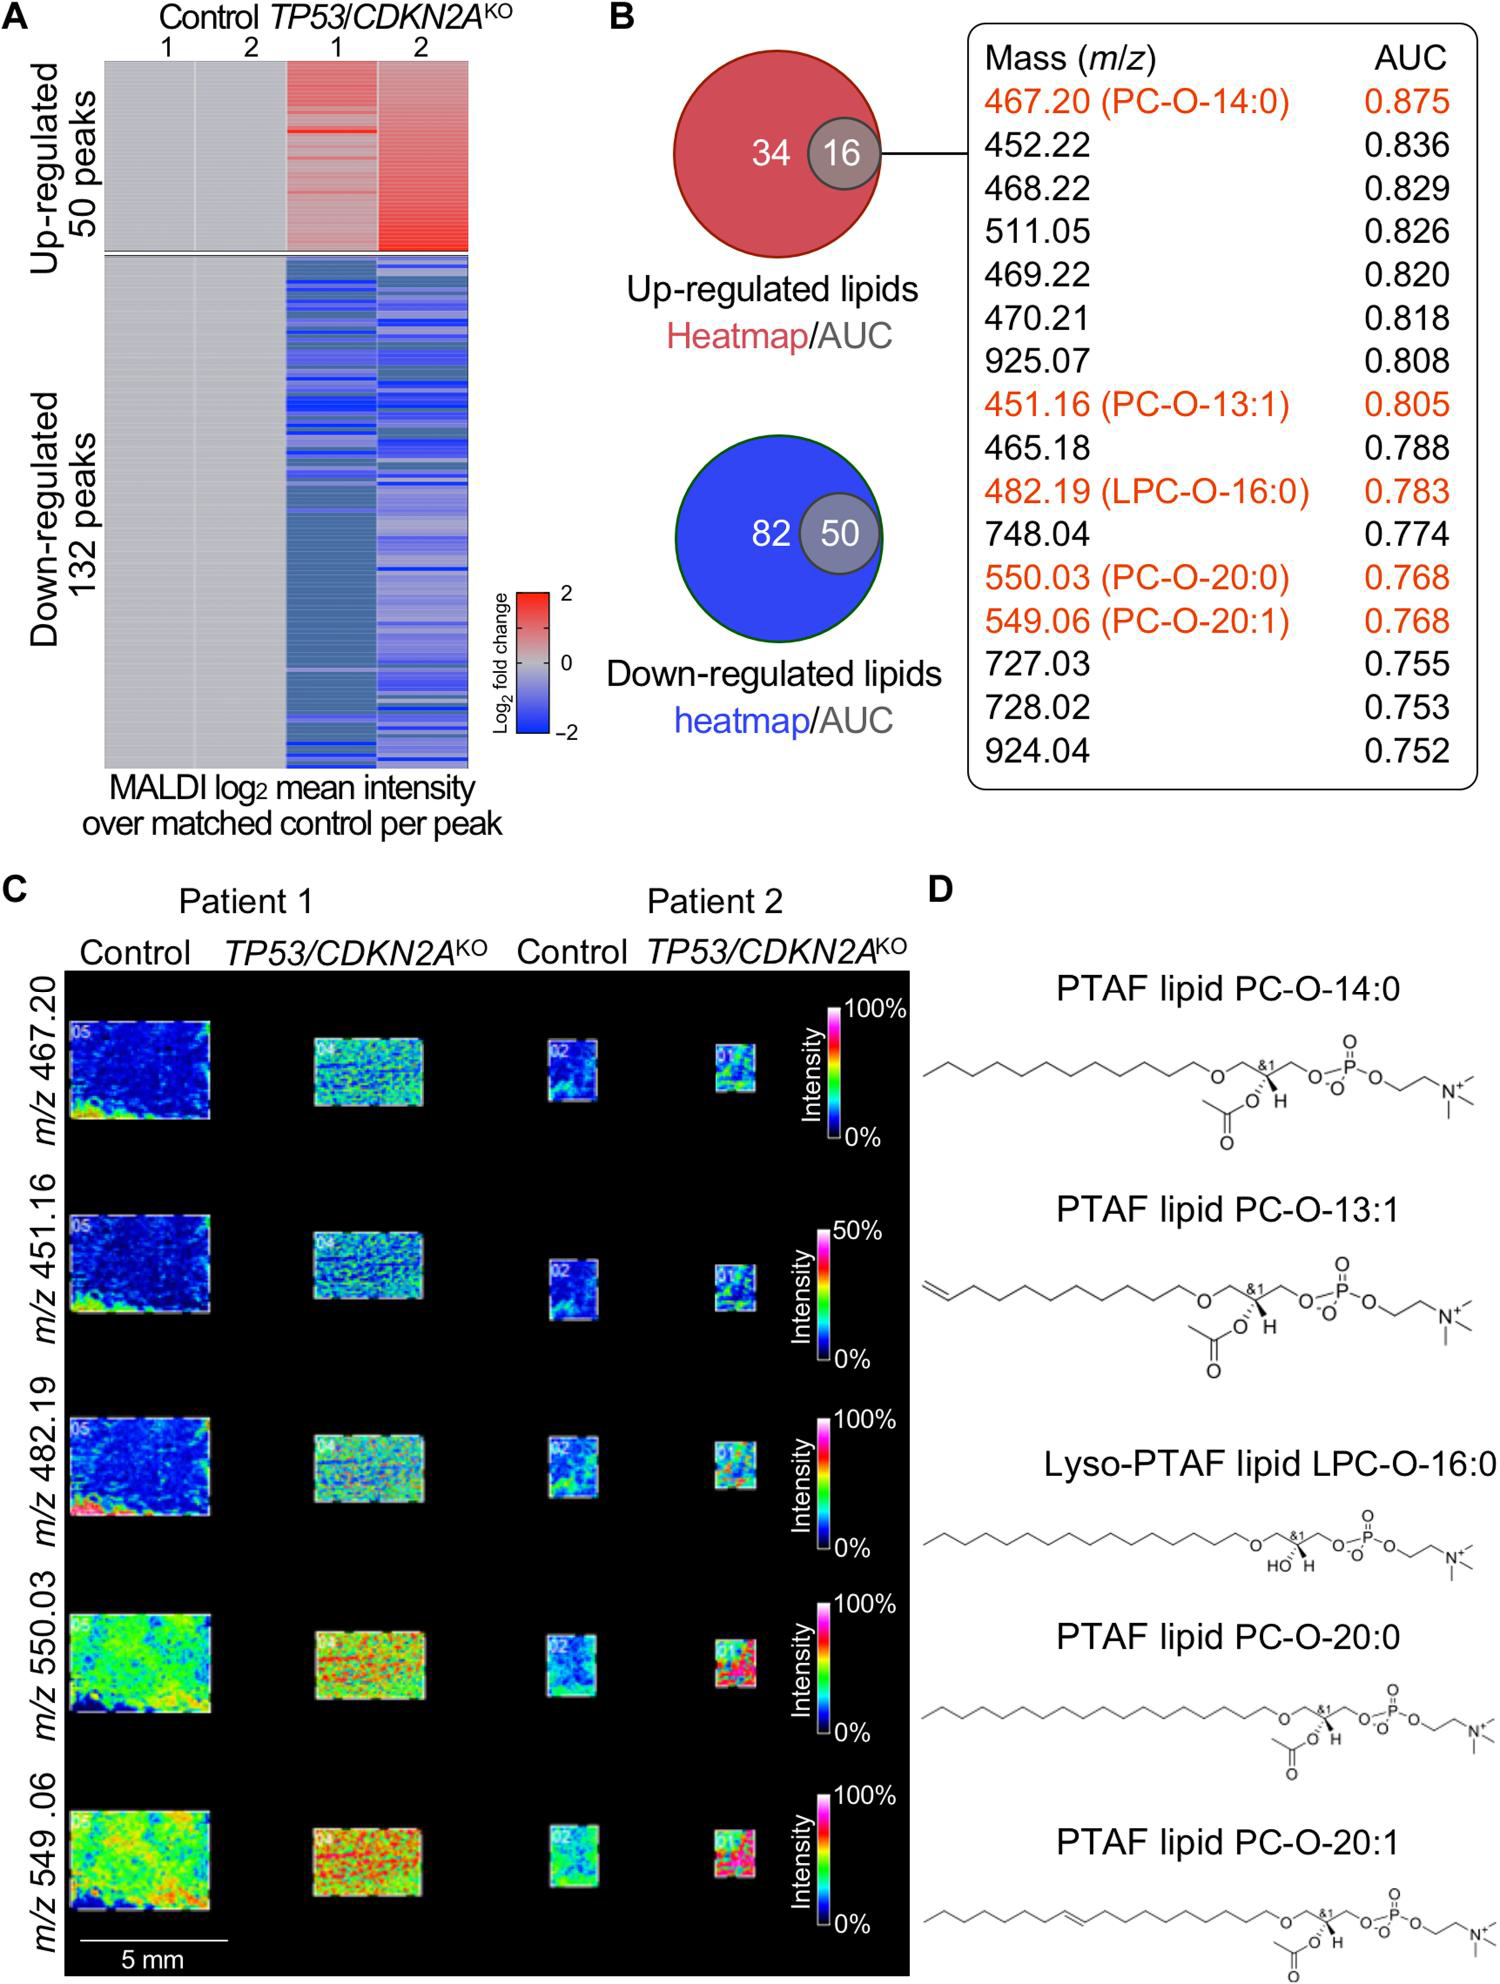
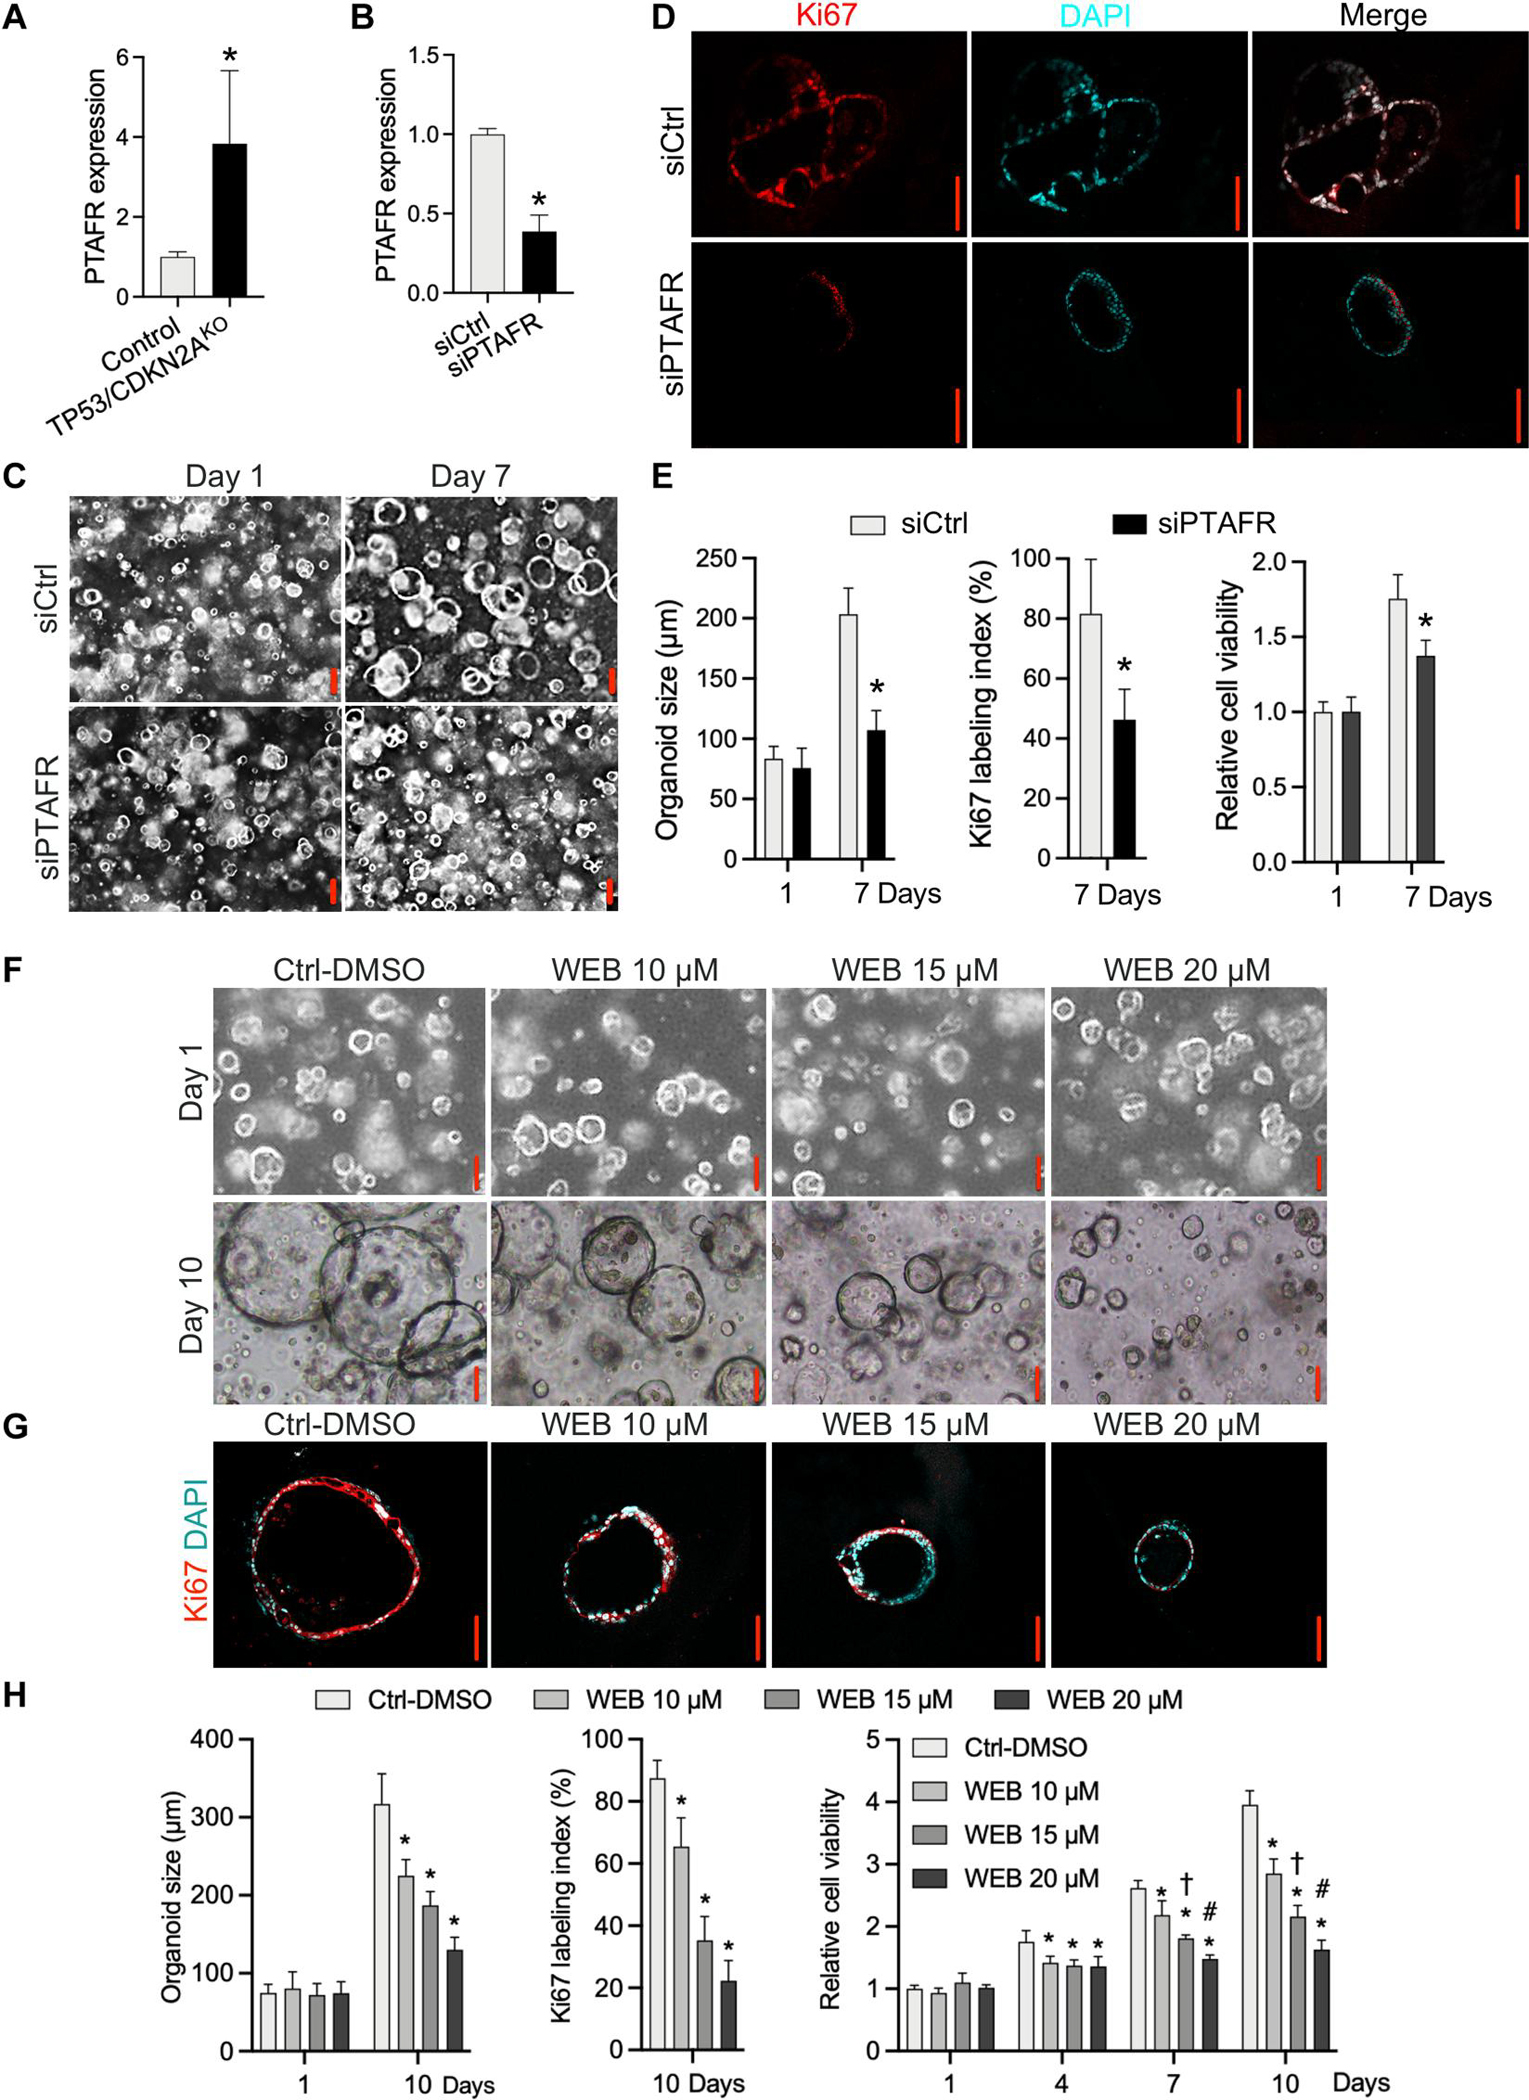
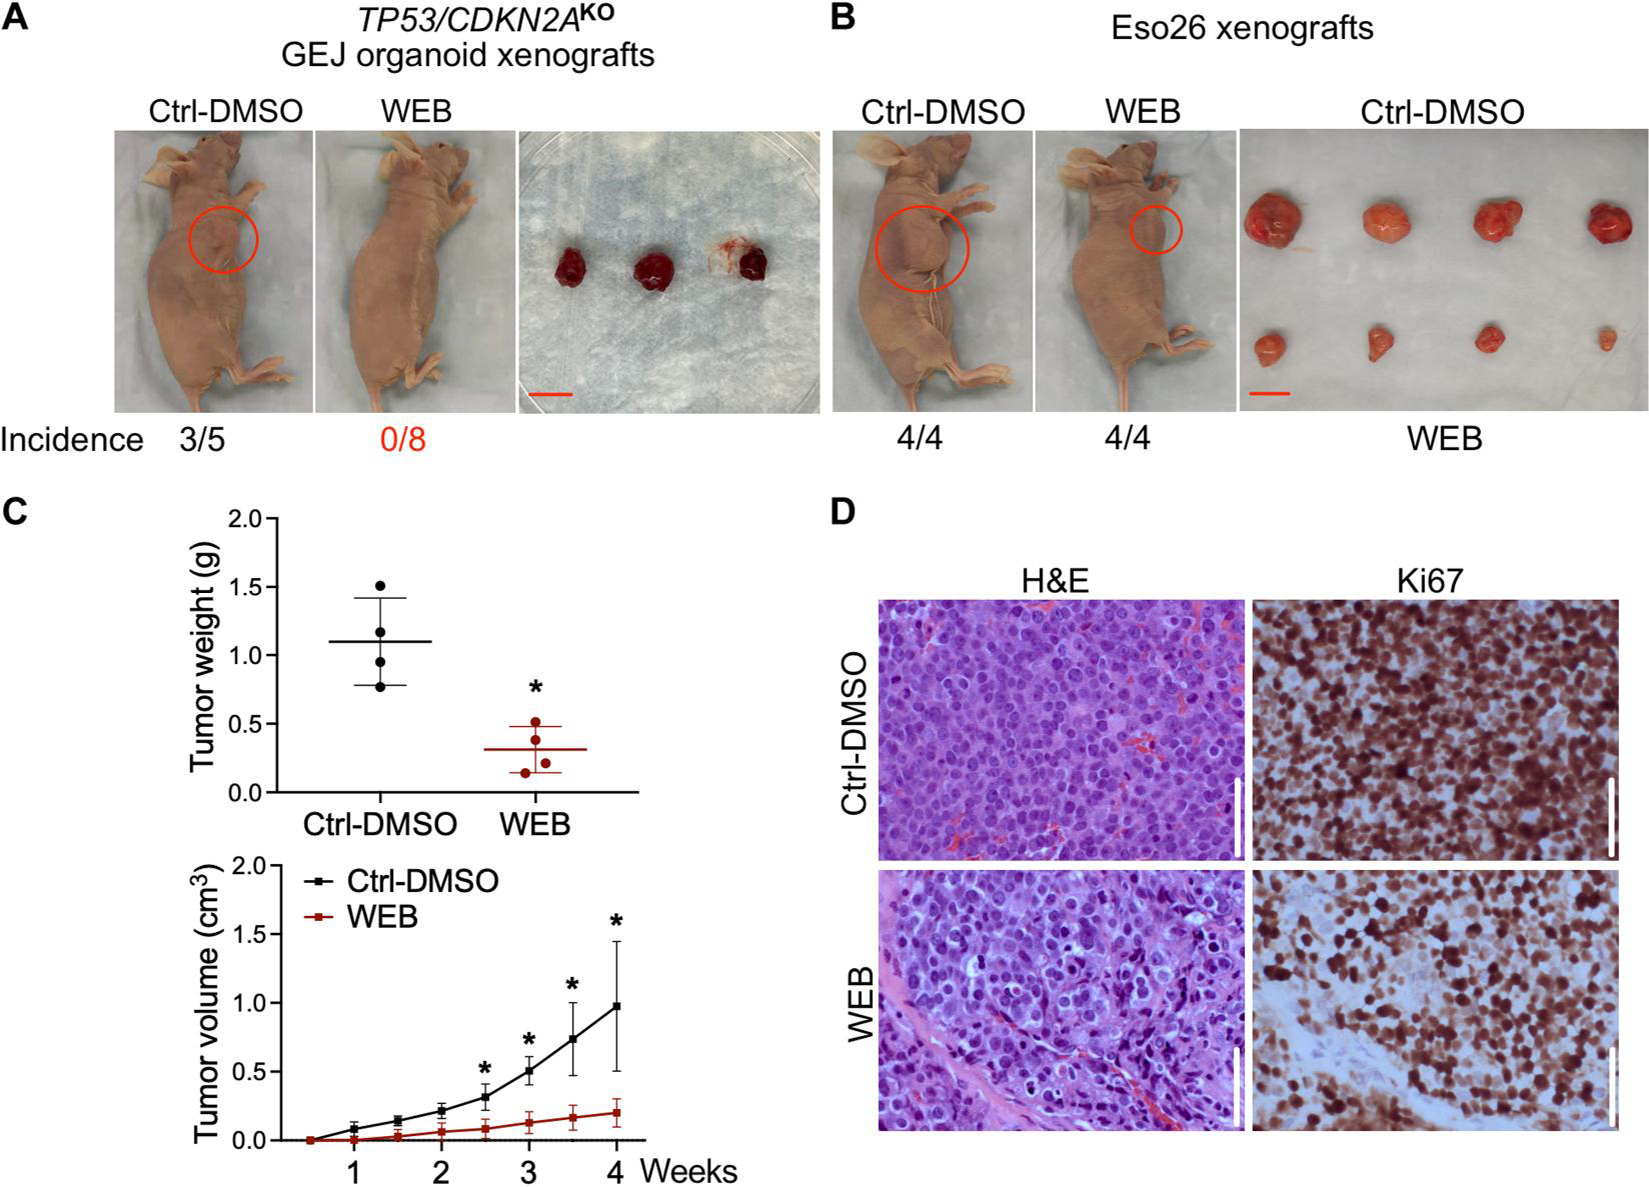
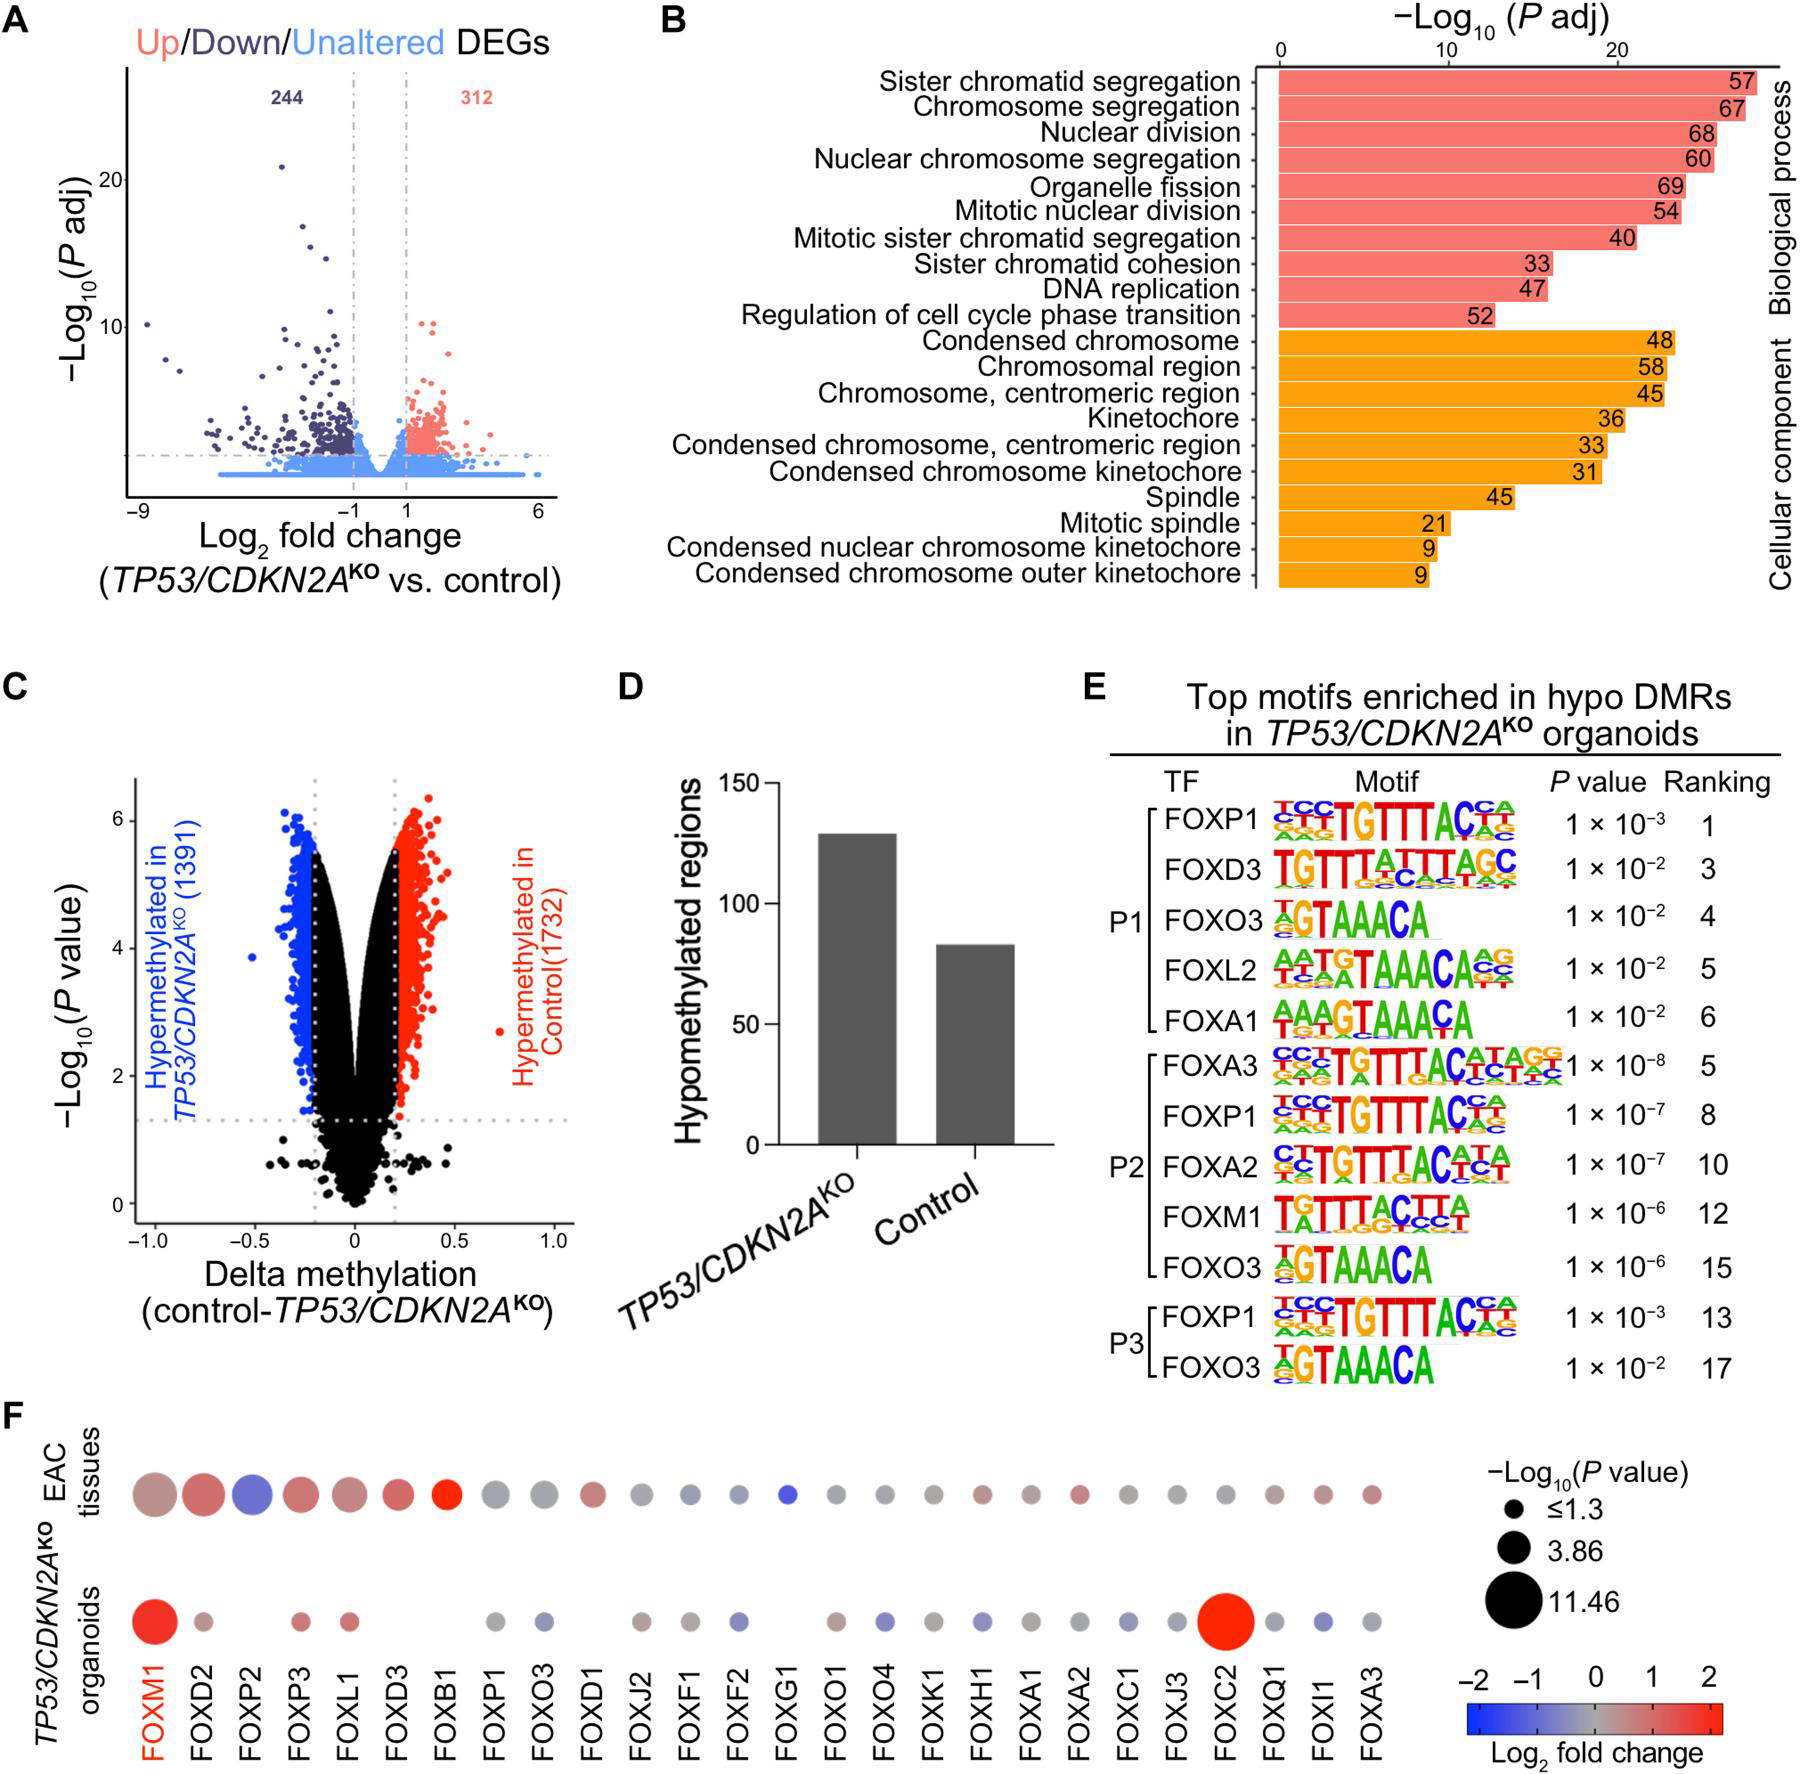
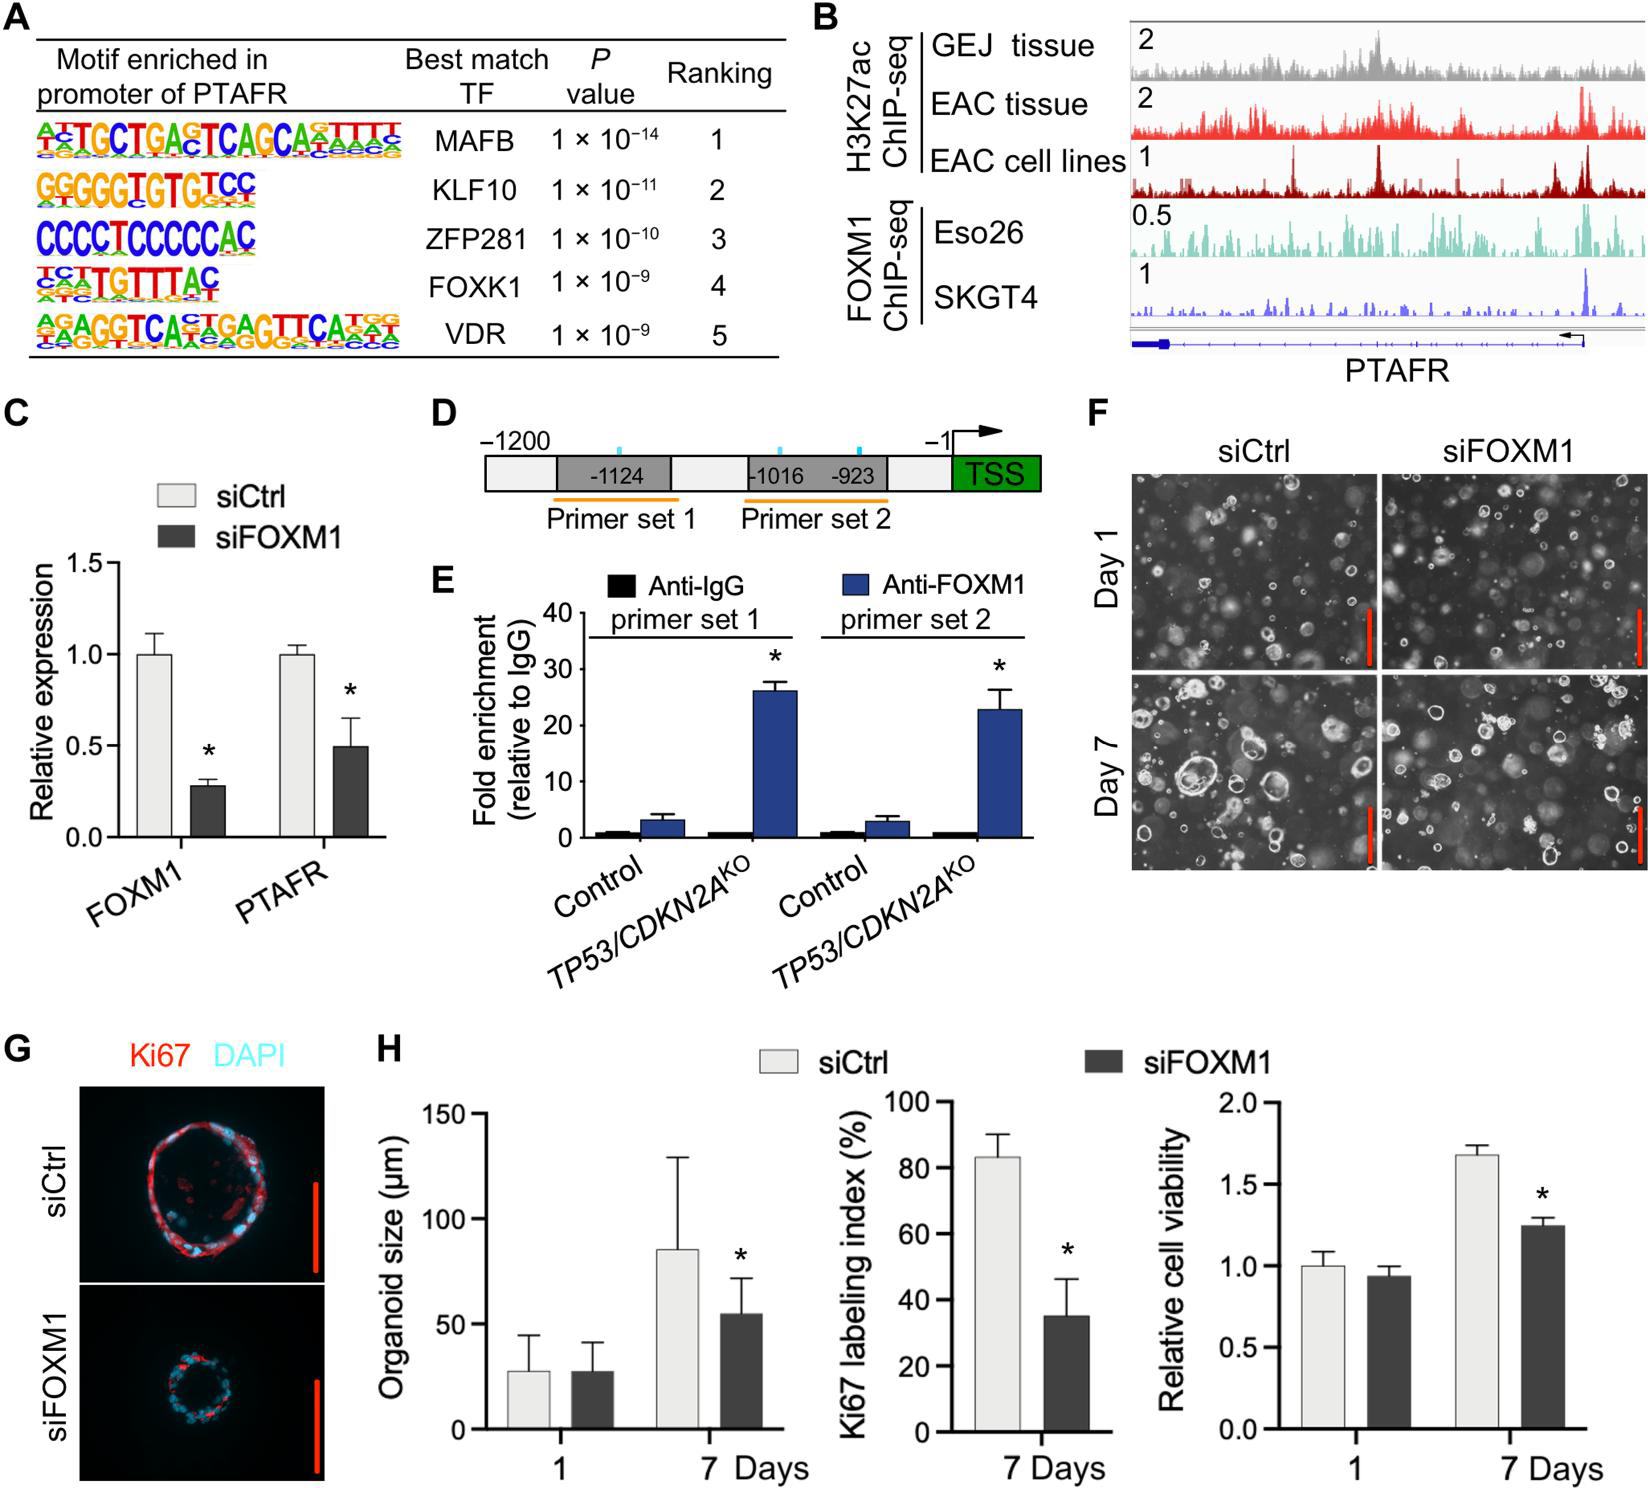
Inactivation of the tumor suppressor genes tumor protein p53 (TP53) and cyclin-dependent kinase inhibitor 2A (CDKN2A) occurs early during gastroesophageal junction (GEJ) tumorigenesis. However, because of a paucity of GEJ-specific disease models, cancer-promoting consequences of TP53 and CDKN2A inactivation at the GEJ have not been characterized. Here, we report the development of a wild-type primary human GEJ organoid model and a CRISPR-edited transformed GEJ organoid model. CRISPR-Cas9-mediated TP53 and CDKN2A knockout (TP53/CDKN2AKO) in GEJ organoids induced morphologic dysplasia and proneoplastic features in vitro and tumor formation in vivo. Lipidomic profiling identified several platelet-activating factors (PTAFs) among the most up-regulated lipids in CRISPR-edited organoids. PTAF/PTAF receptor (PTAFR) abrogation by siRNA knockdown or a pharmacologic inhibitor (WEB2086) reduced proliferation and other proneoplastic features of TP53/CDKN2AKO GEJ organoids in vitro and tumor formation in vivo. In addition, murine xenografts of Eso26, an established human esophageal adenocarcinoma cell line, were suppressed by WEB2086. Mechanistically, TP53/CDKN2A dual inactivation disrupted both the transcriptome and the DNA methylome, likely mediated by key transcription factors, particularly forkhead box M1 (FOXM1). FOXM1 activated PTAFR transcription by binding to the PTAFR promoter, further amplifying the PTAF-PTAFR pathway. Together, these studies established a robust model system for investigating early GEJ neoplastic events, identified crucial metabolic and epigenomic changes occurring during GEJ model tumorigenesis, and revealed a potential cancer therapeutic strategy. This work provides insights into proneoplastic mechanisms associated with TP53/CDKN2A inactivation in early GEJ neoplasia, which may facilitate early diagnosis and prevention of GEJ neoplasms.


Conflict of interest statement

Competing interests: The authors have filed a provisional patent application (JHU Ref. C17281, P17281-01, or CJ Ref. 40856.101) related to the study. The authors declare that they have no other competing interests.

Figures

Fig. 1.
Fig. 1.. Establishment and characterization of human normal GEJ organoids.
(A) A workflow of organoid generation from human primary endoscopic GEJ biopsies. Biopsies of normal GEJ mucosa were taken by upper endoscopy and then minced and enzymatically dissociated. The cell suspension was mixed with Matrigel to initiate 3D organoid culture in the conditioned medium. (B to D) GEJ organoids were analyzed for structural and growth properties at the indicated time points. 3D organoids were photomicrographed under phase-contrast microscopy (B, top) and collected for H&E staining (B, bottom). Scale bars, 50 μm. Average organoid size (C) and viability (D) were determined at each time point. Data are represented as means ± SD; n = 6 biological replicates. *P < 0.05 versus day 1; #P < 0.05 versus day 14; not significant (ns) versus day 24 by ANOVA.
Fig. 2.
Fig. 2.. Knockout of TP53/CDKN2A promotes neoplastic transformation in human normal GEJ organoids.
(A and B) Sanger sequencing of TP53/CDKN2AKO GEJ organoids showing 1-bp insertion or deletion in TP53 (A) or CDKN2A (B). Red font indicates corresponding frameshift indels in the genomic DNA. (C and D) On the 10th day after seeding 1 × 10⁵ dissociated organoid cells, organoid cultures were photomicrographed using phase-contrast microscopy and collected for (C) bright-field, H&E, and (D) IF staining for Ki67 (red color). DAPI, 4′,6-diamidino-2-phenylindole. (E) Average organoid size, organoid-forming efficiency, and Ki67 index were determined by measuring >50 organoids. Data are represented as means ± SD; n = 4 biologic replicates. *P < 0.05 by Student’s t test. (F) Representative images of xenografts from mice injected with control or TP53/CDKN2AKO GEJ organoids; the underlying table shows incidence and tumor characteristics. This experiment was repeated once with similar results. (G) Representative H&E and AE1/AE3 pan-keratin IHC staining (brown) in xenografts arising from TP53/CDKN2AKO organoids. White arrows, mitoses; white circles, abnormally large, pleomorphic cells with irregular nuclear envelopes; scale bars, 100 μm.
Fig. 3.
Fig. 3.. PTAF lipids are increased in TP53/CDKN2AKO as compared to control GEJ organoids.
MALDI imaging–based lipidomic analysis was performed on independent paired sets of TP53/CDKN2AKO versus control GEJ organoids derived from two different patients. (A) Heatmap of discriminative lipid peaks (m/z) with a cutoff of m/z >450, a mean absolute fold change value of >1.5, and an individual absolute fold change of >1.2 in each TP53/CDKN2AKO organoids, compared with matched control. (B) Venn diagrams represent the overlap of up-regulated and down-regulated lipids based on AUC and heatmap results. Sixteen overlapping up-regulated lipids and AUC values are listed. (C) MALDI imaging and (D) corresponding chemical structures of representative PTAF lipids in TP53/CDKN2AKO organoids.
Fig. 4.
Fig. 4.. Blockade of PTAF/PTAFR inhibits growth and proliferation of TP53/CDKN2AKO GEJ organoids.
(A) mRNA expression of PTAFR in TP53/CDKN2AKO versus control GEJ organoids. (B) Knockdown of PTAFR mRNA by siRNAs in TP53/CDKN2AKO GEJ organoids. (C) Organoids treated with control silencing RNA (siCtrl) and PTAFR silencing RNA (siPTAFR) were photomicrographed under phase-contrast microscopy and collected for (D) Ki67 IF staining. (E) Average organoid size and Ki67 labeling index were quantified, and cell viability was determined by WST-1 assays at indicated time points. *P < 0.05 versus same-day siCtrl. Scale bars, 100 μm. (F to H) TP53/CDKN2AKO GEJ organoids were treated with vehicle control (0.1% DMSO) or a specific PTAFR pharmacologic antagonist, WEB2086, at various concentrations. Average organoid size in bright-field (F) and Ki67 IF images (G) and cell viability (H) were determined by phase-contrast imaging and WST-1 assays, respectively. (G) Ki67 labeling images and quantification (H) were obtained on day 10. Scale bars, 100 μm. Data are represented as means ± SD; n = 4 biological replicates. *P < 0.05 versus Ctrl-DMSO on the same day; †P < 0.05 versus WEB 10 μM on the same day; #P < 0.05 versus WEB 15 μM on the same day by ANOVA.
Fig. 5.
Fig. 5.. Blocking the PTAF/PTAFR pathway inhibits in vivo tumorigenesis of TP53/CDKN2AKO GEJ organoids and Eso26 cells.
TP53/CDKN2AKO organoid cells or Eso26 cells (2 × 10⁶ cells per injection) were subcutaneously injected into the armpits of nude mice. After 3 days of inoculation, WEB2086 (5 mg/kg per day) or vehicle control (1.25% DMSO in PBS) was administered by intraperitoneal injection every 2 days for 3 weeks. (A) Xenograft images and incidence rates after WEB2086 treatment in TP53/CDKN2AKO GEJ organoids. Scale bar, 1 cm. This experiment was repeated once with similar results. (B) Xenograft images and incidence rates after WEB2086 treatment in Eso26 xenografts. Scale bar, 1 cm. (C) Tumor weight at week 4 and growth of Eso26 xenografts with and without WEB2086 treatment. Data are represented as means ± SD; n = 5. *P < 0.05 versus Ctrl-DMSO on the same day by Student’s t test. (D) H&E staining and Ki67 IHC in Eso26 xenografts. Scale bars, 100 μm.
Fig. 6.
Fig. 6.. DNA methylome and transcriptome profiling of TP53/CDKN2AKO GEJ organoids.
(A) A volcano plot showing differentially expressed genes (DEGs) in TP53/CDKN2AKO organoids versus control organoids. Data represent four biological replicates. (B) Gene ontology (GO) analysis identified top ranked key terms of biological processes and cellular components enriched in DEGs in TP53/CDKN2AKO versus control organoids. (C) A volcano plot showing differentially methylated CpGs (red hypermethylated in control and blue hypermethylated in TP53/CDKN2AKO) and (D) column plots showing DMRs in TP53/CDKN2AKO versus control organoids. (E) Top ranked transcription factor (TF) binding motifs from the forkhead box (FOX) family enriched in hypomethylated differentially methylated regions (DMRs) in TP53/CDKN2AKO versus control organoids. P values were calculated using the HOMER package. P1, patient 1; P2, patient 2; P3, patient 3. (F) Dot plots showing expression of FOX family TFs in TP53/CDKN2AKO versus control organoids (bottom dots, n = 4 biological replicates) and in EAC tumors (n = 88) versus normal GEJ samples (n = 9) from the TCGA (top dots). Genes are ranked on the basis of the −log10 (P value) comparing EAC tumors with normal GEJ samples. The dot size denotes −log10 (P value); color indicates log2 fold change; missing dots correspond to undetectable mRNA expressions.
Fig. 7.
Fig. 7.. PTAFR is a direct downstream target of FOXM1.
(A) Motif enrichment analysis of PTAFR promoter region in organoids. (B) ChIP-seq profiles for H3K27ac and FOXM1 at the PTAFR locus in indicated tissues and cell lines. All H3K27ac signals are shown at the same scale. (C) Relative expression of PTAFR mRNA after knockdown of FOXM1 by siRNAs in TP53/CDKN2AKO GEJ organoids. (D) Schematic of PTAFR transcriptional start site (TSS) (green) and upstream sequence. PCR primers for ChIP experiments (orange horizontal lines) and FOXM1 binding motifs (blue vertical lines) are indicated. (E) ChIP-qPCR detection of FOXM1 occupancy at the PTAFR promoter region in organoids using primer sets indicated in (D). ChIP was performed with either anti-FOXM1 or anti-IgG antibodies, and fold enrichment relative to anti-IgG is shown. Data are represented as means ± SD; n = 4 biologic replicates. *P < 0.05 versus control by ANOVA. (F) Organoids treated with siCtrl and siFOXM1 were photomicrographed under phase-contrast microscopy and collected for (G) Ki67 IF staining. (H) Average organoid size and Ki67 labeling index were quantified, and cell viability was determined by WST-1 assay. Scale bars, 100 μm. Data are represented as means ± SD; n = 4 biologic replicates. *P < 0.05 versus siCtrl on the same day by ANOVA.

References

    1. Sung H, Ferlay J, Siegel RL, Laversanne M, Soerjomataram I, Jemal A, Bray F, Global Cancer Statistics 2020: GLOBOCAN estimates of incidence and mortality worldwide for 36 cancers in 185 countries. CA Cancer J. Clin. 71, 209–249 (2021). - PubMed
    1. Bartel M, Brahmbhatt B, Bhurwal A, Incidence of gastroesophageal junction cancer continues to rise: Analysis of Surveillance, Epidemiology, and End Results (SEER) database. J. Clin. Orthod. 37, 40 (2019).
    1. Lo YH, Karlsson K, Kuo CJ, Applications of organoids for cancer biology and precision medicine. Nat. Cancer 1, 761–773 (2020). - PMC - PubMed
    1. Kim J, Koo BK, Knoblich JA, Human organoids: Model systems for human biology and medicine. Nat. Rev. Mol. Cell Biol. 21, 571–584 (2020). - PMC - PubMed
    1. Snaebjornsson MT, Janaki-Raman S, Schulze A, Greasing the wheels of the cancer machine: The role of lipid metabolism in cancer. Cell Metab. 31, 62–76 (2020). - PubMed

Publication types

Substances