. 2022 Nov 29;41(9):111717.
doi: 10.1016/j.celrep.2022.111717.

Interpretable deep learning translation of GWAS and multi-omics findings to identify pathobiology and drug repurposing in Alzheimer's disease

Affiliations

Interpretable deep learning translation of GWAS and multi-omics findings to identify pathobiology and drug repurposing in Alzheimer's disease

Jielin Xu et al. Cell Rep. .

Abstract

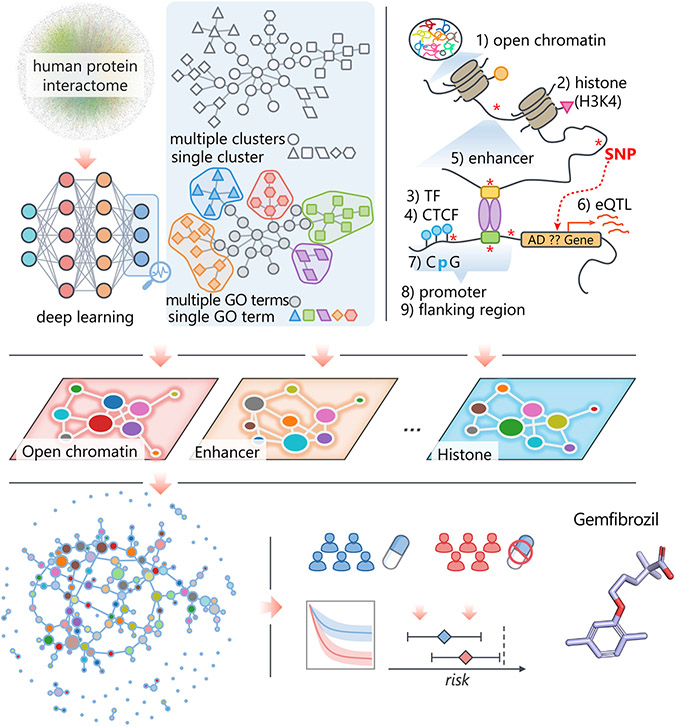
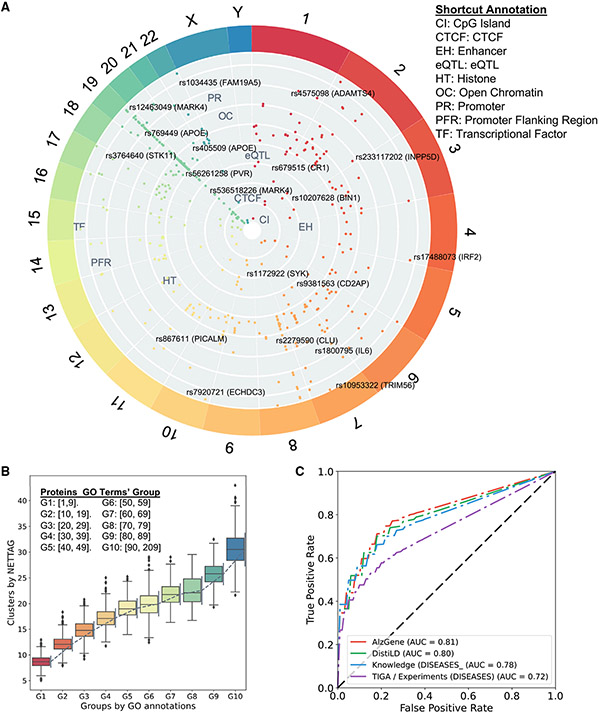
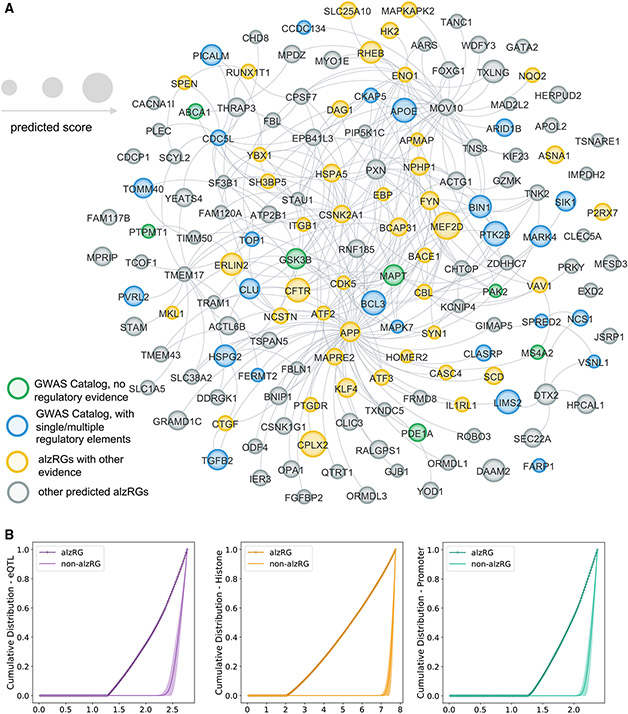
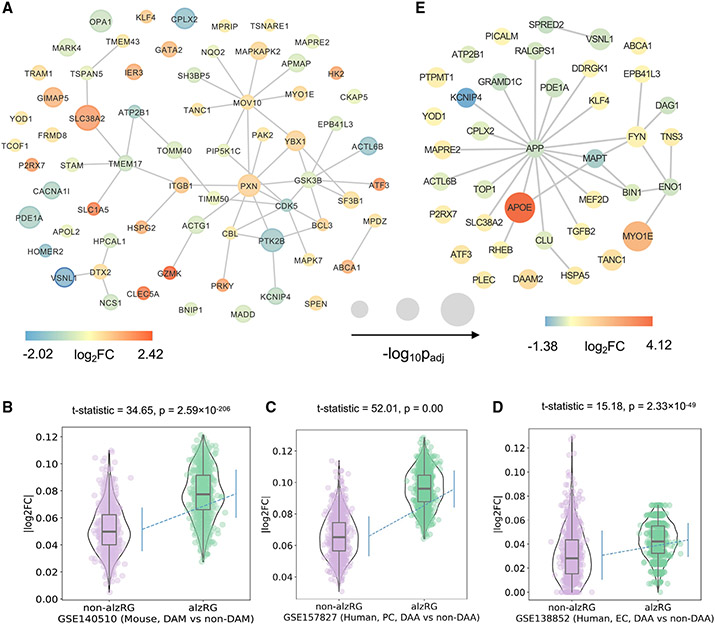
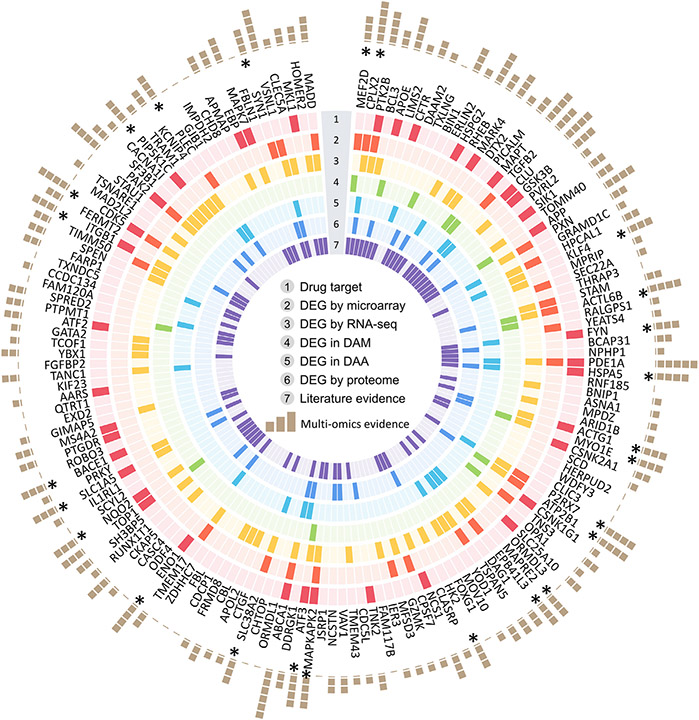
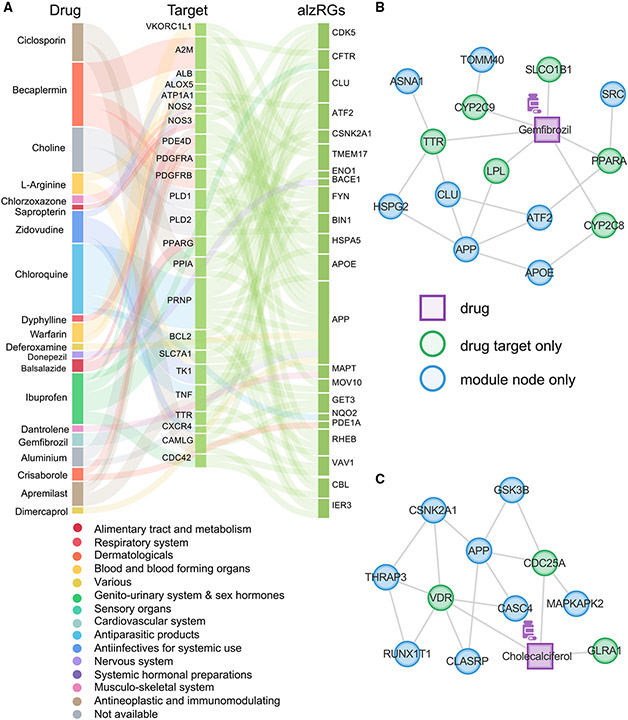
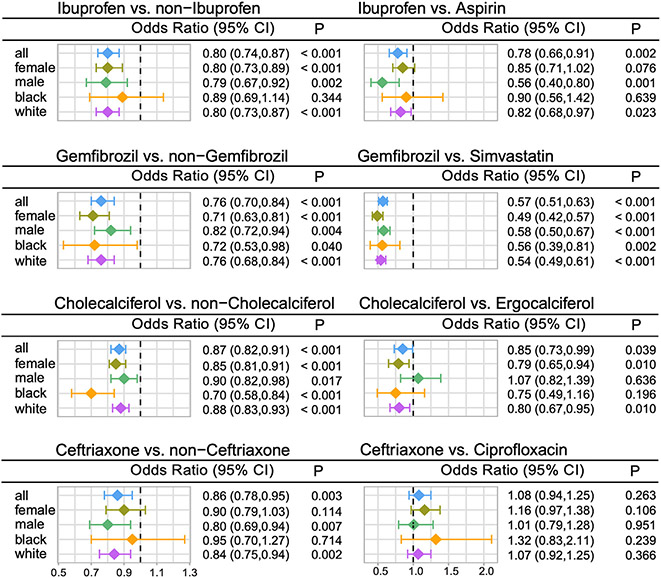
Translating human genetic findings (genome-wide association studies [GWAS]) to pathobiology and therapeutic discovery remains a major challenge for Alzheimer's disease (AD). We present a network topology-based deep learning framework to identify disease-associated genes (NETTAG). We leverage non-coding GWAS loci effects on quantitative trait loci, enhancers and CpG islands, promoter regions, open chromatin, and promoter flanking regions under the protein-protein interactome. Via NETTAG, we identified 156 AD-risk genes enriched in druggable targets. Combining network-based prediction and retrospective case-control observations with 10 million individuals, we identified that usage of four drugs (ibuprofen, gemfibrozil, cholecalciferol, and ceftriaxone) is associated with reduced likelihood of AD incidence. Gemfibrozil (an approved lipid regulator) is significantly associated with 43% reduced risk of AD compared with simvastatin using an active-comparator design (95% confidence interval 0.51-0.63, p < 0.0001). In summary, NETTAG offers a deep learning methodology that utilizes GWAS and multi-genomic findings to identify pathobiology and drug repurposing in AD.

Keywords: AD; Alzheimer’s disease; CP: Neuroscience; EHR; GWAS; deep learning; drug repurposing; drug target; electronic health record; gemfibrozil; genome-wide association studies; multi-omics; pathobiology; protein-protein Interactome.


Conflict of interest statement

Declaration of interests J.C. has provided consultation to AB Science, Acadia, Alkahest, AlphaCognition, ALZPathFinder, Annovis, AriBio, Artery, Avanir, Biogen, Biosplice, Cassava, Cerevel, Clinilabs, Cortexyme, Diadem, EIP Pharma, Eisai, GatehouseBio, GemVax, Genentech, Green Valley, Grifols, Janssen, Karuna, Lexeo, Lilly, Lundbeck, LSP, Merck, NervGen, Novo Nordisk, Oligomerix, Ono, Otsuka, PharmacotrophiX, PRODEO, Prothena, ReMYND, Renew, Resverlogix, Roche, Signant Health, Suven, Unlearn AI, Vaxxinity, VigilNeuro pharmaceutical, assessment, and investment companies. J.B.L. has received consulting fees from consulting fees from Vaxxinity, grant support from GE Healthcare and serves on a Data Safety Monitoring Board for Eisai.

Figures

Figure 1.
Figure 1.. A diagram illustrating NETTAG
We first applied a deep learning model to capture the topological structure of the PPIs and divided it into multiple subnetwork modules (STAR Methods). Then we discovered that the divided subnetwork module could approximate protein functions annotated by the Gene Ontology (GO) knowledge portal (STAR Methods). Next, we predicted likely AD-risk genes (alzRGs), which are functionally similar to genes that have been identified by different gene regulatory elements, i.e., CpG island, CCCTC-binding factor (CTCF), enhancer, expression quantitative trait loci (eQTL), histone, open chromatin, promoter, promoter flanking region, and transcriptional factor(TF). Finally, we prioritize repurposed drugs (e.g., gemfibrozil) for potential AD treatment and identified supportive information with the large-scale patient longitudinal database (STAR Methods).
Figure 2.
Figure 2.. Gene regulatory landscape of AD GWAS loci
(A) Overview of AD GWAS loci across different chromosomes after considering nine gene regulatory elements: GpG island, CCCTC-binding factor (CTCF), enhancer, expression quantitative trait loci (eQTL), histone, open chromatin, promoter, promoter flanking region, and transcriptional factor (Table S1). (B) Proteins’ cluster numbers are positively correlated with their gene ontology (GO) annotation. We divide proteins into 10groups according to their GO terms. For example, G1 group include the proteins that have at least one, but less than ten GO annotation (Table S2). Error bars denote 1,000 randomly replicated experiments. (C) Receiver operating characteristic (ROC) analyses of NETTAG based on four collected AD-association gene sets, i.e., AlzGene, DistiLD, DISEASES (knowledge), and TIGA (STAR Methods; Table S2).
Figure 3.
Figure 3.. Observations of 156 prioritized AD-risk genes (alzRGs) by NETTAG
(A) Network-based visualization of 156 predicted alzRGs. 139 alzRGs are non-isolated and form a subnetwork with 294 protein-protein interactions (PPIs). Prioritized alzRGs are colored with various evidence. Green genes are the ones identified by GWAS Catalog but with no gene regulatory element evidence. Blue genes are the ones identified by GWAS Catalog and simultaneously with single or multiple gene regulatory element evidence. Yellow genes are the predicted genes with other types of evidence, e.g., multi-omics or literature evidence. Gray genes are the rest of predicted alzRGs (Table S3). (B) Cumulative distributions of predicted scores with alzRGs and the same amount of random non-alzRGs with similar degree distribution (the human protein-protein interactome network) for expression quantitative trait loci (eQTLs), histones, and promoters, respectively.
Figure 4.
Figure 4.. Transcriptomics-based observation of 156 prioritized AD-risk genes (alzRGs) by NETTAG
(A) Visualization of 67 predicted alzRGs that are also DEGs according to human bulk RNA-seq studies with both late-stage AD (LAD) and control donors (STAR Methods). (B) Violin plots show alzRGs are more likely differentially expressed in disease-associated microglia (DAM) according to mouse single-nucleus (GEO: GSE140511; three mice for each group; 5xFAD, wild-type, Trem2 knockout 5xFAD, and Trem2 knockout wild type) RNA-seq datasets (unpaired t test, t test statistic = 34.65, p = 2.59 × 10−206, numbers of replicates = 1,000). (C) Violin plot shows alzRGs are more likely differentially expressed in disease-associated astrocyte (DAA) according to human prefrontal cortex single-nucleus (GEO: GSE157827; nine normal control and 12 AD human postmortem brain samples) RNA-seq dataset (unpaired t test, t test statistic = 52.01, p = 0.00, numbers of replicates = 1,000). (D) Violin plot shows alzRGs are more likely differentially expressed in DAA according to human entorhinal cortex (EC) single-nucleus (GEO: GSE138852; six control and six AD human postmortem brain samples) RNA-seq dataset (unpaired t test, t test statistic = 15.18, p = 2.33 × 10−49, numbers of replicates = 1,000). (E) Visualization of 32 predicted alzRGs that are also differentially expressed genes (DEGs) according to single-cell/nucleus RNA-seq studies collected from both mouse models and human postmortem brain tissues in two disease-associated immune subtypes, i.e., DAM and DAA (STAR Methods).
Figure 5.
Figure 5.. Multi-omics observations of 156 prioritized AD-risk genes (alzRGs) by NETTAG
Summary of multi-omics validations for all 156 predicted alzRGs (Table S3 and S4). The genes are sorted in predicted score decreasing order (clockwise direction). We have collected seven types of evidence, including drug target, differentially expressed genes (DEG) by microarray studies, DEG by bulk RNA-seq studies, DEG in disease-associated microglia (DAM), DEG in disease-associated astrocyte (DAA), DEG by proteome studies, and literature evidence. There are 126 predicted alzRGs that could be proved as associated with AD with at least one type of evidence.
Figure 6.
Figure 6.. Network-based discovery of repurposable drug candidates for AD
Drug-AD associations were evaluated by the network proximity between predicted alzRGs and drug-target networks. (A) 118 prioritized drugs for AD treatment (Table S5). Drugs are grouped by fourteen different classes (e.g., immunological, respiratory, neurological, cardiovascular, and cancer) defined by the first level of the Anatomical Therapeutic Chemical (ATC) codes. (B) Proposed mechanism of actions (MOAs) for gemfibrozil by drug-target network analysis. (C) Proposed MOAs for cholecalciferol by drug-target network analysis.
Figure 7.
Figure 7.. Longitudinal patient data observations reveal that usage of four candidate drugs is associated with reduced incidence of Alzheimer’s disease (AD)
Odds ratios (ORs) and 95% confidence intervals (CIs) for eight drug cohort comparator studies are presented. Within each study, besides the overall group analysis (all), we also conducted four additional subgroup analyses by considering sex (female and male) and race (Black and White). Propensity score (PS)-stratified Cox proportional hazards models were used for statistical inference (Fisher’s exact test) of the ORs. For overall group analysis, the patient numbers in each group are ibuprofen (n = 712,103) vs. non-ibuprofen (n = 2,468,008); ibuprofen (n = 712,103) vs. aspirin (n = 474,110); gemfibrozil (n = 72,691) vs. non-gemfibrozil (n = 3,107,420); gemfibrozil (n = 72,691) vs. simvastatin (n = 119,949); cholecalciferol (n = 447,846) vs. non-cholecalciferol (n = 2,732,265); cholecalciferol (n = 447,846) vs. ergocalciferol (n = 235,993); ceftriaxone (n = 91,192) vs. non-ceftriaxone (n = 3,088,919); ceftriaxone (n = 91,192) vs. ciprofloxacin (n = 248,724); Table S6D summarizes more detailed patient counts and event counts in each drug cohort design. Table S6A summarizes detailed clinical characteristics of patients used for each subgroup comparison.

References

    1. Zilka N, and Novak M (2006). The tangled story of Alois Alzheimer. Bratisl. Lek. Listy 107, 343–345. - PubMed
    1. GBD 2019 Dementia Forecasting Collaborators (2022). Estimation of the global prevalence of dementia in 2019 and forecasted prevalence in 2050: an analysis for the Global Burden of Disease Study 2019. Lancet Public Health 7, e105–e125. 10.1016/S2468-2667(21)00249-8. - DOI - PMC - PubMed
    1. Hebert LE, Beckett LA, Scherr PA, and Evans DA (2001). Annual incidence of Alzheimer disease in the United States projected to the years 2000 through 2050. Alzheimer Dis. Assoc. Disord 15, 169–173. 10.1097/00002093-200110000-00002. - DOI - PubMed
    1. Alzheimer’s Association (2016). 2016 Alzheimer’s disease facts and figures. Alzheimers Dement. 12, 459–509. 10.1016/j.jalz.2016.03.001. - DOI - PubMed
    1. Kodamullil AT, Zekri F, Sood M, Hengerer B, Canard L, McHale D, and Hofmann-Apitius M (2017). Trial watch: tracing investment in drug development for Alzheimer disease. Nat. Rev. Drug Discov 16, 819. 10.1038/nrd.2017.169. - DOI - PubMed

Publication types

LinkOut - more resources