. 2023 Jan;613(7945):721-728.
doi: 10.1038/s41586-022-05569-1. Epub 2022 Nov 30.

Undecaprenyl phosphate translocases confer conditional microbial fitness

Affiliations

Undecaprenyl phosphate translocases confer conditional microbial fitness

Brandon Sit et al. Nature. 2023 Jan.

Abstract

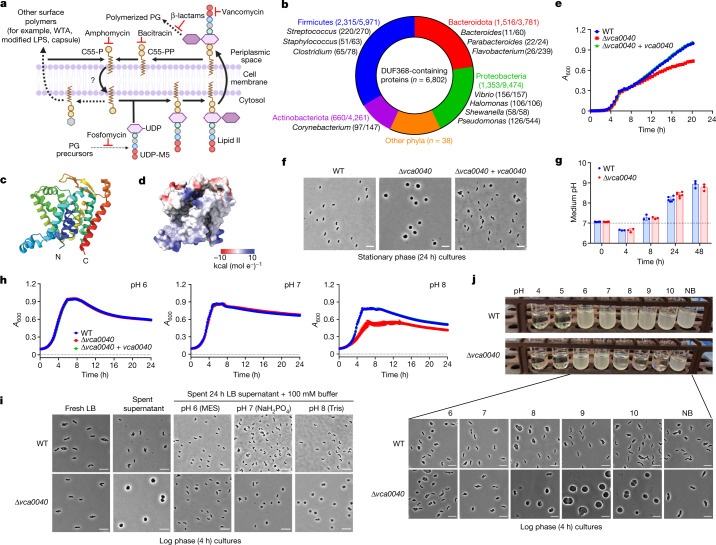
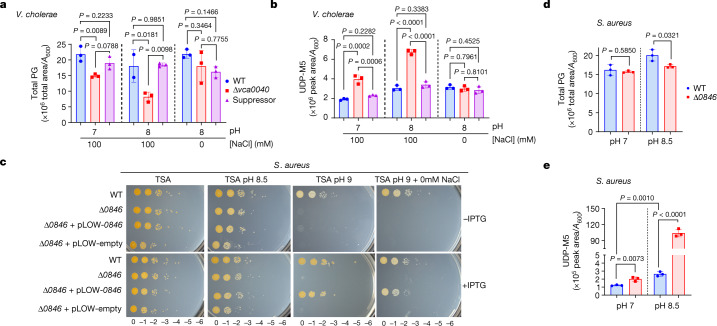
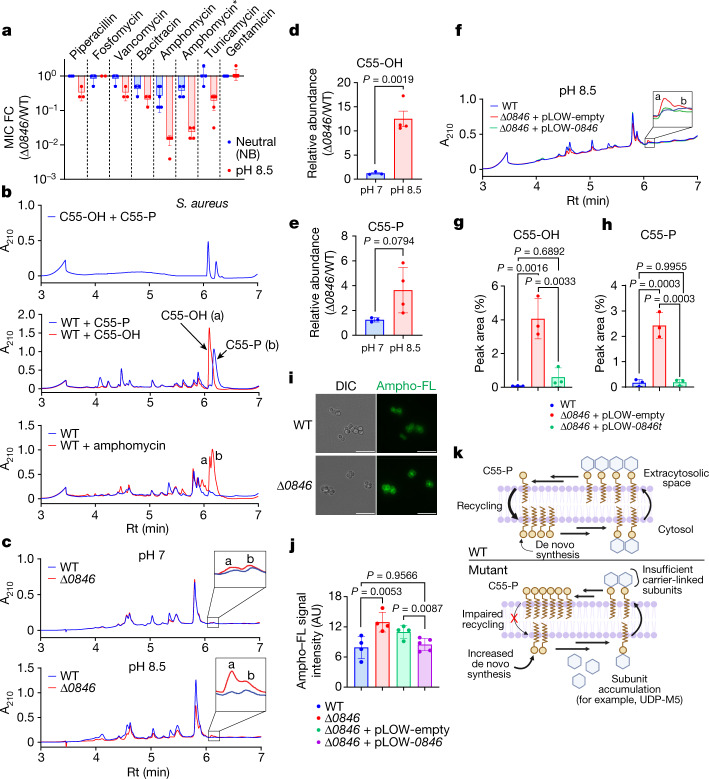
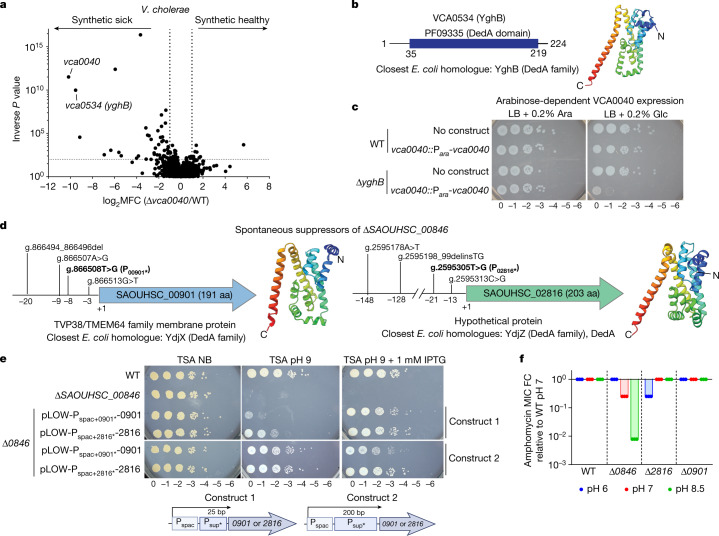
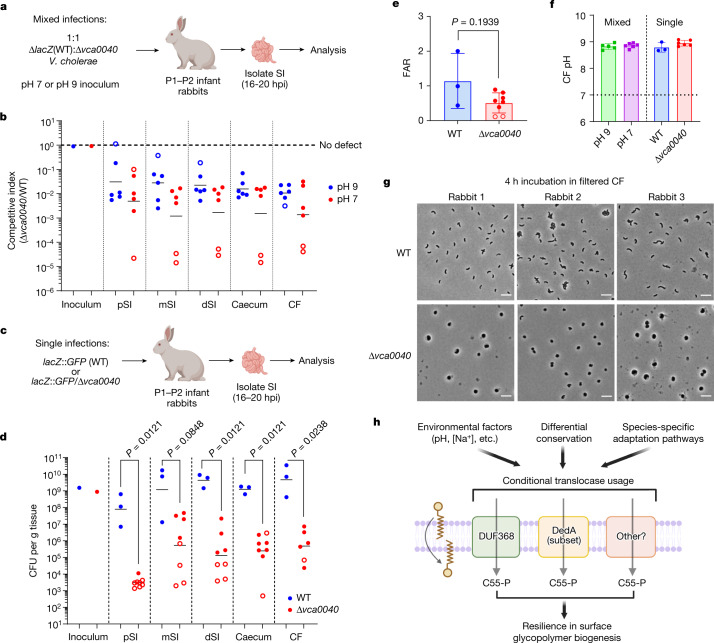
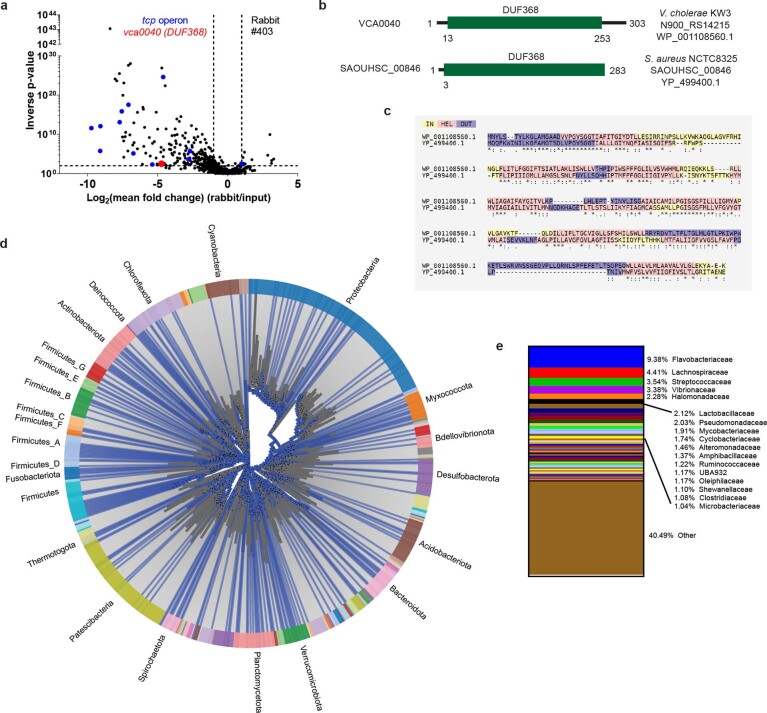
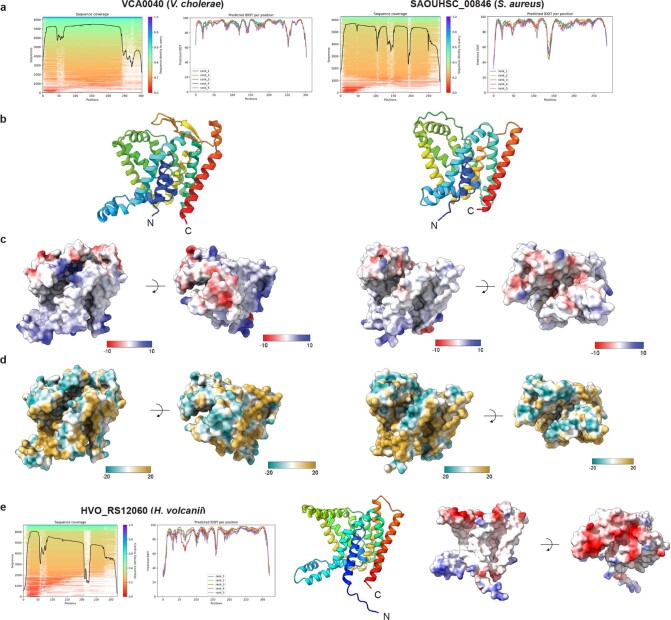
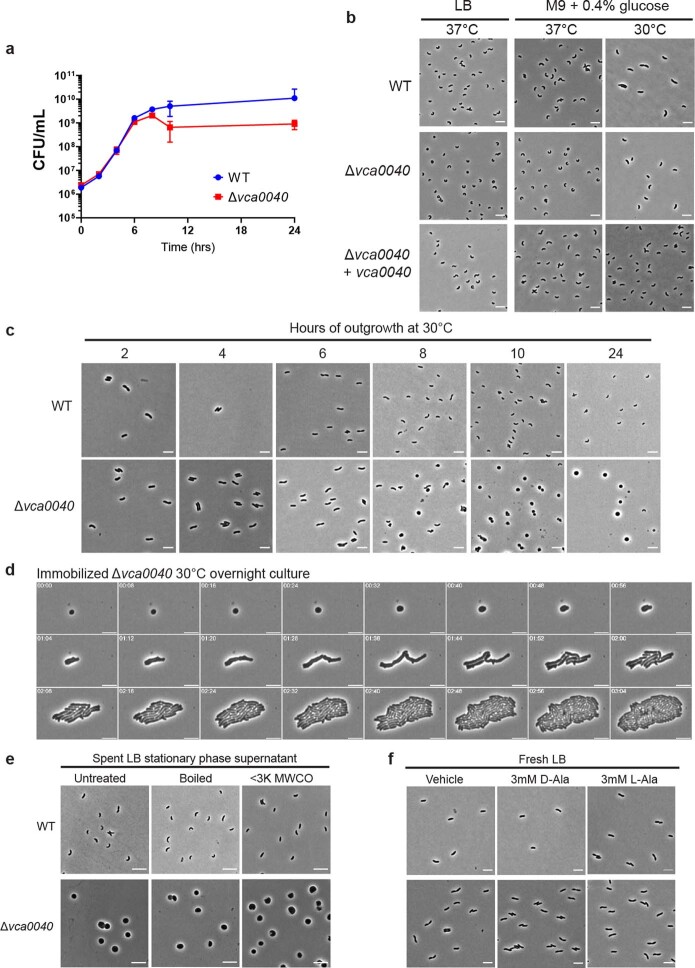
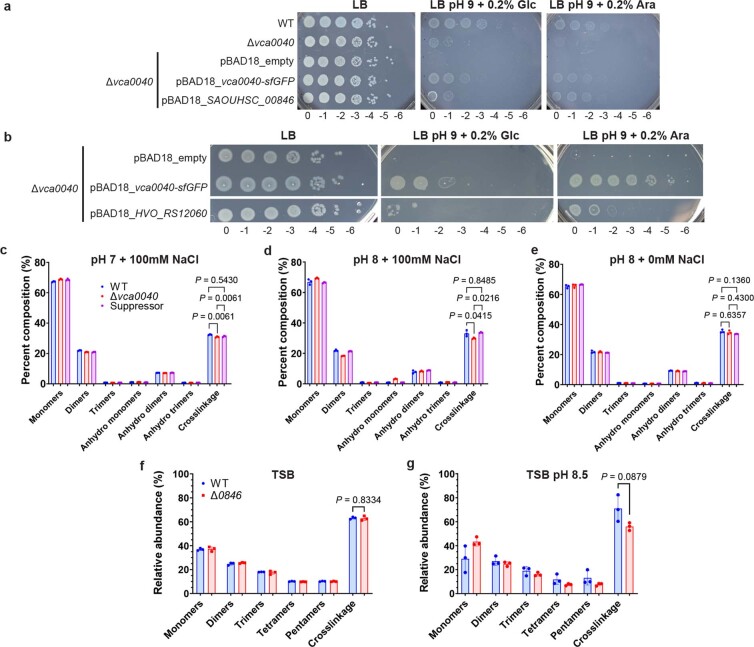
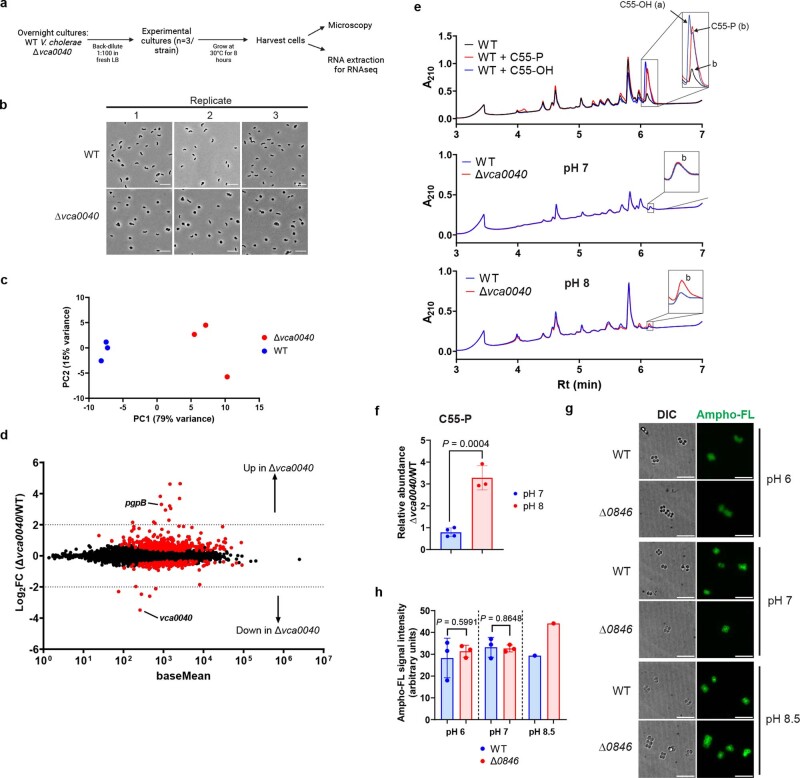
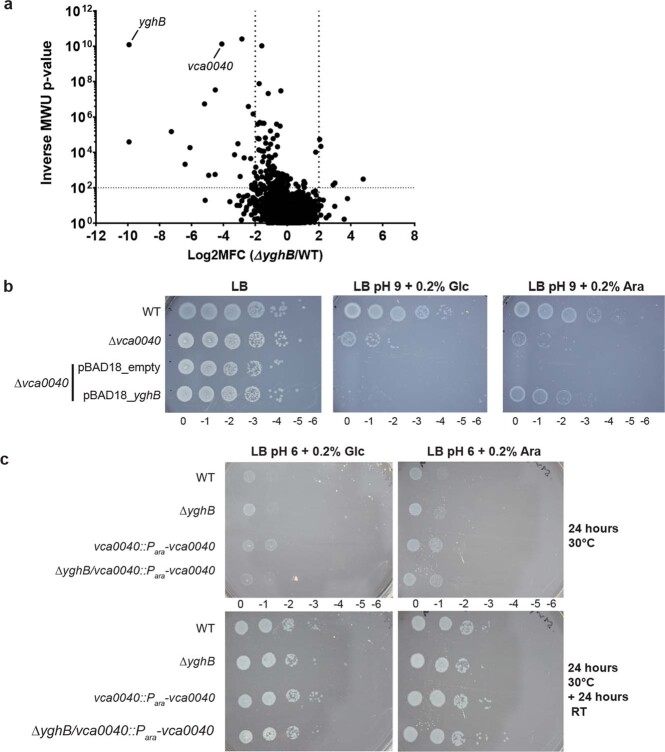
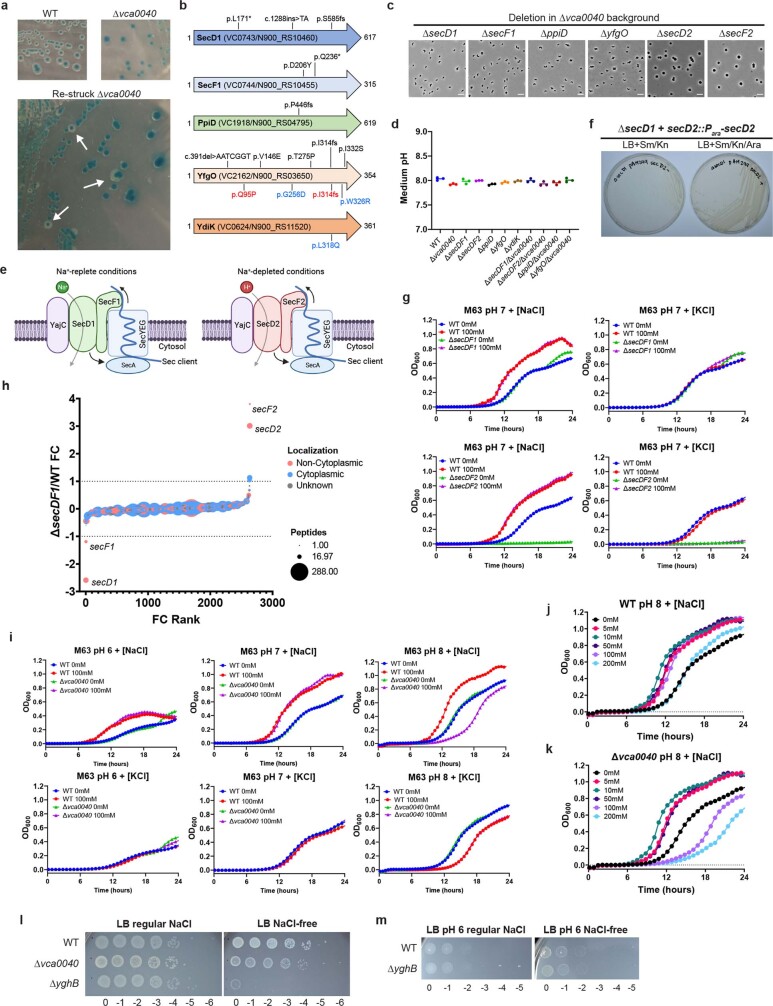
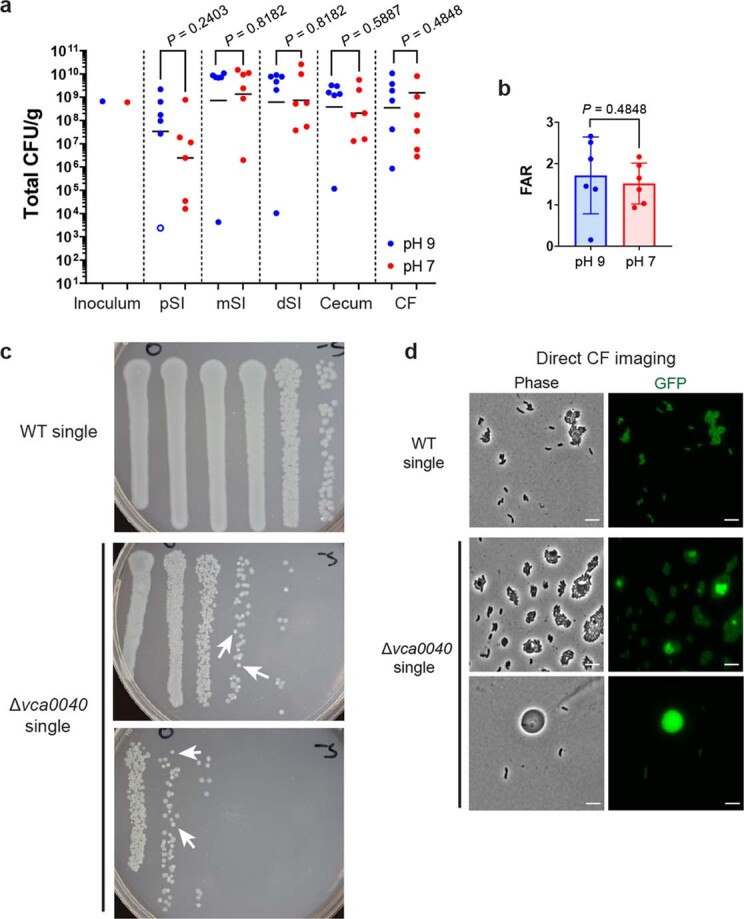
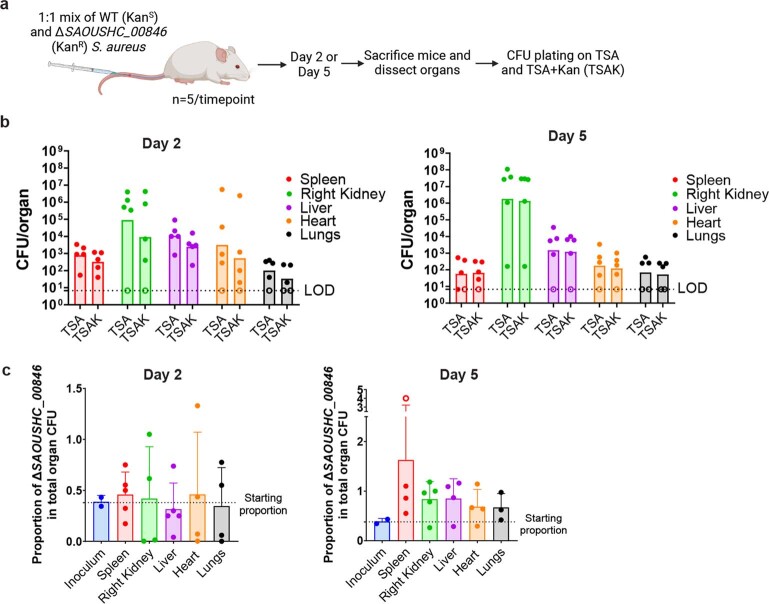
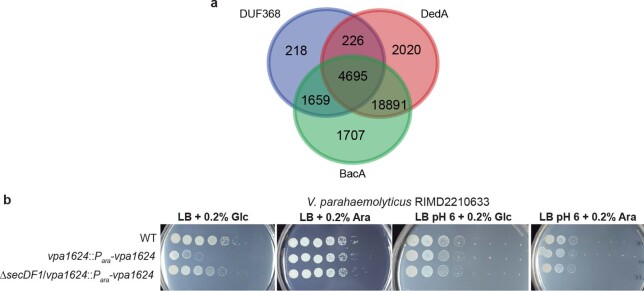
The microbial cell wall is essential for maintenance of cell shape and resistance to external stressors1. The primary structural component of the cell wall is peptidoglycan, a glycopolymer with peptide crosslinks located outside of the cell membrane1. Peptidoglycan biosynthesis and structure are responsive to shifting environmental conditions such as pH and salinity2-6, but the mechanisms underlying such adaptations are incompletely understood. Precursors of peptidoglycan and other cell surface glycopolymers are synthesized in the cytoplasm and then delivered across the cell membrane bound to the recyclable lipid carrier undecaprenyl phosphate7 (C55-P, also known as UndP). Here we identify the DUF368-containing and DedA transmembrane protein families as candidate C55-P translocases, filling a critical gap in knowledge of the proteins required for the biogenesis of microbial cell surface polymers. Gram-negative and Gram-positive bacteria lacking their cognate DUF368-containing protein exhibited alkaline-dependent cell wall and viability defects, along with increased cell surface C55-P levels. pH-dependent synthetic genetic interactions between DUF368-containing proteins and DedA family members suggest that C55-P transporter usage is dynamic and modulated by environmental inputs. C55-P transporter activity was required by the cholera pathogen for growth and cell shape maintenance in the intestine. We propose that conditional transporter reliance provides resilience in lipid carrier recycling, bolstering microbial fitness both inside and outside the host.


Conflict of interest statement

The authors declare no competing interests.

Figures

Fig. 1
Fig. 1. VCA0040 is required for cell shape maintenance of V. cholerae at alkaline pH.
a, Usage and recycling of C55-P in bacteria. Sites of antibiotic action relevant to Fig. 3 are indicated with red bars. Dashed arrows represent multiple enzymatic and/or transport steps. The grey hexagon represents variable sugars linked to C55-P for downstream glycopolymer assembly. LPS, lipopolysaccharide; PG, peptidoglycan. b, Conservation of DUF368 in selected bacterial phyla (upright) and genera (italic). The coloured segments and associated labels denote selected phyla with substantial DUF368 conservation. The fraction of sequenced unique clade genomes encoding a DUF368-containing protein is indicated. c,d, Predicted ribbon (c) and electrostatic surface coloured (d) structures of VCA0040. Colour scale, −10 to 10 kcal (mol e). e,f, Growth (e) and morphology (f) of wild-type (WT), Δvca0040 and Δvca0040 + vca0040 (chromosomally complemented) V. cholerae in LB medium. g, Medium pH of V. cholerae overnight LB cultures. h, V. cholerae growth in M9 medium buffered to the indicated pH. i, The effects of buffered spent supernatant (cell-free medium after 24 h of growth at 30 °C from a 1:1,000 culture) on V. cholerae morphology in log phase. j, The effects of pH on V. cholerae growth (top) and morphology (bottom) during log phase in LB medium buffered with 50 mM Na2HPO4. NB, unbuffered medium. e,g,h, Data are mean ± s.d. from n = 3 cultures per strain or condition. f,i,j, Representative images from n = 3 cultures per strain or condition. Scale bars, 3 μm (f) and 5 μm (i,j).
Fig. 2
Fig. 2. DUF368 function is conserved and necessary for peptidoglycan maintenance.
a,b, Total peptidoglycan (a) and intracellular UDP-M5 (b) in V. cholerae grown in M63 minimal medium at the indicated pH. Suppressor, Δvca0040/ΔsecDF1. c, Alkaline growth of ΔSAOUHSC_008460846) S. aureus in the indicated conditions and with the indicated expression vectors. Representative results from n = 3 independent experiments per condition. d,e, Total peptidoglycan (d) and intracellular UDP-M5 (e) in S. aureus grown in tryptic soy broth (TSB) with 100 mM bicine at the indicated pH. a,b,d,e, n = 3 cultures per strain or condition; data are mean ± s.d. a,b, One-way ANOVA with Tukey’s multiple comparison test. d,e, Unpaired Student’s two-tailed t-test.
Fig. 3
Fig. 3. C55-P recycling is impaired in bacteria lacking DUF368-containing proteins.
a, Fold change (FC) in MIC for ΔSAOUHSC_00846 S. aureus in the indicated conditions. Amphomycin*, amphomycin with 1 mM CaCl2. b, Ultra high performance liquid chromatography (UPLC) traces of purified C55-OH (a) and C55-P (b) standards (top), wild-type S. aureus lipid extracts spiked with each standard (middle) or wild-type S. aureus treated with 50 μg ml−1 amphomycin (bottom). Rt, retention time. c, UPLC traces of lipid extracts of wild-type or mutant S. aureus grown in TSB pH 7 (top) or pH 8.5 (bottom). d,e, Relative abundance of C55-OH (d) and C55-P (e) under same conditions as in c. f, UPLC trace of lipid extracts of complemented ΔSAOUHSC_00846 S. aureus grown in TSB pH 8.5. g,h, Raw peak proportions of C55-OH (g) and C55-P (h) in each strain grown at pH 8.5. i, S. aureus stained with ampho-FL at pH 8.5. Scale bars, 5 μm. DIC, differential interference contrast image. j, Quantification of ampho-FL signal. Symbols represent the mean ampho-FL intensity of 1 to 8 individual bacterial clusters in independent cultures. k, Proposed model of disrupted C55-P recycling and the associated consequences in bacteria lacking C55-P translocase activity. b,c,f,i, Representative data from n = 3 cultures per strain or condition. d,e,g,h,j, Data are mean ± s.d. from n = 3–5 cultures per strain or condition. Each point is an independent culture. d,e, Unpaired student’s two-tailed t-test. g,h,j, One-way ANOVA with Tukey’s multiple comparison test.
Fig. 4
Fig. 4. DedA family members are additional C55-P translocase candidates.
a, A synthetic transposon screen in Δvca0040 V. cholerae, showing log2 mean read fold changes (MFC; threshold ±2) and inverse Mann–Whitney U test P-values (threshold 100). Pooled data from two independent transposon libraries. b, Domain content and predicted structure of V. cholerae VCA0534 (also known as YghB). c, Growth of ΔyghB V. cholerae vca0040 depletion strains. Ara, arabinose; Glc, glucose. d, Spontaneous suppressors of ΔSAOUHSC_00846 map to two S. aureus DedA family proteins, with predicted structures (right) and specific promoter mutations selected for validation (bold). e, Rescue of ΔSAOUHSC_00846 by expression of SAOUHSC_00901 (0901) or SAOUHSC_2816 (2816) from hybrid promoters containing the IPTG-inducible promoter Pspac linked to 25-bp (construct 1) or 200-bp (construct 2) native promoter stretches with the indicated suppressor mutations (*). f, Fold change in amphomycin MIC for wild-type and mutant S. aureus relative to the MIC for the wild type at pH 7 (150 μg ml−1). c,e, Representative results from n = 3 independent experiments per condition. f, Data are mean ± s.d. from n = 3 cultures per strain or condition.
Fig. 5
Fig. 5. DUF368 is required for V. cholerae pathogenesis.
a,b, Schematic (a) and intestinal competitive indices (b) in mixed-infection models (n = 6 rabbits in each group). SI, small intestine. ce, Schematic (c), number of intestinal colony-forming units (CFU) (d) and fluid accumulation ratio (FAR) (e) in single infections (n = 3 rabbits (wild type) and n = 8 rabbits (Δvca0040)). CF, caecal fluid; pSI, proximal small intestine; mSI, medial small intestine; dSI, distal small intestine. Open circles indicate rabbits with limit of detection (LOD) measurements where the true CFU burden is at least (for upper LOD circles) or at most (for lower LOD circles) the plotted value. Note two Δvca0040 animals had insufficient caecal fluid accumulation for FAR calculation and were assigned LOD values (arbitrary 25 μl volume). b,d, Data are geometric mean. d, Two-tailed Mann–Whitney U tests. e, Data are mean ± s.d. analysed with an unpaired Student’s two-tailed t-test. f, pH of caecal fluid from infected animals. Data are mean ± s.d. g, Incubation of laboratory-grown V. cholerae with filtered caecal fluid samples from three different rabbits. Representative images from n = 3 ex vivo incubations with independent caecal fluid samples. Scale bars, 3 μm. h, Proposed model for microbial C55-P translocation and its integrated control by environmental inputs, the presence of other translocases, and non-translocase-related environmental adaptation mechanisms. Source data
Extended Data Fig. 1
Extended Data Fig. 1. Identification and conservation of VCA0040.
(a): Infant rabbit transposon-insertion sequencing data reproduced from Hubbard et al. (ref. ) identifying vca0040 (red) as a V. cholerae intestinal colonization determinant. The tcp operon, known to be critical for colonization, is highlighted in blue. One representative rabbit (#403) is shown. Inverse p-values were obtained by the Mann-Whitney U test without adjustments for multiple comparisons. Plotted thresholds are the same as Fig. 4a. (b and c): Domain structure, locus tags, accession numbers (b), and alignment (c) of V. cholerae and S. aureus DUF368-containing proteins. Alignment was performed with T-COFFEE. IN: predicted cytosol-facing sequence. HEL: predicted transmembrane helix sequence. OUT: predicted external-facing sequence. (d and e): Phylogenetic conservation of DUF368 domains (PF04018). (d): Family-level conservation (blue lines) grouped by phylum (colored arcs). Selected well-represented phyla are labeled. Blue lines are not scaled and do not provide information on the number or diversity of within-family DUF368 sequences. (e): Family-level breakdown of DUF368 conservation.
Extended Data Fig. 2
Extended Data Fig. 2. Structural modeling of DUF368-containing proteins.
The V. cholerae (left) and S. aureus (right) DUF368-containing proteins were modeled using AlphaFold2 and visualized with ChimeraX. (a): Multiple sequence alignment (MSA) coverage (left) and pLDDT (confidence score, right) per position for each protein from AlphaFold2. (b): Overall ribbon structures, colored from N (violet) to C (red) termini. (c and d): Electrostatic surface potential (c) and lipophilicity (d) maps generated using default ChimeraX settings. V. cholerae panels are reproduced from Fig. 1c,d for clarity. Electrostatic colour scale: -10 to 10 kcal/(mol·e). Lipophilicity colour bar: relative molecular lipophilicity as calculated by ChimeraX. (e): MSA coverage, pLDDT plot, and ribbon and electrostatic surface views of the DUF368 protein from Haloferax volcanii (HVO_RS12060).
Extended Data Fig. 3
Extended Data Fig. 3. Growth and morphology of Δvca0040 V. cholerae.
(a): CFU plating time course of WT and Δvca0040 V. cholerae. Onset of stationary phase occurs after 6 h. (b): Phase-contrast imaging of WT, Δvca0040 and Δvca0040 + vca0040 V. cholerae in overnight cultures in the indicated conditions. (c): Phase-contrast imaging time course of the indicated strains grown in LB at 30 °C for the indicated amount of time. (d): Timelapse imaging of Δvca0040 cells immobilized on an agarose pad from a 30 °C overnight culture. Images were acquired over 3 h of growth. (e): Imaging of V. cholerae treated with normal, boiled (10 min) or filtered (<3K MW cutoff) cell-free spent supernatant for 4 h at 30 °C. (f): Imaging of V. cholerae treated with vehicle (DMSO) or 3 mM of D- or L-Ala in fresh LB for 4 h at 30 °C. a: mean ± SD of n = 3 independent cultures per strain. b, c, e, f: representative images of n = 3 independent cultures per strain/condition. d: representative timelapse of a single cell representative of >20 sphere-shaped bacteria across n = 3 separate fields of view from a single overnight culture. Scale bars: 3 (b,c,f) or 5 (d,e) µm.
Extended Data Fig. 4
Extended Data Fig. 4. DUF368 functional conservation and effects on PG composition and crosslinking.
(a and b): Alkaline growth of Δvca0040 V. cholerae bearing pBAD18 vectors expressing (a) SAOUHSC_00846 from S. aureus or (b) HVO_RS12060 from H. volcanii. (c-e): Composition and crosslinking analysis in the indicated V. cholerae strains at the indicated pH in M63 media. Suppressor: Δvca0040/ΔsecDF1. (f and g): Same as c-e for S. aureus grown in the indicated conditions. a, b: representative data from n = 3 cultures per strain/condition. c-g: mean ± SD from n = 3 cultures per strain/condition. Statistical analysis was performed with one-way ANOVAs with Tukey’s multiple comparison tests (c-e) or unpaired student’s two-tailed t-tests (f, g).
Extended Data Fig. 5
Extended Data Fig. 5. Additional characterization of bacteria lacking DUF368-containing proteins.
(a-d): RNAseq of Δvca0040 V. cholerae, with schematic (a), confirmation of sphere formation via imaging at sample collection (b), principal component analysis of RNAseq data (c), and MA plot of analyzed sequences (d) (n = 3 independent cultures per strain). An arbitrary fold change (FC) cutoff of 4 was implemented during RNAseq analysis, and genes with FC values beneath the p-value threshold of 0.05 are highlighted in red. pgpB and vca0040 are labeled. (e and f): UPLC traces (e) and quantification of C55-P relative abundance (f) in V. cholerae grown at the indicated pH. (g): Ampho-FL-stained S. aureus grown at pH 6, 7, or 8.5. (h): Quantification of ampho-FL staining signal at different pHs as shown in g. Symbols represent the mean ampho-FL intensity of n = 1–8 individual bacterial clusters in independent cultures. Single pH 8.5 cultures were used as controls as a new batch of ampho-FL was used for this experiment. e, g: representative data of n = 3 cultures per strain/condition (except for n = 1 culture in pH 8.5 in g). f, h: n = 3 independent cultures. Statistical analysis was performed with (d) Wald tests in the DESeq2 pipeline with multiple comparison adjustments or (f, h) unpaired student’s two-tailed t-tests. Scale bars, 5 µm.
Extended Data Fig. 6
Extended Data Fig. 6. Genetic interactions between DedA and DUF368 proteins.
(a): Synthetic transposon-insertion screen in ΔyghB V. cholerae. P-values were obtained by the Mann-Whitney U (MWU) test without adjustment for multiple comparisons. MFC: mean fold change in read coverage between ΔyghB and WT. (b): Growth of Δvca0040 V. cholerae expressing vectors with arabinose-inducible genes on regular LB (left), LB pH 9 (middle) and LB pH 9 + arabinose (right) plates. (c): Growth of V. cholerae lacking one or both of vca0040 and/or yghB on LB pH 6 plates. LB was buffered with 100 mM MES and pH-adjusted with HCl. a: pooled data from n = 2 independent transposon libraries. b, c: representative images from n = 3 cultures per strain/condition.
Extended Data Fig. 7
Extended Data Fig. 7. Contribution of Na+ to Δvca0040 alkaline susceptibility.
(a): Representative colonies of WT, Δvca0040, and suppressor V. cholerae on LB+X-gal plates. White arrows indicate suppressors. (b): Spontaneous suppressor mutations of Δvca0040 V. cholerae. SecD1, SecF1 and PpiD are part of the V. cholerae protein secretion machinery. Colored text indicates suppressors from a secondary screen in ΔsecD2/Δvca0040 (blue) or ΔsecF2Δvca0040 (red) V. cholerae. Asterisk: stop codon. (c): Phase-contrast imaging of overnight 30 °C LB cultures of the indicated strains in the Δvca0040 background. Scale bars, 3 μm. (d): Overnight 30 °C LB culture pH of the indicated strains. (e): SecDF1 and SecDF2 functions in V. cholerae. Possible SecDF functions: coupling ion import to SecA ATPase stimulation (bottom arrow) or Sec substrate guidance into the periplasm (top arrow). (f): Synthetic lethality of secD2 in ΔsecD1 V. cholerae using the pAM299 suicide vector for Ara-dependent secD2 expression. (g): Growth of the indicated strains in M63 media with added NaCl or KCl. (h): Waterfall plot comparing ΔsecDF1 to WT V. cholerae proteome ranked by protein fold change (FC). (i): Growth of Δvca0040 V. cholerae in [Na+]-varying (top) or [K+]-varying (bottom) M63 media at pH 6, 7 or 8. (j and k): Growth of WT (j) or Δvca0040 (k) V. cholerae in M63 pH 8 with a range of [NaCl]. 100mM NaCl curves from i are replicated in j and k for comparison. (l and m): Growth of the indicated V. cholerae strains on non-buffered (l) or pH 6 (m) LB with regular (~170 mM) or no added NaCl. a: representative image of n = 11 independent suppressor strains. c, f, l, m: representative data of n = 3 cultures per strain/condition. d: means ± SD of n = 3 cultures per strain. g, i, j, k: mean ± SD of at least 3 technical replicates of single cultures (representative of n = 3 cultures per strain/condition). h: pooled data comparing n = 4 independent cultures of each strain.
Extended Data Fig. 8
Extended Data Fig. 8. Supplemental data for infant rabbit infections.
(a): Total CFU in mixed infections with differing inoculum pH (n = 6 each for pH 7 and 9). (b): Fluid accumulation ratio (FAR) in mixed infections with differing inoculum pH. (c): Representative small intestinal CFU plates from single infections showing transmission of WT V. cholerae (greyish translucent colonies) from WT-infected rabbits to Δvca0040-infected rabbits in the same litter. Note that Δvca0040 colonies (white arrows) are lighter and smaller than WT colonies, making them visually distinguishable and countable. (d): Direct imaging of GFP+ V. cholerae in single infection CF samples. Large GFP-bright spheres are likely Δvca0040 cells in the presence of transmitted, rod-shaped WT cells. Scale bars, 3 μm. a: geometric means analyzed with two-tailed Mann-Whitney U tests. b: mean ± SD analyzed with an unpaired student’s two-tailed t-test. c, d: representative images from n = 3 WT and n = 7 Δvca0040 singly-infected rabbits. Source data
Extended Data Fig. 9
Extended Data Fig. 9. Intravenous (IV) infections of mice with S. aureus.
(a): Schematic of IV infections and sample harvesting workflow. TSA counts indicate total S. aureus CFU burden, whereas TSAK counts indicate ΔSAOUHSC_00846 burden. N = 5 mice were used per timepoint (n = 10 total). (b): Raw CFU counts from TSA and TSA + kanamycin (TSAK) plates. In the absence of a competitive defect, the TSAK counts should be 50% of those on the TSA plates (and thus are very close together on the log10-plotted graph). (c): Ratio of ΔSAOUHSC_00846 (KanR) colony-forming units (CFU) to total S. aureus CFU at Day 2 (left) and Day 5 (right) post-infection. The dotted line indicates the mean starting proportion from n = 2 technical replicate plates of the inoculum. Open circles represent the limit of detection (LOD). Note that samples with CFU counts below the LOD were not plotted. b: geometric means. c: means ± SD. Source data
Extended Data Fig. 10
Extended Data Fig. 10. Distribution of putative C55-P translocases in bacteria and genetic analysis of a DUF368 protein in V. parahaemolyticus.
(a): Venn diagram of Annotree species-level outputs for PFAM queries PF04018 (DUF368), PF09335 (DedA), and PF02673 (BacA/UppP). Out of 30,255 bacterial species in the Annotree database, 29,416 (97.2%) are predicted to contain at least one of the three proteins. A list of species in each Venn diagram segment is listed in Supplementary Table 9. This is likely also an overestimate of the number of species lacking any of these three domains due to sequence divergence and potentially inadequate PFAM annotation. For example, the obligate intracellular pathogen Rickettsia rickettsii (GCA_000018225.1) is in the triply-absent group, but upon manual curation is known to have peptidoglycan and has an annotated DedA coding sequence, perhaps reflecting a PFAM annotation lag. Interestingly, however, Mycoplasma species, which do not have lipopolysaccharide or peptidoglycan (and thus may not be dependent on C55-P translocation) appear to be genuinely triply-absent except for a select few members with only a DUF368-containing protein. (b): Growth of V. parahaemolyticus lacking the DUF368-containing protein VPA1624 at neutral and acidic pH. VPA1624 genetically interacts with the V. parahaemolyticus secDF1 loci, as deletion of these suppressors originally identified in V. cholerae rescues the vpa1624-depleted strain. Ara: arabinose, Glc: glucose. Representative data of n = 3 independent cultures per strain/condition.

References

    1. Egan AJF, Errington J, Vollmer W. Regulation of peptidoglycan synthesis and remodelling. Nat. Rev. Microbiol. 2020;18:446–460. doi: 10.1038/s41579-020-0366-3. - DOI - PubMed
    1. Mueller, E. A. & Levin, P. A. Bacterial cell wall quality control during environmental stress. mBio10.1128/mBio.02456-20 (2020). - PMC - PubMed
    1. Vijaranakul U, Nadakavukaren MJ, de Jonge BL, Wilkinson BJ, Jayaswal RK. Increased cell size and shortened peptidoglycan interpeptide bridge of NaCl-stressed Staphylococcus aureus and their reversal by glycine betaine. J. Bacteriol. 1995;177:5116–5121. doi: 10.1128/jb.177.17.5116-5121.1995. - DOI - PMC - PubMed
    1. Madiraju MVVS, Brunner DP, Wilkinson BJ. Effects of temperature, NaCl, and methicillin on penicillin-binding proteins, growth, peptidoglycan synthesis, and autolysis in methicillin-resistant Staphylococcus aureus. Antimicrob. Agents Chemother. 1987;31:1727–1733. doi: 10.1128/AAC.31.11.1727. - DOI - PMC - PubMed
    1. Mainardi J, et al. Resistance to cefotaxime and peptidoglycan composition in Enterococcus faecalis are influenced by exogenous sodium chloride. Microbiology. 1998;144:2679–2685. doi: 10.1099/00221287-144-10-2679. - DOI - PubMed

Publication types

MeSH terms