. 2022 Nov 30;13(1):7375.
doi: 10.1038/s41467-022-34971-6.

The E3 ubiquitin ligase WWP2 regulates pro-fibrogenic monocyte infiltration and activity in heart fibrosis

Affiliations

The E3 ubiquitin ligase WWP2 regulates pro-fibrogenic monocyte infiltration and activity in heart fibrosis

Huimei Chen et al. Nat Commun. .

Abstract

Non-ischemic cardiomyopathy (NICM) can cause left ventricular dysfunction through interstitial fibrosis, which corresponds to the failure of cardiac tissue remodeling. Recent evidence implicates monocytes/macrophages in the etiopathology of cardiac fibrosis, but giving their heterogeneity and the antagonizing roles of macrophage subtypes in fibrosis, targeting these cells has been challenging. Here we focus on WWP2, an E3 ubiquitin ligase that acts as a positive genetic regulator of human and murine cardiac fibrosis, and show that myeloid specific deletion of WWP2 reduces cardiac fibrosis in hypertension-induced NICM. By using single cell RNA sequencing analysis of immune cells in the same model, we establish the functional heterogeneity of macrophages and define an early pro-fibrogenic phase of NICM that is driven by Ccl5-expressing Ly6chigh monocytes. Among cardiac macrophage subtypes, WWP2 dysfunction primarily affects Ly6chigh monocytes via modulating Ccl5, and consequentially macrophage infiltration and activation, which contributes to reduced myofibroblast trans-differentiation. WWP2 interacts with transcription factor IRF7, promoting its non-degradative mono-ubiquitination, nuclear translocation and transcriptional activity, leading to upregulation of Ccl5 at transcriptional level. We identify a pro-fibrogenic macrophage subtype in non-ischemic cardiomyopathy, and demonstrate that WWP2 is a key regulator of IRF7-mediated Ccl5/Ly6chigh monocyte axis in heart fibrosis.


Conflict of interest statement

The authors declare no competing interests.

Figures
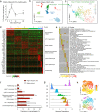
Fig. 1
Fig. 1. Single-cell transcriptomic profiling and trajectory analysis of cardiac macrophages in a murine model of NICM.
a Dynamics of cardiac macrophages (live CD45+ CD64+ CD11b+ F4/80+ Ly6G−) from B6J mice treated with Ang-II (500 ng/kg/min). Cardiac macrophages are shown as a percentage with respect to total number of cardiac cells. Three biological replicates were used at each time point. P-values calculated by Mann–Whitney U test, vs percentage at day 0. *P < 0.05, **P < 0.01. b Cardiac CD45+ cells sorted from left ventricle (LV) from B6J mice treated with Ang-II (500 ng/kg/min, 7 days) and saline (controls) were pooled for scRNA-seq analysis on 5497 cells. Global uniform manifold approximation and projection (UMAP) dimension reduction analysis identified six major cell types. DC dendritic cells, NK cells natural killer cells. c Macrophages were re-clustered using Seurat’s Louvain clustering. d Heatmap of the scaled gene expression of top 10 markers for each macrophage cluster from Fig. 1c, based on average log2 fold change (FC). ISGs Interferon (IFN)-stimulated genes, AP-1 Activator protein 1. e Heatmap of enriched pathways identified in each cardiac macrophage cluster. The top five terms are shown, and the significance of enrichment is represented by log2(−log10 (adjusted p value)). f Bar plot showing the relative proportions of macrophage clusters from c in B6J control (saline) and B6J mice treated with Ang-II (500 ng/kg/min, 7 days). A two-proportion z test was used to assess statistical significance; ***P < 0.001 Ang-II-treated vs saline-treated control mice. g Monocle-derived pseudotime cell trajectory of each cardiac macrophage cluster from c. h UMAP of cardiac macrophages describing developmental trajectories superimposed (upper) on clusters from C0 to C4 (lower). The main trajectories are generated by Slingshot, which are calculated as the average pseudotime over all cells.
Fig. 2
Fig. 2. WWP2 dysfunction regulates macrophage infiltration and expansion in the heart at 7 days post Ang II-infusion.
a Schematic representation of the experimental setup. Sorted live CD45+ cells from LV underwent scRNA-seq analysis, and seven clusters are represented in the UMAP space. WT, WWP2wt/wt; Mut/Mut, WWP2Mut/Mut. In each experiment, mice were treated with either saline (control) or Ang-II (500 ng/kg/min, 7 days). b Bar plots represent the proportions of macrophage clusters (Fig. 2a) in WT and Mut/Mut following Ang-II treatment. Two-proportion z test, ***P < 0.001 Mut/Mut vs WT. c Expression of Ly6c gene in cardiac macrophages represented in the UMAP space. d Percentage of Ly6chigh cells in WT and Mut/Mut cardiac monocyte compartments, in control or Ang-II-treated mice. n = 5–8 for each group. e Representative flow cytometry for CD11b+/F4/80+ gate in Ang-II-treated WT and Mut/Mut mice (left). Quantification of cardiac macrophages in Mut/Mut compared with WT mice following Ang-II treatment (right). n = 6–9 for each group. f Chemokine ligand-receptor pairs (Molecule 1–2 pairs) derived by CellPhoneDB analysis in cardiac macrophages, P < 0.01 (left). Mean expression of Molecule 1–2 pairs are reported as color intensity, and statistical significance (−log10(p value)) as bubble size. Differential expression of chemokine ligands and receptors is represented as log2fold changes (FC) (right). Two-sided Wilcoxon test. *, Benjamini–Hochberg adjusted P < 0.05. gh Chemokine ligand (Ccl5, Ccl7, Ccl12, Ccl24) mRNA expression in macrophage clusters from scRNA-seq analysis, and in cardiac macrophages sorted from LVs of control or Ang-II-treated WT and Mut/Mut mice (n = 4–9 for each group). ij Representative western blot (i) and quantitative RT-PCR (qRT-PCR) (j) measuring Ccl5 in bone marrow-derived macrophages (BMDMs) and spleen-derived macrophages (SPMs) under LPS (100 ng/ml) and IFNγ (10 ng/ml) treatment (4 hrs) in WT and Mut/Mut experimental groups. Non-parametric Mann–Whitney U test, n = 6 for each group. k Levels of Ccl5 in the supernatant from WT and Mut/Mut BMDMs treated with LPS (100 ng/ml) and IFNγ (10 ng/ml) (4 hrs). n = 5–6 for each group. Unless otherwise indicated, data are shown as dot-plots with mean ± SD, and statistical significance is assessed by the non-parametric Mann–Whitney U test.
Fig. 3
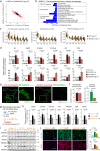
Fig. 3. WWP2 regulates macrophage activation and profibrotic function.
a Scatter plot of log2fold changes (FC) in mRNA expression from scRNA-seq in cardiac macrophages between Ang-II-treated Mut/Mut and WT mice (y axis) and log2FC between WT Ang-II-treated and WT untreated mice (x axis). Differentially expressed genes (DEGs) in red (n = 237, FDR < 0.05). Ang-II treatment: 500 ng/kg/min, 7 days. b Top downregulated pathways in Mut/Mut macrophages identified by gene set enrichment analysis (GSEA) of DEGs. NES, normalized enrichment score. c Violin plots illustrate the expression score of the GSEA-derived pathways across all cardiac macrophage clusters in Mut/Mut and WT mice after treatment with Ang-II (7 days). d qRT-PCR analysis of selected pro-inflammatory and homeostatic/reparatory genes in macrophages sorted from LV of WT and Mut/Mut mice treated with saline or Ang-II (7 days). n = 5–12 for each group. e Representative immunofluorescence staining of smooth muscle aortic alpha-actin (ACTA2, green) in (myo)fibroblasts co-cultured with CD45 + macrophages (red). Scale bar, 100 μm. f Number of cardiac macrophages moving across the proximity border (left), and ACTA2 expression in (myo)fibroblasts (right). n = 3 per experimental group and 15–25 fibroblast images were taken from each slide. g Schematic of the co-culture experimental setup in vitro. The conditioned supernatant (CS) from BMDMs treated with LPS (100 ng/ml, 4 hrs) and IFNγ (10 ng/ml, 4 hrs) was used to activate primary cardiac fibroblasts (P2) cultured from LV of WT mice for 72 hrs. h, i Relative mRNA expression (h) and representative WB (i) of selected extracellular matrix (ECM) genes in cardiac (myo)fibroblast treated with CS from mock, WT and Mut/Mut BMDMs. n = 6 for each group. Mock, CS from untreated BMDMs. j Representative microscopy images (left) with immunostaining for ACTA2 and COL1 in cardiac fibroblasts after stimulation with CS from mock, WT, or Mut/Mut BMDMs. Scale bars, 500 μm. Bar plot (right) showing fluorescence intensity of ACTA2 and COL1 per fibroblast in the different experimental groups (mock, WT, Mut/Mut). n = 3–4 per experimental group, and 17–53 fibroblast images were taken from each slide. Unless otherwise indicated, data are shown as dot-plots with mean ± SD, and statistical significance is assessed by the non-parametric Mann–Whitney U test.
Fig. 4
Fig. 4. Conditional depletion of WWP2 in macrophages protects from Angiotensin II induced cardiac fibrosis.
a Left, representative Sirius red (upper) and Masson’s Trichrome (lower) staining of short-axis sections of LV. Scale bar: 0.5 mm. Right, quantification of the area of fibrosis in transverse histological sections with Sirius red staining at the mid-ventricular level. WWP2Mac, WWP2 conditional knockout in macrophages; Control (Ctrl), WWP2flox/flox mice. b Collagen content in LV by hydroxy-phenyl-propionic acid (HPA) assay. n = 10 per experimental group. c Representative M-mode echocardiograms (middle LV long-axis) (left), and quantification of left ventricular internal dimension at end-diastole (LVIDed)(right). n = 12 per experimental group. d Echocardiogram-based quantification of LV ejection fraction (EF%) and fractional shortening (FS%). n = 8–11 per experimental group. e Representative WB showing fibronectin extracellular domain A (EDA-FN), vimentin (VIM), periostin (POSTN), and ACTA2 in LV tissue from control and WWP2Mac mice. f qRT-PCR analysis of selected ECM genes in LV tissue from control and WWP2Mac mice. n = 6 per experimental group. g Representative flow cytometry for CD11b+/F4/80+ gate for live cells from LV of control and WWP2Mac mice (left). Quantification analysis shows reduced percentage of cardiac macrophage (live, CD45+CD64+CD11b+F4/80+Ly6G) in WWP2Mac compared with control mice (right). n = 4 for each group. h Percentage of the Ly6Chigh in cardiac monocyte compartments (CD45+CD64+CD11b+). n = 4 for each group. i Ccl5 mRNA expression in cardiac macrophages (MΦ) sorted from LV. n = 5 per experimental group. j Relative mRNA levels of Ccl5 (upper), and representative WB for protein levels of CCL5 (lower) in LV tissue from control and WWP2Mac mice. kl qRT-PCR analysis of selected pro-inflammatory and homeostatic/reparatory genes in sorted cardiac macrophages (k: bar plot, n = 4–8 per group) and in LV tissue (l: heatmap, n = 6 per group). m ECM protein expression in LV from control and WWP2Mac mice. Data in af refer to mice treated with Ang-II (500 ng/kg/min, 28 days). Data in gm refer to mice treated with Ang-II (500 ng/kg/min, 7 days). Unless otherwise indicated, data are shown as dot-plots with mean ± SD, and statistical significance is assessed by the non-parametric Mann-Whitney U test. WWP2Mac vs Ctrl: *P < 0.05; **P < 0.01; NS, not significant.
Fig. 5
Fig. 5. WWP2 regulates IRF7 network activity in macrophages in NICM.
a Scatter plot of the relative activity of transcription factor (TF)-regulons in cardiac macrophages from WWP2Mut/Mut (Mut/Mut) and WWP2wt/wt (WT) mice treated with Ang-II (7 days). For each regulon, the difference in expression score between Mut/Mut and WT and its statistical significance score are shown on the x axis and y axis, respectively. The number of downstream target genes in each regulon is proportional to the circle size (more details in Methods). The IRF7 regulon showed the largest and most significant expression score difference between Mut/Mut and WT cardiac macrophages. b Average expression score of the IRF7 regulon across cardiac macrophage clusters from WT and Mut/Mut mice treated with Ang-II (7 days). (P values by two-sided Wilcoxon test). c Breakdown of IRF7 targets enrichment in the profibrotic hECM-network (n = 237 genes) previously identified in LV of dilated cardiomyopathy patients. 80 (33.8%) of these hECM-network genes are targets of IRF7. d, e qRT-PCR (d) and WB (e) of representative IFN signaling genes (IFNα, IFNβ, and IFNγ) in WT and WWP2−/− (−/−) BMDMs with and without LPS stimulation. n = 5 per experimental group. f. IRF7 binding site motif derived from previously published IRF7 ChIP-seq analysis. g IRF7 ChIP-qPCR analysis and schematic showing the IRF7 binding site motifs (P < 10−4) within the Ccl5 and Irf7 genes. *Motifs matching to (Ccl5, Irf7) PCR products (purple thick line), which were used in the ChIP-qPCR analysis. h,i qRT-PCR (h) and WB (i) of IRF7 mRNA and protein expression in WT and WWP2−/− (−/−) BMDMs. n = 3–6 for each group. j ChIP-qPCR analysis of IRF7 occupancy sites on Ccl5 (left) or Irf7 (right) in WT and WWP2−/− BMDMs treated with LPS. Enrichment is normalized to input DNA, and represented as fold-enrichment relative to vehicle controls in WT BMDMs. In each case, LPS stimulation (100 ng/ml, 4 hrs). Unless otherwise indicated, data are shown as dot-plots with mean ± SD, and statistical significance is assessed by the non-parametric Mann–Whitney U test.
Fig. 6
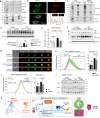
Fig. 6. WWP2 regulates IRF7 transcriptional activity in macrophages through non-degradative ubiquitination.
a Representative WB of co-immunoprecipitation experiment with WWP2 (upper) or IRF7 (lower) showing a direct interaction of WWP2 with IRF7 in BMDMs following LPS stimulation. WCL, whole cell lysate. b Expression of WWP2 (green) and IRF7 (red) in BMDMs following LPS stimulation. The intensity profiles of WWP2 and IRF7 were plotted along an ideal straight line (yellow) crossing the nuclei of two representative cells, showing the WWP2 and IRF7 signals overlap (bottom right). c In-cell ubiquitylation analysis of IRF7 in BMDMs from control WT and WWP2−/− mice. Cells were treated with MG132 (10uM, 3 hrs) followed by LPS stimulation. d Representative WB measuring p-IRF7 protein expression in WT and WWP2−/− BMDMs with or without LPS stimulation. Quantification of p-IRF7 protein expression is shown in the bar plot below. e Quantification of the IRF7 Interferon-stimulated response element (ISRE) luciferase activity in WT and WWP2−/− BMDMs following LPS treatment. n = 7–11 for each group. f Representative immunoblots of native Polyacrylamide gel electrophoresis (PAGE) identifying monomeric and dimeric forms of IRF7 (indicated by arrows) in WT and WWP2−/− BMDMs with or without LPS stimulation. g Representative cellular images (BMDMs) of in-cell IRF7 and p-IRF7 from 10,000 acquired events by imaging flow cytometry (see Methods), showing typical externalized and internalized patterns of colocalized or separately distributed IRF7 and p-IRF7. h, i Imaging flow cytometry shows IRF7 (h) and p-IRF7 (i) DRAQ5 similarity in WT and WWP2−/− BMDMs following LPS treatment, using a similarity score cutoff ≥1.5 for protein nuclear translocation (left panels). Quantification of nuclear translocation of IRF7 and p-IRF7 (right panels). n = 4 for each group. j Representative WB showing IRF7 and p-IRF7 protein distribution in nuclear fractions of BMDMs (with or without LPS) from WT and WWP2−/− mice. k Schematic of the proposed mechanism through which WWP2 regulates IRF7 and the Ccl5/Ly6chigh monocyte axis during the early phase of fibrogenesis, which in turn affects cardiac tissue fibrosis at a later stage of the fibrogenic process. In each experiment, LPS stimulation (100 ng/ml, 4 hrs). Unless otherwise indicated, data are shown as dot plots with mean ± SD, and statistical significance is assessed by the non-parametric Mann–Whitney U test.

References

    1. Henderson NC, Rieder F, Wynn TA. Fibrosis: from mechanisms to medicines. Nature. 2020;587:555–566. doi: 10.1038/s41586-020-2938-9. - DOI - PMC - PubMed
    1. Travers JG, et al. Cardiac fibrosis: the fibroblast awakens. Circ. Res. 2016;118:1021–1040. doi: 10.1161/CIRCRESAHA.115.306565. - DOI - PMC - PubMed
    1. Frangogiannis NG. Cardiac fibrosis. Cardiovasc. Res. 2021;117:1450–1488. doi: 10.1093/cvr/cvaa324. - DOI - PMC - PubMed
    1. Kong P, Christia P, Frangogiannis NG. The pathogenesis of cardiac fibrosis. Cell Mol. Life Sci. 2014;71:549–574. doi: 10.1007/s00018-013-1349-6. - DOI - PMC - PubMed
    1. Prabhu SD, Frangogiannis NG. The biological basis for cardiac repair after myocardial infarction: from inflammation to fibrosis. Circ. Res. 2016;119:91–112. doi: 10.1161/CIRCRESAHA.116.303577. - DOI - PMC - PubMed

Publication types