. 2022 Nov 30;12(1):20682.
doi: 10.1038/s41598-022-24963-3.

Multiple invasions, Wolbachia and human-aided transport drive the genetic variability of Aedes albopictus in the Iberian Peninsula

Affiliations

Multiple invasions, Wolbachia and human-aided transport drive the genetic variability of Aedes albopictus in the Iberian Peninsula

Federica Lucati et al. Sci Rep. .

Abstract

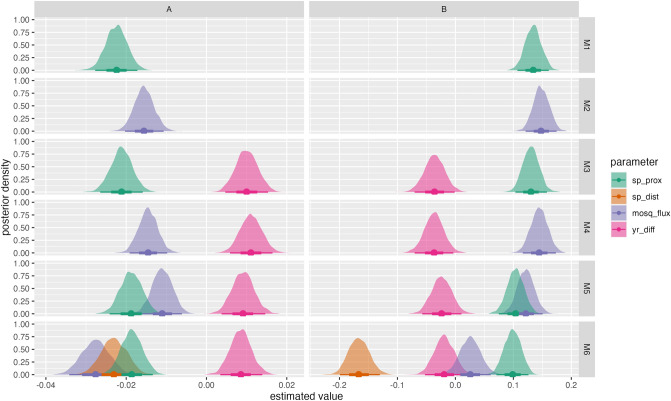
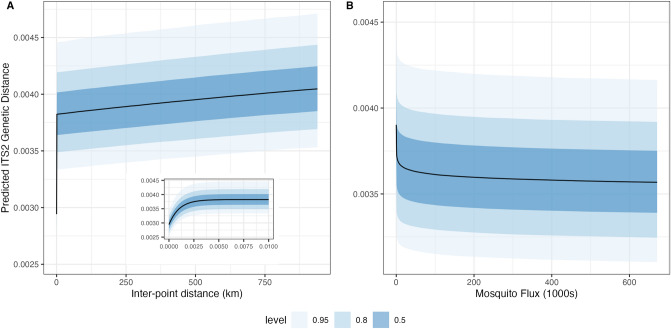
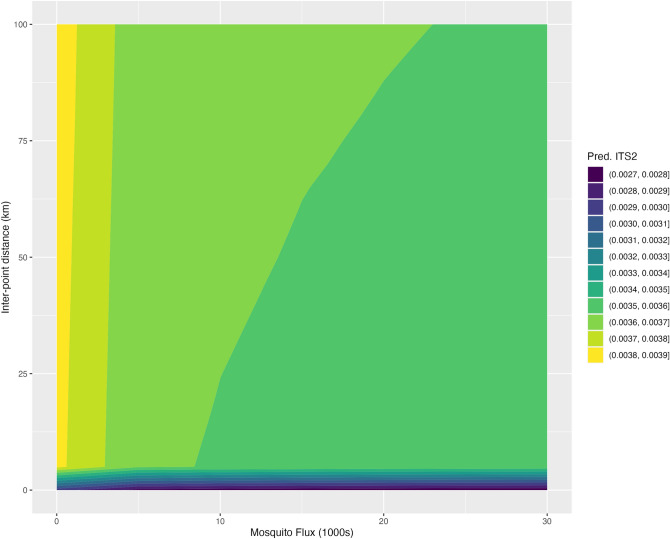
The Asian tiger mosquito, Aedes albopictus, is one of the most invasive species in the world. Native to the tropical forests of Southeast Asia, over the past 30 years it has rapidly spread throughout tropical and temperate regions of the world. Its dramatic expansion has resulted in public health concerns as a consequence of its vector competence for at least 16 viruses. Previous studies showed that Ae. albopictus spread has been facilitated by human-mediated transportation, but much remains unknown about how this has affected its genetic attributes. Here we examined the factors that contributed to shaping the current genetic constitution of Ae. albopictus in the Iberian Peninsula, where the species was first found in 2004, by combining population genetics and Bayesian modelling. We found that both mitochondrial and nuclear DNA markers showed a lack of genetic structure and the presence of worldwide dominant haplotypes, suggesting regular introductions from abroad. Mitochondrial DNA showed little genetic diversity compared to nuclear DNA, likely explained by infection with maternally transmitted bacteria of the genus Wolbachia. Multilevel models revealed that greater mosquito fluxes (estimated from commuting patterns and tiger mosquito population distribution) and spatial proximity between sampling sites were associated with lower nuclear genetic distance, suggesting that rapid short- and medium-distance dispersal is facilitated by humans through vehicular traffic. This study highlights the significant role of human transportation in shaping the genetic attributes of Ae. albopictus and promoting regional gene flow, and underscores the need for a territorially integrated surveillance across scales of this disease-carrying mosquito.


Conflict of interest statement

The authors declare no competing interests.

Figures

Figure 1
Figure 1
Locations sampled for genetic analysis. Yellow circles are centered on sample locations with radius proportional to number of mosquitoes sampled at each location. Blue diamonds indicate locations of major commercial ports in Spain (ports with over 50,000 TEU -Twenty-Foot Equivalent Unit-, based on AAPA -American Association of Port Authorities- data from 2013). Grey lines indicate provinces of Spain. Land boundaries from Natural Earth. Province boundaries from GADM.
Figure 2
Figure 2
Haplotype networks of COI mtDNA sequences (A) and ITS2 nuclear DNA sequences (B) analysed in Ae. albopictus. Each circle represents a unique haplotype and the circle area is proportional to the number of sequences of a given haplotype. Blue dots correspond to inferred unsampled haplotypes.
Figure 3
Figure 3
Relationship between genetic diversity and year of first detection in the analysed provinces. The mitochondrial COI fragment is indicated by grey triangles and the nuclear ITS2 gene by black circles. Only provinces with four or more samples were included in the analysis. See Table 1 for province list.
Figure 4
Figure 4
Multidimensional scaling plots of ITS2 genetic distances among Ae. albopictus samples, coloured by province (A) and year (B) of sample collection. Plots show the 2-dimensional solution using classical scaling. Goodness of fit = 0.302.
Figure 5
Figure 5
Estimated relationship between ITS2 pairwise genetic distance, spatial distance (sp_dist; geodesic distance between sample locations in meters), spatial proximity (sp_prox; measured as the negative exponential of distance), potential tiger mosquito flux (mosq_flux; estimated from commuting patterns and tiger mosquito population distribution) and temporal distance (yr_diff; measured as absolute difference between years in which samples were taken) on the beta mean (μ) parameter (A) and on the zeros (B) in the zero-inflated beta regression models. Parameters are estimated from a set of Bayesian multilevel zero-inflated Beta regressions with multiple-membership random intercepts for the samples and sampling years represented in each pair.
Figure 6
Figure 6
Predicted ITS2 pairwise genetic distance as a function of the spatial distance and spatial proximity variables taken together (A) and potential tiger mosquito flux (B) in the zero-inflated beta regression Model 6. Panel A shows predictions for the range of inter-point distances in the modelled data (0–940 km), holding potential mosquito flux at its observed median, setting the sampling years to 2011 and 2015, and arbitrarily selecting a sample pair and its associated provinces for purposes of the model’s random intercepts. The inset plot in this panel shows a close-up of the predictions at very small distances (0–10 m). Panel B shows predictions for the range of mosquito fluxes in the modelled data (0–672 km), holding inter-point distance at its median, setting the sampling years to 2011 and 2015, and arbitrarily selecting a sample pair and its associated provinces.
Figure 7
Figure 7
Predicted ITS2 pairwise genetic distance (indicated by fill colour) as a function of inter-point distance (the spatial distance and spatial proximity variables taken together) and potential tiger mosquito flux in the zero-inflated beta regression Model 6. Predictions are shown inter-point distances between 0 and 100 km and potential tiger mosquito fluxes between 0 and 30,000, setting the sampling years to 2011 and 2015, and arbitrarily selecting a sample pair and its associated provinces for purposes of the model’s random intercepts.

References

    1. Hawley WA. The biology of Aedes albopictus. J. Am. Mosq. Control Assoc. 1988;1:1–39. - PubMed
    1. Benedict MQ, Levine RS, Hawley WA, Lounibos LP. Spread of the tiger: global risk of invasion by the mosquito Aedes albopictus. Vector-Borne Zoonotic Dis. 2007;7:76–85. doi: 10.1089/vbz.2006.0562. - DOI - PMC - PubMed
    1. Paupy C, Delatte H, Bagny L, Corbel V, Fontenille D. Aedes albopictus, an arbovirus vector: From the darkness to the light. Microb. Infect. 2009;11:1177–1185. doi: 10.1016/j.micinf.2009.05.005. - DOI - PubMed
    1. Delatte H, et al. Blood-feeding behavior of Aedes albopictus, a vector of Chikungunya on La Réunion. Vector-Borne Zoonotic Dis. 2010;10:249–258. doi: 10.1089/vbz.2009.0026. - DOI - PubMed
    1. Pereira-dos-Santos T, Roiz D, Lourenço-de-Oliveira R, Paupy C. A systematic review: Is Aedes albopictus an efficient bridge vector for zoonotic arboviruses? Pathogens. 2020;9:266. doi: 10.3390/pathogens9040266. - DOI - PMC - PubMed

Publication types