. 2022 Nov 30;13(1):7366.
doi: 10.1038/s41467-022-35166-9.

Deciphering the heterogeneity of the Lyve1+ perivascular macrophages in the mouse brain

Affiliations

Deciphering the heterogeneity of the Lyve1+ perivascular macrophages in the mouse brain

C Siret et al. Nat Commun. .

Abstract

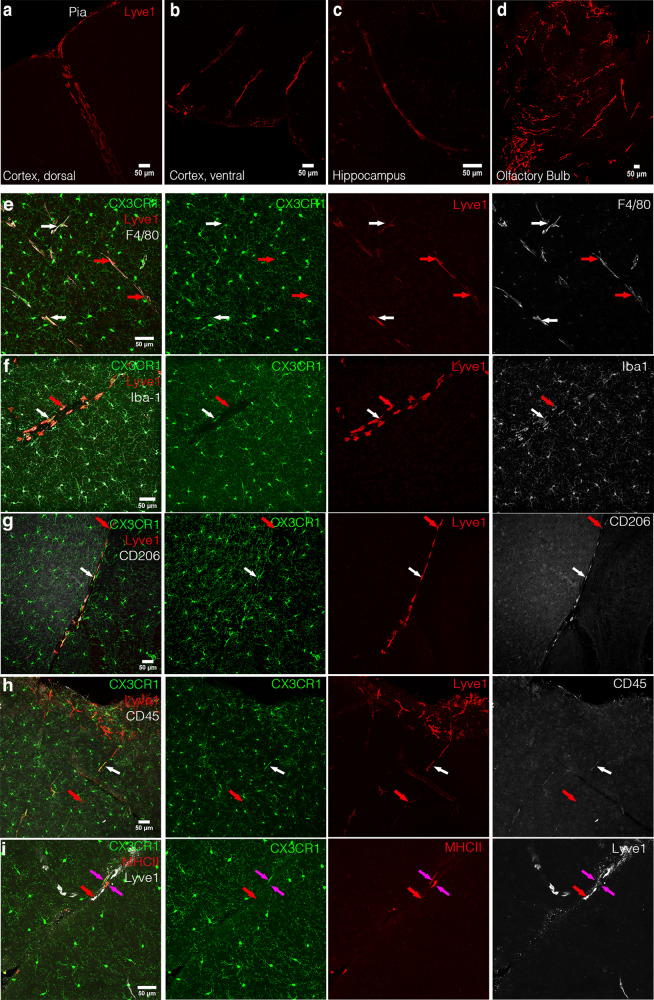
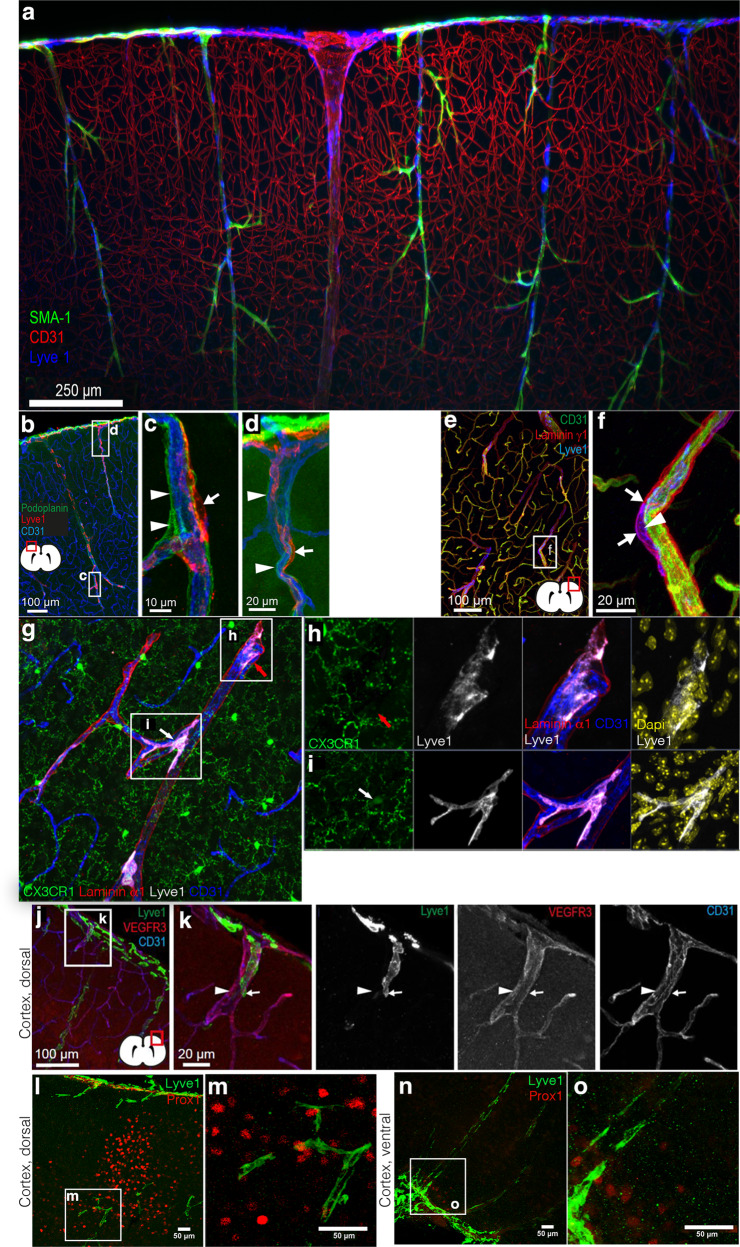
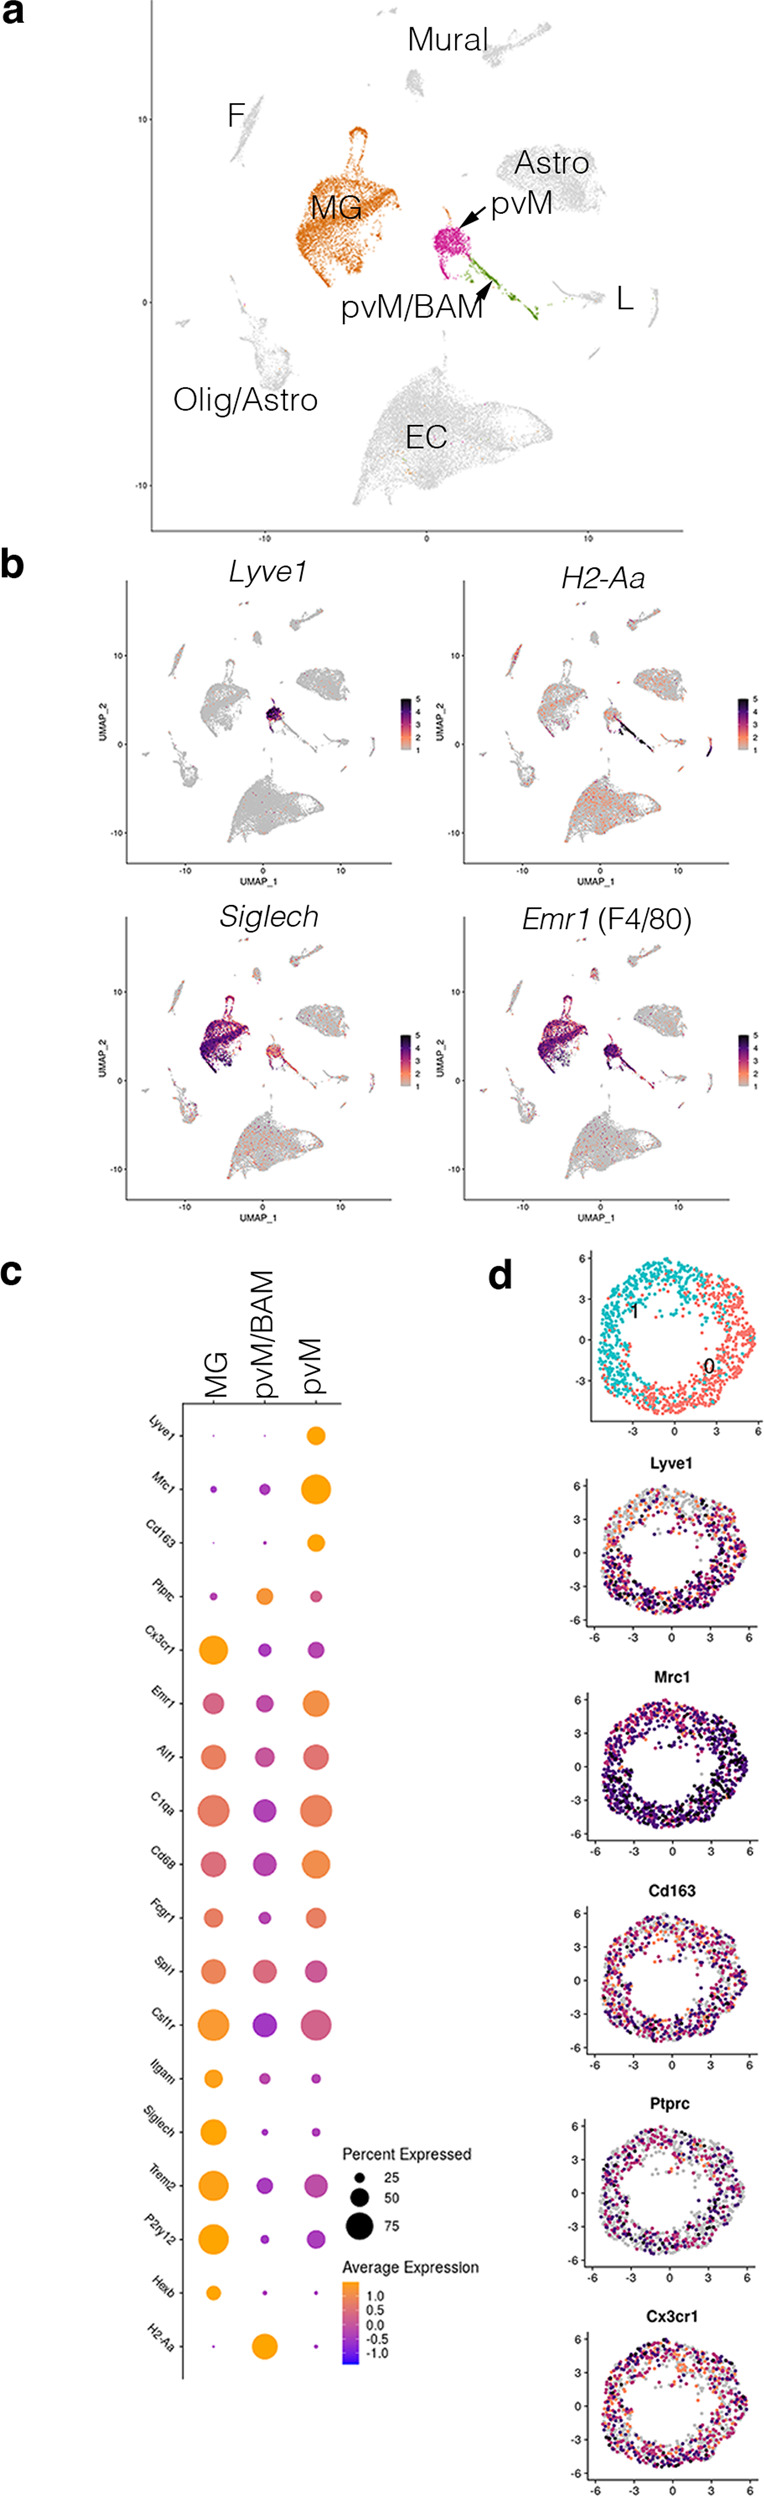
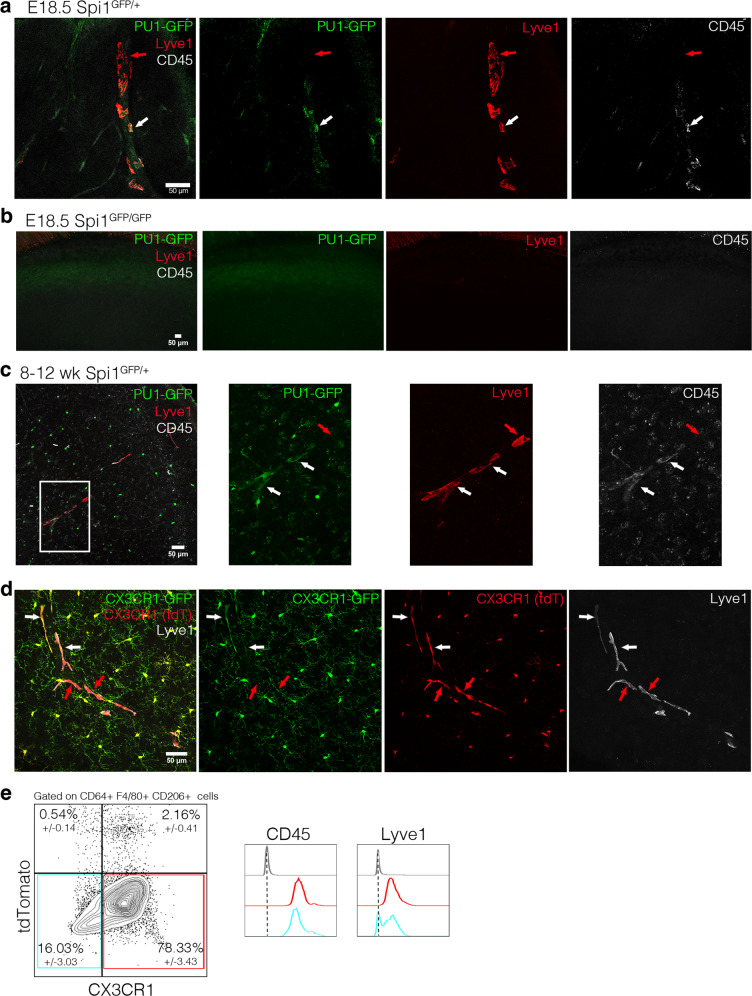
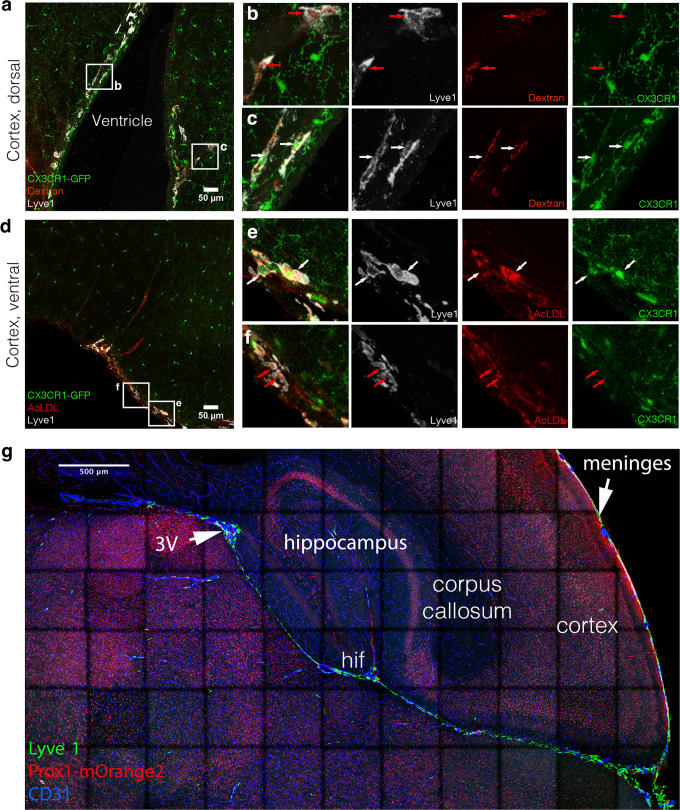
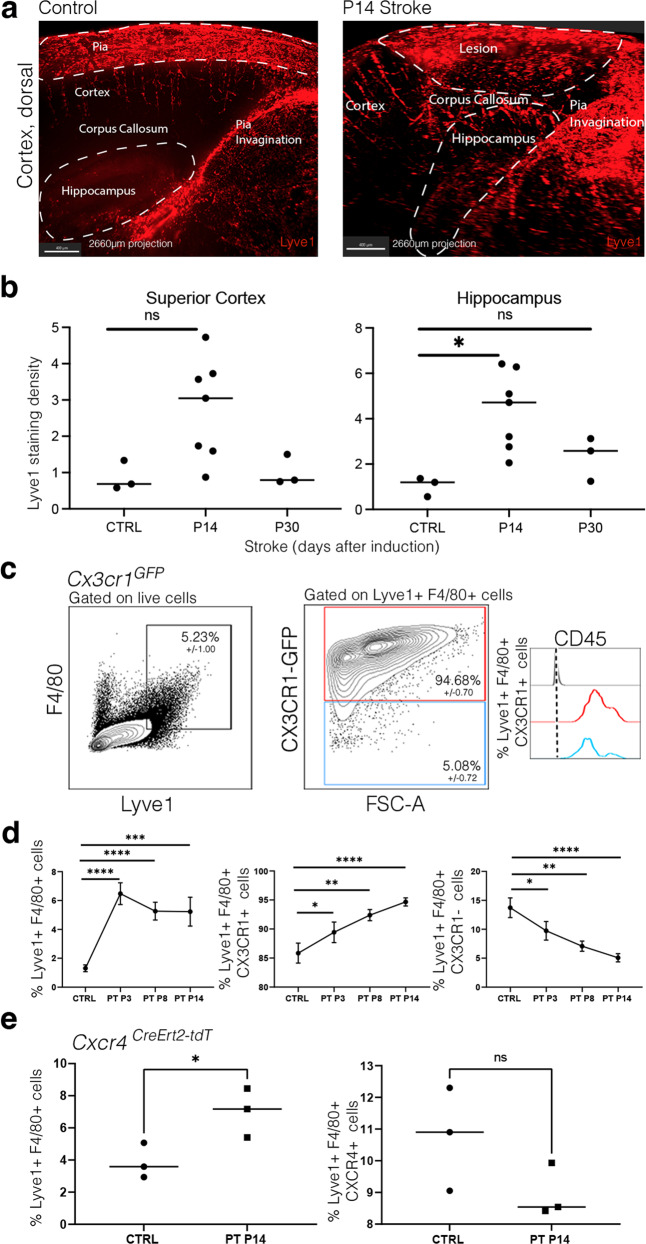
Perivascular macrophages (pvMs) are associated with cerebral vasculature and mediate brain drainage and immune regulation. Here, using reporter mouse models, whole brain and section immunofluorescence, flow cytometry, and single cell RNA sequencing, besides the Lyve1+F4/80+CD206+CX3CR1+ pvMs, we identify a CX3CR1- pvM population that shares phagocytic functions and location. Furthermore, the brain parenchyma vasculature mostly hosts Lyve1+MHCII- pvMs with low to intermediate CD45 expression. Using the double Cx3cr1GFP x Cx3cr1-Cre;RosatdT reporter mice for finer mapping of the lineages, we establish that CD45lowCX3CR1- pvMs are derived from CX3CR1+ precursors and require PU.1 during their ontogeny. In parallel, results from the Cxcr4-CreErt2;Rosa26tdT lineage tracing model support a bone marrow-independent replenishment of all Lyve1+ pvMs in the adult mouse brain. Lastly, flow cytometry and 3D immunofluorescence analysis uncover increased percentage of pvMs following photothrombotic induced stroke. Our results thus show that the parenchymal pvM population is more heterogenous than previously described, and includes a CD45low and CX3CR1- pvM population.


Conflict of interest statement

The authors declare no competing interests.

Figures

Fig. 1
Fig. 1. Identification of a Lyve1+CX3CR1 population in the mouse brain.
Confocal microscopy of brain sections stained with anti-Lyve1 showing the different Lyve1+ cell morphologies in the cortex at the dorsal side (17 µm maximum intensity projection) (a), in the cortex at the ventral side (27 µm maximum intensity projection) (b), the Hippocampal fissure within the hippocampus (15 µm maximum intensity projection) (c), and in the olfactory bulb (61 µm maximum intensity projection) (d) of an adult mouse brain. ei Immunofluorescence microscopy on sections of Cx3cr1GFP in the dorsal cortex of the mouse brain. e Staining of Cx3cr1GFP sections for Lyve1 (red) and F4/80 (white) (50 µm maximum intensity projection), f Iba1 (29 µm maximum intensity projection), g CD206 (20 µm maximum intensity projection), h CD45 (46 µm maximum intensity projection), i MHC-II (18 µm maximum intensity projection). White arrows point to conventional Lyve1+CX3CR1+ pvMs. The red arrows indicate Lyve1+CX3CR1 cells. The pink arrows indicate Lyve1MHCII+ cells. (n = 4).
Fig. 2
Fig. 2. Perivascular Lyve1+ cell location.
a 200 µm Maximum intensity projection of a lightsheet microscope acquisition of the cortex at the dorsal side in a cleared mouse brain labeled for SMA (green), CD31 (red), and Lyve1 (blue) (n = 2). b Confocal microscopy of brain sections stained for podoplanin (green), Lyve1 (red), and CD31 (blue) (n = 4), inserts (c) and d zoom in on Lyve1+ cells lining the blood vessels and placed outside of the « cul-de-sac of the pia mater » defined by the podoplanin labeling. e Confocal microscopy of a dorsal cortex section stained for CD31 (green), laminin-γ1 (red), and Lyve1 (blue) (n = 3) with insert (f) showing a higher magnification showing the Lyve1+ cells in the perivascular space (n = 2). g 55 µm cryosection of the Cx3cr1GFP brain cortex, with the location of Lyve1+(white) pvMs lining the blood vessel (CD31, blue) but within the perivascular space delineated by the laminin α1 staining (red). h CX3XR1 pvMs (red arrow), while i is a CX3XR1+ pvMs (white arrow). Higher resolutions of the inserts are shown to the right, with DAPI (yellow). 3D reconstructions of these cells highlighting the nuclei present within the cells are presented in Supplementary Movies 3 (h) and 4 (i) (n = 2). j Lyve1+ cell characterization by immunofluorescence on adult brain sections for Lyve1 (green), VEGFR3 (red), and CD31 (blue) staining. k The arrowhead points at a blood vessel and the white arrow shows a Lyve1+ cell negative for VEGFR3 and CD31. l Anti-Prox1 staining of a dorsal cortical brain area (39 µm maximum intensity projection). k high magnification of the Lyve1+ and Prox1 cell in l (n = 1). n Also in the ventral cortex Lyve1+ cells (green) did not express Prox1 (red). o High magnification from area in n showing the individual Lyve1 cells without Prox1 expression (50 µm maximum intensity projection) (n = 2).
Fig. 3
Fig. 3. Confirmation of the Lyve1+CX3CR1 population by flow cytometry.
Flow cytometric analysis of Cx3cr1GFP brain parenchyma, pre-gated on living, single cells, CD64+, F4/80+, and CD206+ which excluded monocytes and neutrophils (gating strategy in Supplementary Fig. 3a). Microglia cells were excluded since these are Lyve1CD11bhigh (Supplementary Fig. 3b). Cx3cr1 GFP/+ mouse brains were analyzed at a P2 (3 individual experiments, n = 9 animals), P7 (3 individual experiments, n = 9 animals), P14 (3 individual experiments, n = 9 animals), P21 (3 individual experiments, n = 10 animals), adult (8–12 weeks after birth, 3 individual experiments, n = 10 animals) and 1-year old brains (1 individual experiment, n = 4 animals) showing CX3CR1+/CX3CR1 gating for CD64+F4/80+CD206+ cells and subsequently on histograms for CD45, Lyve1, and CD163 expression in blue for CX3CR1 and in red for the CX3CR1+ population. FMOs are shown in gray. b Total number of CX3CR1F4/80+CD64+CD206+ cells at the different stages. **** represent P-value ≤0.0001 (unpaired t-test). c Morphological characteristics of cytospins from CX3CR1+ and CX3CR1 pvMs sorted from brain and analyzed by hematoxylin/eosin staining. Two representative cells are shown for each population. Scale bars represents 10 µm (1 individual experiment, n = 5 animals). Source data are provided as a Source Data file.
Fig. 4
Fig. 4. Transcriptional profiling of the pvM subsets.
Replicates of mouse brain cortex, excluding neurons and meninges. Shown is the integrated dataset of samples at 10 days (n = 3, 12,843 cells), adult (7–11 weeks, n = 2, 7817 cells), and aged (1.5 years, n = 3, 10,448 cells). Cluster analysis on integrated data (a) focused on the pvM, the pvM/BAM and the microglia clusters. b The pvM cluster was indicated as the sole cluster with Lyve1 expression, but H2-Aa (encoding one of the MHC-II genes) negative. This population was segregated completely from the Siglech expression microglia, which was also Lyve1. Emr1 (encoding F4/80) is expressed in all 3 clusters. c Dot-plot of the genes associated with macrophage or microglial identity, showing that pvMs is the only cluster which is expressing Lyve1. pvM/BAM is characterized by H2-Aa expression, but lacking Lyve1. The microglia population in cluster 3 was identified by lack of Lyve1, CD163, H2-Aa, and low Mrc1 (encoding CD206) or Ptprc (encoding CD45) expression. EC endothelial cell, MG microglia, pvM perivascular macrophage, BAM border-associated macrophage, L Lymphocytes, F fibroblast, Astro astrocyte, Olig Oligodendrocyte, Mural Mural cells. d Cell from the cluster with the highest Lyve1 expression, the pvM, were isolated to analyze a possible segregation in Cx3cr1+ and Cx3cr1 expression population within this population. Even though we observed 2 subclusters, also based on Lyve1 expression, there was no segregation based on Cx3cr1 or Ptprc.
Fig. 5
Fig. 5. The origin of CX3CR1 Lyve1+ perivascular macrophages.
a Immunofluorescence on sections of the head of a E18.5 Spi1GFP/+ embryo (PU1-GFP in green), labeled for Lyve1 (red) and CD45 (white) (60 µm maximum intensity projection) shows the presence of the conventional (white arrows) and the non-conventional pvM populations (red arrows) at this stage (n = 3). b No GFP nor Lyve1 fluorescence was observed in the Spi1GFP/GFP E18.5 dorsal cortex (33 µm maximum intensity projection) (n = 2). c Immunofluorescence on Spi1GFP/+ adult mouse brain (48 µm maximum intensity projection) (n = 3). d Immunofluorescence on sections of Cx3cr1GFP/+; Cx3cr1-Cre; Rosa26tdT mouse brain showing that conventional (white arrows) and non-conventional pvM population (red arrows) are expressing tdTomato (n = 3). e Flow cytometry analysis of Cxcr4-CreErt2; Rosa26tdT brain parenchyma, gated on living, single cells and CD64+ F4/80+ CD206+ cells. Subsequently histograms of CD45 and Lyve1 expression of the CX3CR1tdTomato population in blue, the CX3CR1+tdTomato population in red and FMO in gray (n = 3). Source data are provided as a Source Data file.
Fig. 6
Fig. 6. CX3CR1 pvM share phagocytic functioning with CX3CR1+ pvM.
ac Cx3cr1GFP mouse brains were injected intra-ventricular with Dextran-Alexa647 (37 µm maximum intensity projection) (n = 3) and df Acetylated-LDL-Alexa594 (42 µm maximum intensity projection) (n = 3). Ten minutes after injection, mice were euthanized and brains dissected. Confocal analysis on brain sections shows Lyve1 (white), Dyes (red), and CX3CR1 (green). The unconventional pvMs phagocytosed the dyes (red arrows), as well as did conventional pvMs (white arrows) (b, c, e, f). g Tiled confocal acquisition of a Prox1mOrange2 brain section. Lyve1+ cells in green lined blood vessels stained for CD31 in blue. Lyve1+ cells in green penetrated the brain to the hippocampal fissure (hif) and all the way towards the third ventricle (3 V). (n = 4).
Fig. 7
Fig. 7. CX3CR1+ pvM numbers increase after induced ischemic stroke.
a Maximal intensity projections (sagittal view) (2660 µm) of lightsheet acquisitions on cleared brains, stained for Lyve1 (red), control and after stroke (P14 = 14 days after induction of ischemic stroke) (2 individual experiments, n = 7 animals) (Supplementary Movies 5 and 6). b Quantification of Lyve1 in the area containing the whole stroke lesion within the dorsal cortex situated just above the hippocampus, imaged by lightsheet microscopy. * represents P-value ≤0.05 (Ordinary one-way Anova test). c Representative flow cytometry plots from Cx3cr1GFP brain parenchyma 14 days after induced stroke (P14), pre-gated on living, single and showing Lyve1+F4/80+ cells and CX3CR1+/CX3CR1 gating for these cells Lyve1+ F4/80+ and subsequently in blue the CD45 expression of the Lyve1+F4/80+CX3CR1, in red the CD45 expression of the Lyve1+F4/80+CX3CR1+ and FMO in gray. Microglia cells were excluded since they are Lyve1. Average percentages for the different subpopulations are shown in the plots (n = 4). d Graphs representing the Lyve1+F4/80+ cell % and Lyve1+F4/80+CX3CR1+ cell % showing an increase of these populations at P3, P8, and P14 after stroke by flow cytometry and Lyve1+F4/80+CX3CR1 cell % showing a decrease of this population at P3, P8, and P14 after stroke. Data are presented as mean value ± SD. Asterisk (*) represents P-value ≤0.05, **P-value ≤0.01, ***P-value ≤0.001, and ****P-value ≤0.0001 (unpaired t-test). e Graphs representing the Lyve1+F4/80+ cell % and Lyve1+F4/80+CXCR4+ cell % showing an increase of the first population at P14 after stroke by flow cytometry. Asterisk (*) represents P-value ≤0.05 (unpaired t-test). Source data are provided as a Source Data file.

References

    1. Aspelund A, et al. A dural lymphatic vascular system that drains brain interstitial fluid and macromolecules. J. Exp. Med. 2015;212:991–999. doi: 10.1084/jem.20142290. - DOI - PMC - PubMed
    1. Ahn, J. H. et al. Meningeal lymphatic vessels at the skull base drain cerebrospinal fluid. Nature572, 62–66 (2019). - PubMed
    1. Ma Q, Ineichen BV, Detmar M, Proulx ST. Outflow of cerebrospinal fluid is predominantly through lymphatic vessels and is reduced in aged mice. Nat. Commun. 2017;8:1434. doi: 10.1038/s41467-017-01484-6. - DOI - PMC - PubMed
    1. van Lessen, M. et al. Intracellular uptake of macromolecules by brain lymphatic endothelial cells during zebrafish embryonic development. Elife6, e25932 (2017). - PMC - PubMed
    1. Absinta M, et al. Human and nonhuman primate meninges harbor lymphatic vessels that can be visualized noninvasively by MRI. Elife. 2017;6:e29738. doi: 10.7554/eLife.29738. - DOI - PMC - PubMed

Publication types