. 2022 Nov 30;13(1):7392.
doi: 10.1038/s41467-022-35198-1.

Cell type diversity in a developing octopus brain

Affiliations

Cell type diversity in a developing octopus brain

Ruth Styfhals et al. Nat Commun. .

Abstract

Octopuses are mollusks that have evolved intricate neural systems comparable with vertebrates in terms of cell number, complexity and size. The brain cell types that control their sophisticated behavioral repertoire are still unknown. Here, we profile the cell diversity of the paralarval Octopus vulgaris brain to build a cell type atlas that comprises mostly neural cells, but also multiple glial subtypes, endothelial cells and fibroblasts. We spatially map cell types to the vertical, subesophageal and optic lobes. Investigation of cell type conservation reveals a shared gene signature between glial cells of mouse, fly and octopus. Genes related to learning and memory are enriched in vertical lobe cells, which show molecular similarities with Kenyon cells in Drosophila. We construct a cell type taxonomy revealing transcriptionally related cell types, which tend to appear in the same brain region. Together, our data sheds light on cell type diversity and evolution in the octopus brain.


Conflict of interest statement

The authors declare no competing interests.

Figures
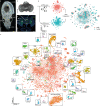
Fig. 1
Fig. 1. Cellular diversity in the developing octopus brain.
a One-day-old Octopus vulgaris paralarva. The dashed line indicates the sectioning plane in c. b Anterior view of a dissected brain. c Representative transversal section of a larva with annotated anatomical structures. d Experimental design of this study. Single cell and nuclei RNA sequencing was performed with 10x Genomics and data integration resulted in a filtered dataset of 17,081 high-quality cells. e t-SNE representation of the integrated sc and snRNA-seq data. Annotated cell types are labeled. All scale bars represent 100 µm. A anterior, ACH cholinergic neurons, AcTub acetylated tubulin, CCAP cardioactive peptide cells, DOP dopaminergic neurons, D dorsal, EC endothelial cells, es esophagus, FBL fibroblasts, fu funnel, GABA GABAergic neurons, GLUT glutamatergic neurons, HC hemocytes, igl inner granular layer, IGL inner granular layer cells, me medulla, OA octopaminergic neurons, ogl outer granular layer, OGL outer granular layer cells, ol optic lobe, P posterior, PEP peptidergic neurons, PREC precursor cells, plx plexiform layer, sem supraesophageal mass, SERT serotonergic neurons, sub subesophageal mass, SUB subesophageal neurons, st statocysts, TBA to be annotated, V ventral, vl vertical lobe, VL vertical lobe cells.
Fig. 2
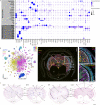
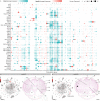
Fig. 2. Neurotransmitters and peptides.
a Dot plot for main neuropeptides and genes involved in the synthesis and transport of neurotransmitters. b Expression of th, vglut, and vacht is visualized on a t-SNE plot. Th (tyrosine hydroxylase) is shown in cyan, vglut (vesicular glutamate transporter) in magenta, and vacht (vesicular acetylcholine transporter) in yellow. c Multiplexed in situ hybridization chain reaction (HCR) for th, vglut, and vacht. The white square is shown in d at a higher magnification. d Multiplexed in situ hybridization chain reaction (HCR) in the optic lobe for th, vglut, and vacht. e Co-expression of th and vglut in the inner granular layer of the optic lobe, together with the cluster-specific marker for IGL2-GLUT/DOP; LOC118767670. f In situ hybridization for vgat (vesicular GABA transporter, GABAergic neurons), tph2 (tryptophan hydroxylase 2, serotonergic neurons), tbh (Tyramine β-hydroxylase, octopaminergic neurons), and the neuropeptide ccap (Crustacean cardioactive peptide). Scale bars represent 100 µm for the overview images. A anterior, es esophagus, fu funnel, igl inner granular layer, ifl inferior frontal lobe, me medulla, ogl outer granular layer, ol optic lobe, pl pedal lobe, plx plexiform layer, P posterior, sfl superior frontal lobe, st statocysts, svl subvertical lobe, vl vertical lobe.
Fig. 3
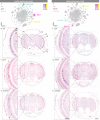
Fig. 3. Optic lobe cell-type diversity.
a Marker expression of outer granular layer cell types. b jeb is expressed throughout dopaminergic neurons in the ogl. c ppp1 is expressed within the ogl, in fewer cells than jeb. d pcdhO2 is expressed in ogl octopaminergic neurons. e Marker expression of inner granular layer cell types. f egfr is expressed in the outer region of the igl. g stard5 is expressed more interiorly within the igl than the egfr + cells. h calbindin is expressed in the most interior side of the igl. In situ hybridizations are shown in bd, fh. Gray boxes indicate magnified regions. Scale bars are 100 µm for overviews and 50 µm for magnifications. es esophagus, fu funnel, igl inner granular layer, me medulla, ogl outer granular layer, ol optic lobe, pl pedal lobe, plx plexiform layer, sfl superior frontal lobe, st statocysts.
Fig. 4
Fig. 4. Cross-species cell-type comparisons identify a glial gene expression signature.
a Cell-type mappings between octopus, fly, and mouse are represented on the t-SNE plot. Mappings are color-coded and alignment scores are shown between brackets. b Best reciprocal blast hits from the mapping between octopus GLIA1, fly ensheathing glia, and non-telencephalic astrocytes in the mouse brain. Glial populations are highlighted in red. c t-SNE representation of two main glial populations in octopus based on the expression of gs2 (Glutamine synthetase 2). d In situ hybridization of gs2 and apolpp (Apolipoprotein). Scale bar represents 100 µm. Representative magnifications of different brain areas are annotated with black boxes. Fluorescent in situ hybridization for apolpp are shown in eg. e Glial cells in the optic lobe. White arrows indicate multiple processes. f Glial cells in the supraesophageal mass. White arrows indicate infiltrating glia. g Glial cells in the subesophageal mass. es esophagus, fu funnel, igl inner granular layer, me medulla, np neuropil, ogl outer granular layer, pkl perikaryal layer, ol optic lobe, pl pedal lobe, plx plexiform layer, SEM supraesophageal mass, st statocysts, SUB subesophageal mass, svl subvertical lobe, vl vertical lobe.
Fig. 5
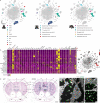
Fig. 5. The molecular profile of the vertical lobe cells.
a Aristaless (arx) expression is limited to the vertical (vl) and the superior frontal lobe (sfl). b cAMP-Dependent protein kinase regulatory subunit type II (pka-R2) expression can be observed mostly in the vl and less within the sfl. c Transmembrane O-Mannosyltransferase Targeting Cadherins 4 (tmtc4) is uniquely expressed within the most anterior part of the vl. t-SNE plots for arx, pka-R2, and tmtc4 are shown in ac together with their respective in situ hybridization. d Top 30 genes with the highest fold change for the vertical lobe cells (VL). Scale bars are 100 µm for the overview images and 50 µm for the magnifications. es esophagus, fu funnel, igl inner granular layer, np neuropil, me medulla, ogl outer granular layer, ol optic lobe, pl pedal lobe, plx plexiform layer, sfl superior frontal lobe, st statocysts, vl vertical lobe.
Fig. 6
Fig. 6. Cell-type specificity and transcription factors.
a Neighbor-joining tree of octopus cell types. Branches with bootstrap support higher than 0.5 are visualized by increasing dot size. Differentially expressed transcription factors (TFs) for each group are shown. b Differentially expressed TFs from a are shown in a dot plot. c Enrichment scores for the TF classes within the ranked list based on tau. d Heatmap of highly variable Homeobox transcription factors, averaged per cell type and scaled.
Fig. 7
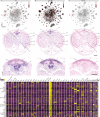
Fig. 7. Protocadherin gene family expansion underlies cellular diversification.
a Dot plot of highly variable protocadherin genes (PCDH). PCDH with a tissue specificity index above 0.85 are considered specific and color-coded in pink. PCDH with a tissue specificity index below 0.85 are broadly expressed and shown in blue. b Protocadherin O1 (pcdhO1) is expressed within serotonergic neurons (SERT). c Protocadherin O2 (pcdhO2) is expressed within the octopaminergic neurons localized in the outer granular layer (OGL3-OA), a positive signal is indicated with a black arrow. Scale bars represent 100 µm. es esophagus, fu funnel, igl inner granular layer, me medulla, ogl outer granular layer, ol optic lobe, pl pedal lobe, plx plexiform layer, sfl superior frontal lobe, st statocysts, vl vertical lobe.

References

    1. Finn JK, Tregenza T, Norman MD. Defensive tool use in a coconut-carrying octopus. Curr. Biol. 2009;19:1069–1070. doi: 10.1016/j.cub.2009.10.052. - DOI - PubMed
    1. Fiorito G, Scotto P. Observational Learning in Octopus vulgaris. Science. 1992;256:545–547. doi: 10.1126/science.256.5056.545. - DOI - PubMed
    1. Schnell AK, Amodio P, Boeckle M, Clayton NS. How intelligent is a cephalopod? Lessons from comparative cognition. Biol. Rev. 2020;96:162–178. doi: 10.1111/brv.12651. - DOI - PubMed
    1. Amodio P, et al. Grow smart and die young: why did cephalopods evolve intelligence? Trends Ecol. Evol. 2019;34:45–56. doi: 10.1016/j.tree.2018.10.010. - DOI - PubMed
    1. Shigeno S, Andrews PLR, Ponte G, Fiorito G. Cephalopod brains: an overview of current knowledge to facilitate comparison with vertebrates. Front. Physiol. 2018;9:1–16. doi: 10.3389/fphys.2018.00952. - DOI - PMC - PubMed

Publication types