Cheminformatics analysis of chemicals that increase estrogen and progesterone synthesis for a breast cancer hazard assessment
- PMID: 36450809
- PMCID: PMC9712655
- DOI: 10.1038/s41598-022-24889-w
Cheminformatics analysis of chemicals that increase estrogen and progesterone synthesis for a breast cancer hazard assessment
Abstract
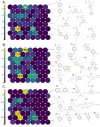
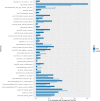
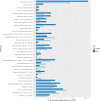
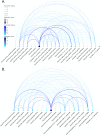
Factors that increase estrogen or progesterone (P4) action are well-established as increasing breast cancer risk, and many first-line treatments to prevent breast cancer recurrence work by blocking estrogen synthesis or action. In previous work, using data from an in vitro steroidogenesis assay developed for the U.S. Environmental Protection Agency (EPA) ToxCast program, we identified 182 chemicals that increased estradiol (E2up) and 185 that increased progesterone (P4up) in human H295R adrenocortical carcinoma cells, an OECD validated assay for steroidogenesis. Chemicals known to induce mammary effects in vivo were very likely to increase E2 or P4 synthesis, further supporting the importance of these pathways for breast cancer. To identify additional chemical exposures that may increase breast cancer risk through E2 or P4 steroidogenesis, we developed a cheminformatics approach to identify structural features associated with these activities and to predict other E2 or P4 steroidogens from their chemical structures. First, we used molecular descriptors and physicochemical properties to cluster the 2,012 chemicals screened in the steroidogenesis assay using a self-organizing map (SOM). Structural features such as triazine, phenol, or more broadly benzene ramified with halide, amine or alcohol, are enriched for E2 or P4up chemicals. Among E2up chemicals, phenol and benzenone are found as significant substructures, along with nitrogen-containing biphenyls. For P4up chemicals, phenol and complex aromatic systems ramified with oxygen-based groups such as flavone or phenolphthalein are significant substructures. Chemicals that are active for both E2up and P4up are enriched with substructures such as dihydroxy phosphanedithione or are small chemicals that contain one benzene ramified with chlorine, alcohol, methyl or primary amine. These results are confirmed with a chemotype ToxPrint analysis. Then, we used machine learning and artificial intelligence algorithms to develop and validate predictive classification QSAR models for E2up and P4up chemicals. These models gave reasonable external prediction performances (balanced accuracy ~ 0.8 and Matthews Coefficient Correlation ~ 0.5) on an external validation. The QSAR models were enriched by adding a confidence score that considers the chemical applicability domain and a ToxPrint assessment of the chemical. This profiling and these models may be useful to direct future testing and risk assessments for chemicals related to breast cancer and other hormonally-mediated outcomes.
© 2022. The Author(s).
Conflict of interest statement
The authors declare no competing interests.
Figures


Similar articles
-
Application of the Key Characteristics Framework to Identify Potential Breast Carcinogens Using Publicly Available in Vivo, in Vitro, and in Silico Data.Environ Health Perspect. 2024 Jan;132(1):17002. doi: 10.1289/EHP13233. Epub 2024 Jan 10. Environ Health Perspect. 2024. PMID: 38197648 Free PMC article.
-
Application of an in Vitro Assay to Identify Chemicals That Increase Estradiol and Progesterone Synthesis and Are Potential Breast Cancer Risk Factors.Environ Health Perspect. 2021 Jul;129(7):77003. doi: 10.1289/EHP8608. Epub 2021 Jul 21. Environ Health Perspect. 2021. PMID: 34287026 Free PMC article.
-
The OECD validation program of the H295R steroidogenesis assay: Phase 3. Final inter-laboratory validation study.Environ Sci Pollut Res Int. 2011 Mar;18(3):503-15. doi: 10.1007/s11356-010-0396-x. Epub 2010 Oct 3. Environ Sci Pollut Res Int. 2011. PMID: 20890769
-
Screening for Chemical Contributions to Breast Cancer Risk: A Case Study for Chemical Safety Evaluation.Environ Health Perspect. 2015 Dec;123(12):1255-64. doi: 10.1289/ehp.1408337. Epub 2015 Jun 2. Environ Health Perspect. 2015. PMID: 26032647 Free PMC article. Review.
-
Evidence on the use of progesterone in menopausal hormone therapy.Climacteric. 2018 Aug;21(4):346-354. doi: 10.1080/13697137.2018.1455657. Epub 2018 Apr 9. Climacteric. 2018. PMID: 29630427 Review.
Cited by
-
Mapping assays to the key characteristics of carcinogens to support decision-making.Database (Oxford). 2025 Apr 22;2025:baaf026. doi: 10.1093/database/baaf026. Database (Oxford). 2025. PMID: 40261741 Free PMC article.
-
Exploring applications of non-targeted analysis in the characterization of the prenatal exposome.Sci Total Environ. 2024 Feb 20;912:169458. doi: 10.1016/j.scitotenv.2023.169458. Epub 2023 Dec 22. Sci Total Environ. 2024. PMID: 38142008 Free PMC article.
-
Application of the Key Characteristics Framework to Identify Potential Breast Carcinogens Using Publicly Available in Vivo, in Vitro, and in Silico Data.Environ Health Perspect. 2024 Jan;132(1):17002. doi: 10.1289/EHP13233. Epub 2024 Jan 10. Environ Health Perspect. 2024. PMID: 38197648 Free PMC article.
-
The key characteristics concept.Curr Opin Toxicol. 2025 Mar;41:100515. doi: 10.1016/j.cotox.2024.100515. Curr Opin Toxicol. 2025. PMID: 40270588 Free PMC article.
References
MeSH terms
Substances
LinkOut - more resources
Full Text Sources
Research Materials

