. 2023 Feb;30(2):429-441.
doi: 10.1038/s41418-022-01095-9. Epub 2022 Nov 30.

PML at mitochondria-associated membranes governs a trimeric complex with NLRP3 and P2X7R that modulates the tumor immune microenvironment

Affiliations

PML at mitochondria-associated membranes governs a trimeric complex with NLRP3 and P2X7R that modulates the tumor immune microenvironment

Sonia Missiroli et al. Cell Death Differ. 2023 Feb.

Abstract

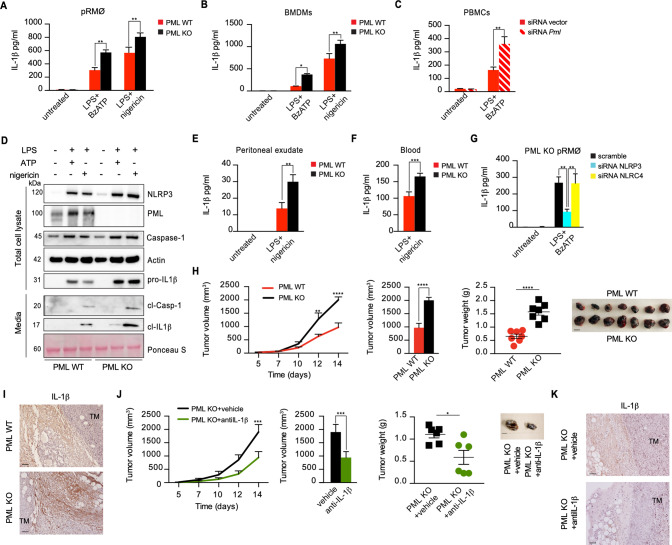
Uncontrolled inflammatory response arising from the tumor microenvironment (TME) significantly contributes to cancer progression, prompting an investigation and careful evaluation of counter-regulatory mechanisms. We identified a trimeric complex at the mitochondria-associated membranes (MAMs), in which the purinergic P2X7 receptor - NLRP3 inflammasome liaison is fine-tuned by the tumor suppressor PML. PML downregulation drives an exacerbated immune response due to a loss of P2X7R-NLRP3 restraint that boosts tumor growth. PML mislocalization from MAMs elicits an uncontrolled NLRP3 activation, and consequent cytokines blast fueling cancer and worsening the tumor prognosis in different human cancers. New mechanistic insights are provided for the PML-P2X7R-NLRP3 axis to govern the TME in human carcinogenesis, fostering new targeted therapeutic approaches.


Conflict of interest statement

The authors declare no competing interests.

Figures

Fig. 1
Fig. 1. PML at MAMs orchestrates the interaction between P2X7R and NLRP3.
A Endoplasmic reticulum (ER) fraction obtained from the liver of wild-type (WT) mice was used for co-immunoprecipitation (Co-IP) of endogenous PML with NLRP3. Using PML as a bait, the levels of NLRP3 were detected, showing the interaction between NLRP3 and PML. B Proximity ligation assay (PLA) showing the interaction of NLRP3 with PML (red dots) in the ER fraction of WT resident peritoneal macrophages (pRMØs) left untreated or treated with LPS and nigericin. PDI (green) was used as an ER marker (scale bars, 20 μm). In the bottom panel, the zoomed regions display interaction sites at the ER (scale bar, 2 μm). In the upper right panel, the columns show the quantification of the PLA signal between NLRP3 and PML. Bars: mean ± SEM. (n = 3 independent experiments) C Confocal immunofluorescence staining images of NLRP3 (red) and calnexin (used as an ER marker, green) in WT and Pml−/− pRMØs untreated or treated with LPS and nigericin (scale bars, 5 μm). Merged images of the two immunostainings are shown. The right panel shows the proportion of clustered NLRP3 on the total NLRP3 signal. Bars: median. *p < 0.05. D Left panels show immunoblots of subcellular fractions isolated from WT and Pml−/− BMDMs. Where indicated, cells were exposed to LPS and nigericin treatment. The following markers were used: IP3R3 for the ER, VDAC for mitochondria (Mp, mito pure), Sigma 1-R for MAMs, and GAPDH for Cyt (cytosol). H: homogenate. Right panels show the quantification of the P2X7R and NLRP3 proteins in the ER and MAM fractions normalized to the amounts of IP3R3 and Sigma 1-R. The middle lines of each bar represent the mean values (n = 3 independent experiments). E ER fractions obtained from the livers of WT and Pml−/− mice were used for the Co-IP of endogenous NLRP3 with P2X7R. Using NLRP3 as bait, the presence of P2X7R was detected, showing that the interaction between NLRP3 and P2X7R depends on whether PML is lacking or after inflammasome activation. The lower panel shows the fold change of the NLRP3-P2X7R interaction; the middle lines of each bar represent the mean values (n = 3 independent experiments). F PLA shows the interaction between P2X7R and NLRP3 (red dots) in the ER of WT and Pml−/− pRMØs, untreated or treated with LPS and nigericin. PDI (green) was used as an ER marker. Scale bars, 20 μm. Higher magnifications show interaction sites at the ER (scale bars, 2 μm). In the right bar graphs, quantification of the number of PLA red dots per cell revealed an increased P2X7R-NLRP3 interaction in Pml−/− pRMØs. Data are shown as the mean ± SEM. Two independent experiments were carried out in triplicate. *p < 0.05, ****p < 0.0001. G Co-IP of endogenous PML and P2X7R in ER fraction obtained from WT mouse liver (as in a). Using PML as bait, the expression of P2X7R was detected, showing the interaction between P2X7R and PML. H Representative PLA (red dots) images of WT pRMØs untreated or treated with LPS and nigericin. PDI (green) was used as an ER marker. Scale bars, 20 μm. Higher magnifications show interaction sites at the ER (scale bars, 2 μm). The column graph on the right shows a quantitative analysis of the PLA signal between PML and P2X7R. Bars: mean ± SEM. Two independent experiments were carried out in triplicate.
Fig. 2
Fig. 2. PML deficiency in the host favors increased IL-1β secretion in response to inflammasome activation, which in turn promotes tumor growth.
pRMØs (A) and BMDMs (B) from WT (red columns) and Pml−/− mice (black columns) were left untreated or stimulated with LPS and Bz-ATP or LPS and nigericin. The IL-1β levels in the supernatants were determined by ELISA. Error bars indicate the SEM of 3 independent experiments carried out in triplicate. *p < 0.05, **p < 0.01 C ELISA of mature IL-1β in the supernatants of siRNA-transfected PBMCs upon stimulation with LPS together with Bz-ATP. PBMCs were transfected with scramble or PML siRNA. Error bars indicate the SEM of 3 independent experiments carried out in triplicate. **p < 0.01. D The culture media and total cell lysates of pRMØs from WT and Pml−/− mice were collected before and after activation with LPS plus ATP or LPS and nigericin and were resolved by SDS–PAGE. The results shown are representative of 3 independent experiments. ELISA of IL-1β from peritoneal exudate (E) and blood (F) samples from WT (red columns) and Pml−/− mice (black columns) that were untreated or treated with LPS plus nigericin. Bars: mean ± SEM of 3 independent experiments carried out in triplicate. **p < 0.01, ***p < 0.001. G ELISA of IL-1β in Pml−/− pRMØs stimulated with LPS and Bz-ATP after transfection with scramble, siRNA NLRP3 and siRNA NLRC4. Bars: mean ± SEM of 3 independent experiments. **p < 0.01. H WT (red) and Pml−/− (black) C57BL/6 mice (7 per group) were injected subcutaneously with B16-F10 melanoma cells (1 × 10⁶). The left graph shows tumor growth for 2 weeks after the injection. The middle graphs show the quantified tumor volumes and weights at 14 days post-injection. Error bars indicate SEM. **p < 0.01, ****p < 0.0001. The right panel shows representative tumors excised at the same time point (scale bar: 1 cm). I Immunohistochemistry (IHC) revealed much higher IL-1β immunoreactivity (IR) in the peritumoral areas of melanoma-bearing Pml−/− mice than in that of WT mice. TM: tumor mass. Nuclei were counterstained with Harris’ hematoxylin (HH). Scale bars: 50 μm. J Pml−/− C57BL/6 mice were injected subcutaneously with B16-F10 melanoma cells (1 × 10⁶). An experimental group (green; n = 6) was injected IP with IL-1β antiserum (50 µg twice weekly; clone B122; BioXCell), while a blank group (black; n = 6) was injected IP with equal amounts of isotope control antibodies. The left graph shows tumor growth for 14 days after the injection. The middle graphs show the quantified tumor volumes and weights at 14 days post-injection. Error bars indicate SEM. **p < 0.05, ****p < 0.001. The right panel shows representative tumors excised at the same time point (scale bar: 1 cm). K IHC revealed an almost complete lack of IL-1β-IR in the peritumoral areas of melanoma-bearing Pml−/− mice treated in vivo with IL-1β antiserum compared with those of the blank group. TM tumor mass. Nuclei were counterstained with HH. Scale bars: 50 μm.
Fig. 3
Fig. 3. Misdirected TAMs accelerate tumor progression in Pml−/− hosts.
A Representative tumor sections excised from WT (upper panels) and Pml−/− mice (lower panels), stained with H/E or immunostained for F4/80, iNOS, CD206 (mannose receptor; manR) and Ly6g; nuclei were counterstained with HH. Note the high number of free cells in the peritumoral areas and their larger occurrence in Pml−/− mice. TM: tumor mass. Scale bars: 50 µm. B The peritumoral tissue of Pml−/− mice (black columns) is distinctly enriched with F4/80-, mannose receptor- and Ly6g-immunoreactive cells and almost devoid of iNOS-immunoreactive cells compared with that of WT mice, depicting an immunosuppressive environment. The data are expressed as the mean ± SEM. Significantly different from WT mice *p < 0.05, **p < 0.01, ****p < 0.0001. C Absolute number of TAMs (CD3- CD45R- F4/80+ CD11b+)/tumor mass from WT and Pml−/− mice (n = 7 per group). TAM polarization was analyzed by measuring CD86 and MHC-II expression based on the mean fluorescence intensity (MFI). Left panels: the dots indicate the results of individual mice, and the lines indicate the mean values. **p < 0.01. Right panels: representative histogram plots from 2 mice/group of CD86 and MHC-II expression in macrophages. D Analysis of tumor growth after bone marrow replacement. WT mice were lethally irradiated to induce myeloablation and then transplanted with bone marrow from WT (PML-WT > PML-WT) or Pml−/− (PML-KO > PML-WT) animals. Bone marrow reconstitution was monitored for 16 weeks (Supplementary Fig. S4 and Methods section), then chimeric mice were subcutaneously injected with 1 × 106 B16-F10 melanoma cells. Tumor growth was monitored at the indicated time points. Numerical results are expressed as the mean ± SEM (n = 4 per group). E Co-culture with activated Pml−/− macrophages showed a larger tumor cell growth-promoting effect compared to that exerted by WT macrophages. B16-F10 cells were co-cultured with pRMØs from WT and Pml−/− mice and treated daily with LPS and Bz-ATP. After one week, the proliferation of B16-F10 cells was analyzed by crystal violet staining (595 nm absorbance). Experiments were performed twice, and the error bars indicate SEM. ****p < 0.0001.
Fig. 4
Fig. 4. Inverse correlation between PML expression and IL-1β release in patients’ TME.
A Histological sections of human melanoma tissue samples representative also of the peritumoral tissue and belonging to long-survival (up to 5 years) and short-survival (less than 5 years) patients were immunostained for CD68, CD206, IL-1β and PML (see labels). Representative areas are shown at higher magnification to detail the protein expression in macrophages (CD206; arrows) and the differential subcellular localization of PML (arrows). IL-1β levels were closely correlated with the occurrence of CD68+ TAMs, the differential subcellular localization of PML, and poor prognosis. B Patient survival was negatively correlated with TAM M2 polarization and IL-1β expression. C Il-1β expression levels in human melanoma tissue samples and 5-year survival rates. D The nuclear localization of PML was predictive of poor prognosis for melanoma patients.
Fig. 5
Fig. 5. Genetic ablation of the P2X7R/NLRP3 axis reduces IL-1β levels and cancer development.
pRMØs (A) and BMDMs (B) from Pml−/−, Pml−/−/P2x7r−/− and Pml−/−/Nlrp3−/− mice were left unstimulated or stimulated with LPS plus Bz-ATP. The IL-1β levels in the supernatants were determined by ELISA. Bars: mean ± SEM of 3 independent experiments carried out in triplicate. ****p < 0.0001. ELISA of IL-1β levels in peritoneal exudate (C) and blood (D) samples from Pml−/−, Pml−/−/P2x7r−/− and Pml−/−/Nlrp3−/− mice after treatment with LPS and nigericin. Bars: mean ± SEM of 3 independent experiments carried out in triplicate. ***p < 0.001. ****p < 0.0001. E Pml−/− (black line) and Pml−/−/Nlrp3−/− (purple line) C57BL/6 mice (6 per group) were injected subcutaneously with B16-F10 melanoma cells (1 × 106). Left panel, the graph shows the tumor kinetics at the indicated time points. The middle panels show the quantified tumor volumes and tumor weights at 14 days post-injection. Error bars indicate SEM. **p < 0.01, ****p < 0.0001. The right panel shows representative tumors excised at the same time point (scale bars: 1 cm). F. Pml−/− (black line) and Pml−/−/P2x7r−/− (gray line) C57BL/6 mice (6 per group) were injected subcutaneously with B16-F10 melanoma cells (1 × 106). Tumor growth was analyzed as described in e. Error bars indicate SEM. *p < 0.05, **p < 0.01, ***p < 0.001. Scale bar: 1 cm. G Representative tumor sections from specimens of different mouse groups: Pml−/− (upper panels), Pml−/−/Nlrp3−/− (middle panels) and Pml−/−/P2x7r−/− (lower panels). The sections were stained with H/E or immunostained for IL-1β, F4/80, iNOS, mannose receptor (manR) and Ly6g. Nuclei were counterstained with HH. TM: tumor mass. Bars: 50 µm. It is worth noting the massive recruitment of free cells and IL-1β immunoreactivity in the peritumoral areas of Pml−/− mice, which was otherwise hardly detectable in double-knockout mice. H Quantification of the cell density (N/mm2) in peritumoral tissues revealed significantly higher numbers of F4/80-, mannose receptor-, and Ly6g-immunoreactive cells in Pml−/− mice than in Pml−/−/P2x7r−/−and Pml−/−/Nlrp3−/− mice, while no significant differences were found in the numbers of iNOS-immunoreactive cells among the groups. Error bars indicate SEM *p < 0.05, ***p < 0.001, ****p < 0.0001.

References

    1. Pinton P, Giorgi C, Pandolfi PP. The role of PML in the control of apoptotic cell fate: a new key player at ER-mitochondria sites. Cell Death Differ. 2011;18:1450–6. doi: 10.1038/cdd.2011.31. - DOI - PMC - PubMed
    1. Giorgi C, Ito K, Lin HK, Santangelo C, Wieckowski MR, Lebiedzinska M, et al. PML regulates apoptosis at endoplasmic reticulum by modulating calcium release. Science. 2010;330:1247–51. doi: 10.1126/science.1189157. - DOI - PMC - PubMed
    1. Missiroli S, Bonora M, Patergnani S, Poletti F, Perrone M, Gafa R, et al. PML at mitochondria-associated membranes is critical for the repression of autophagy and cancer development. Cell Rep. 2016;16:2415–27. doi: 10.1016/j.celrep.2016.07.082. - DOI - PMC - PubMed
    1. Zhou R, Yazdi AS, Menu P, Tschopp J. A role for mitochondria in NLRP3 inflammasome activation. Nature. 2011;469:221–5. doi: 10.1038/nature09663. - DOI - PubMed
    1. Missiroli S, Patergnani S, Caroccia N, Pedriali G, Perrone M, Previati M, et al. Mitochondria-associated membranes (MAMs) and inflammation. Cell Death Dis. 2018;9:329. doi: 10.1038/s41419-017-0027-2. - DOI - PMC - PubMed

Publication types

MeSH terms