. 2022 Dec;612(7939):301-309.
doi: 10.1038/s41586-022-05448-9. Epub 2022 Nov 30.

Common and rare variant associations with clonal haematopoiesis phenotypes

Affiliations

Common and rare variant associations with clonal haematopoiesis phenotypes

Michael D Kessler et al. Nature. 2022 Dec.

Erratum in

  • Author Correction: Common and rare variant associations with clonal haematopoiesis phenotypes.
    Kessler MD, Damask A, O'Keeffe S, Banerjee N, Li D, Watanabe K, Marketta A, Van Meter M, Semrau S, Horowitz J, Tang J, Kosmicki JA, Rajagopal VM, Zou Y, Houvras Y, Ghosh A, Gillies C, Mbatchou J, White RR, Verweij N, Bovijn J, Parikshak NN, LeBlanc MG, Jones M; Regeneron Genetics Center; GHS-RGC DiscovEHR Collaboration; Glass DJ, Lotta LA, Cantor MN, Atwal GS, Locke AE, Ferreira MAR, Deering R, Paulding C, Shuldiner AR, Thurston G, Ferrando AA, Salerno W, Reid JG, Overton JD, Marchini J, Kang HM, Baras A, Abecasis GR, Jorgenson E. Kessler MD, et al. Nature. 2023 Mar;615(7950):E3. doi: 10.1038/s41586-023-05803-4. Nature. 2023. PMID: 36807635 Free PMC article. No abstract available.
  • Author Correction: Common and rare variant associations with clonal haematopoiesis phenotypes.
    Kessler MD, Damask A, O'Keeffe S, Banerjee N, Li D, Watanabe K, Marketta A, Van Meter M, Semrau S, Horowitz J, Tang J, Kosmicki JA, Rajagopal VM, Zou Y, Houvras Y, Ghosh A, Gillies C, Mbatchou J, White RR, Verweij N, Bovijn J, Parikshak NN, LeBlanc MG, Jones M; Regeneron Genetics Center; GHS-RGC DiscovEHR Collaboration; Glass DJ, Lotta LA, Cantor MN, Atwal GS, Locke AE, Ferreira MAR, Deering R, Paulding C, Shuldiner AR, Thurston G, Ferrando AA, Salerno W, Reid JG, Overton JD, Marchini J, Kang HM, Baras A, Abecasis GR, Jorgenson E. Kessler MD, et al. Nature. 2025 Jan;637(8047):E27. doi: 10.1038/s41586-024-08572-w. Nature. 2025. PMID: 39779868 No abstract available.

Abstract

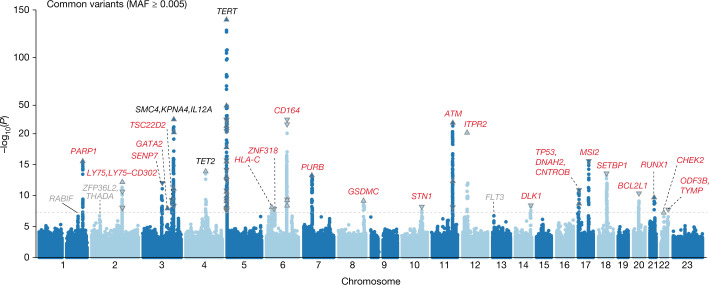
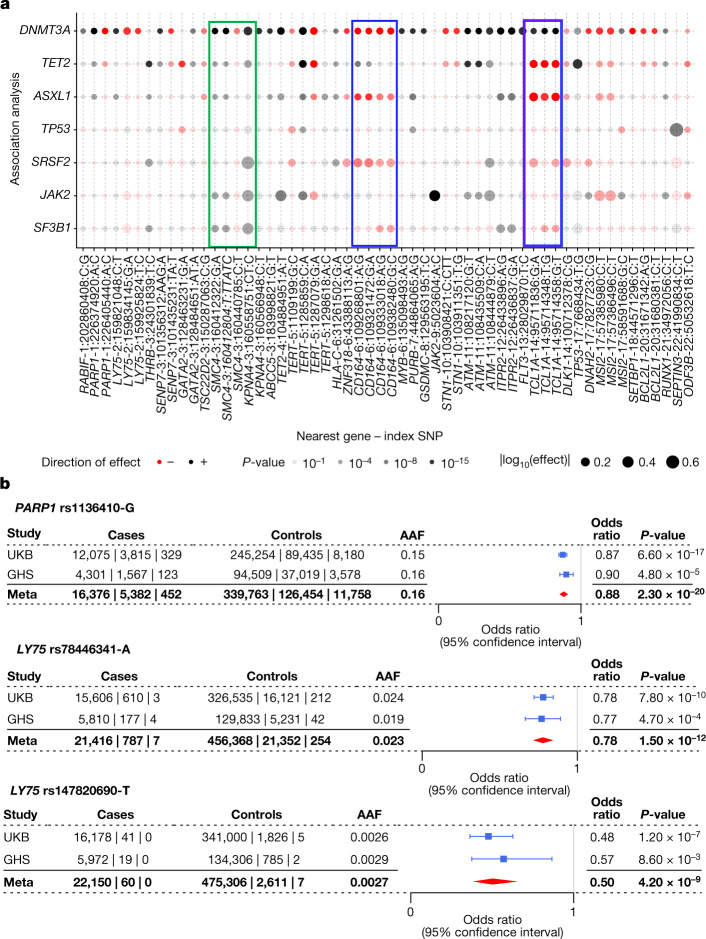
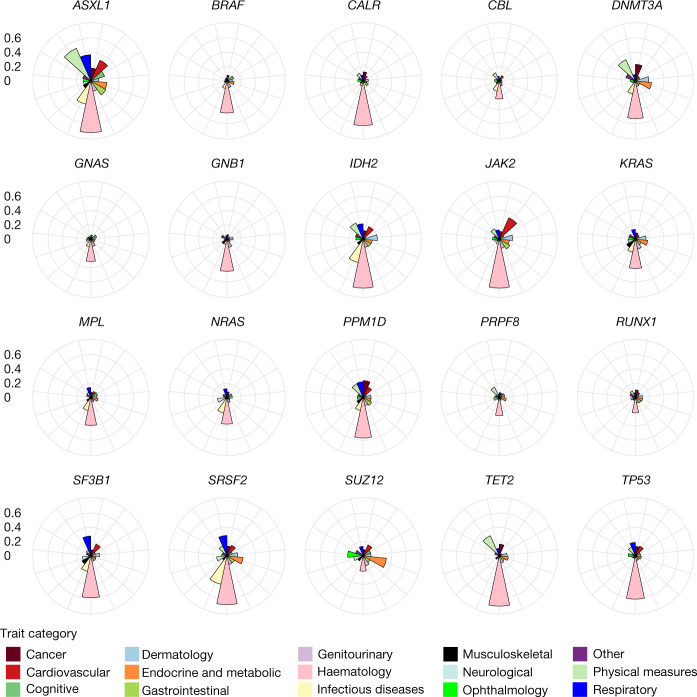
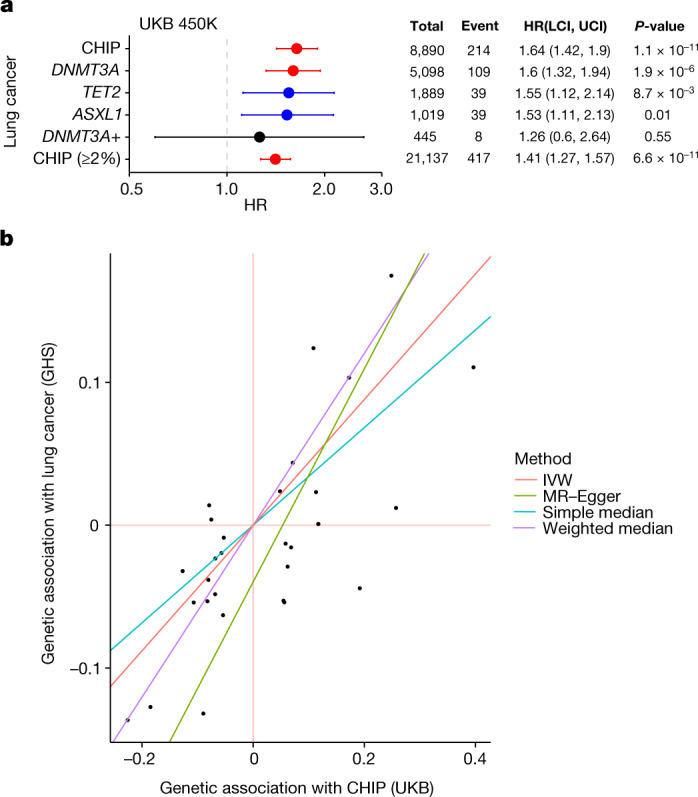
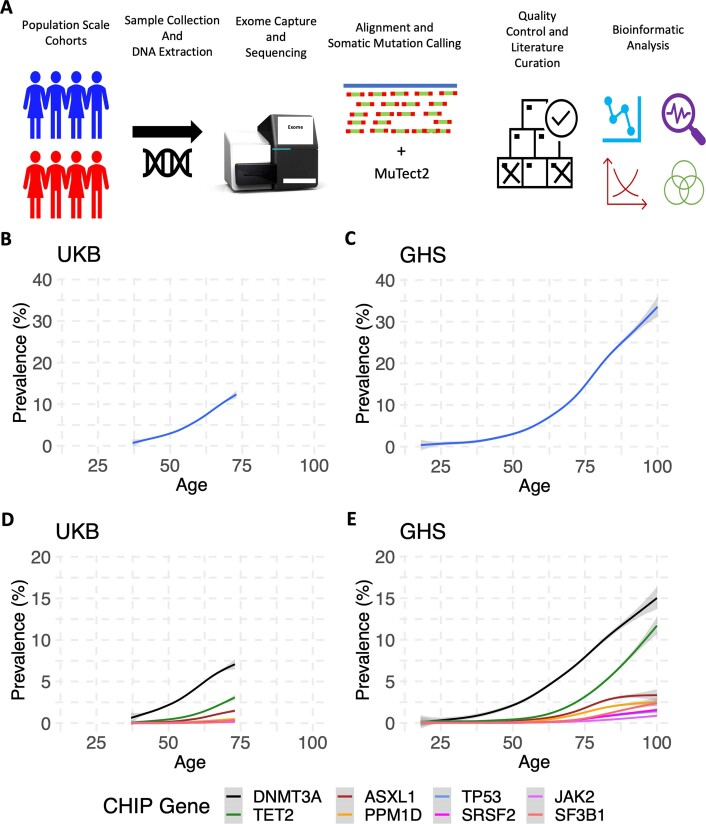
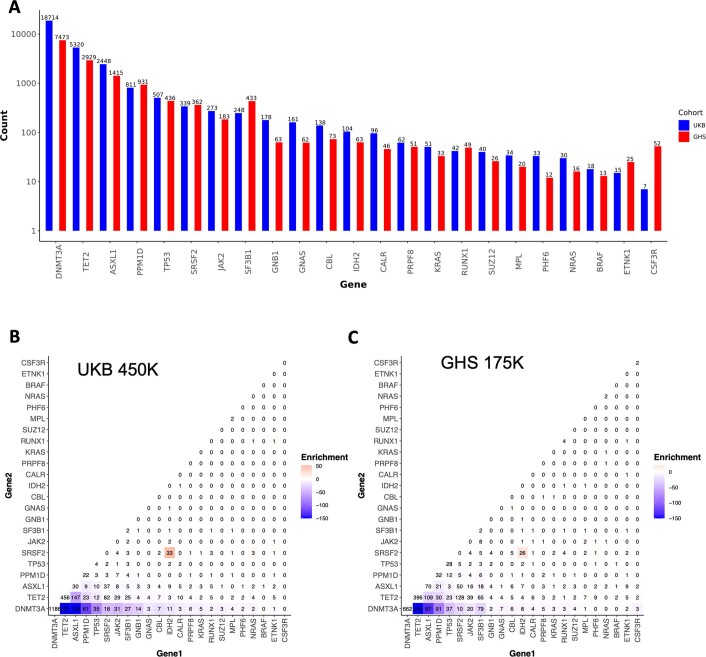
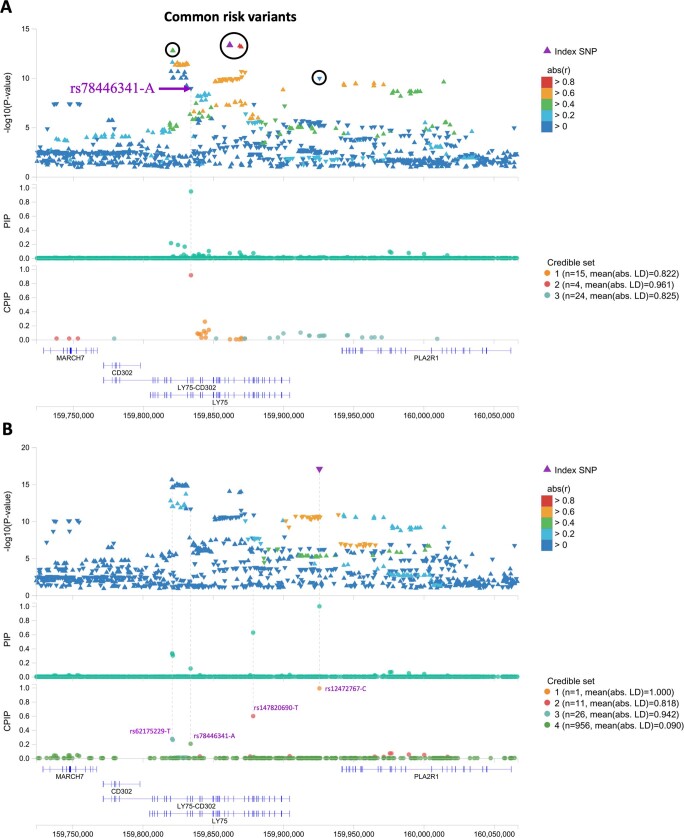
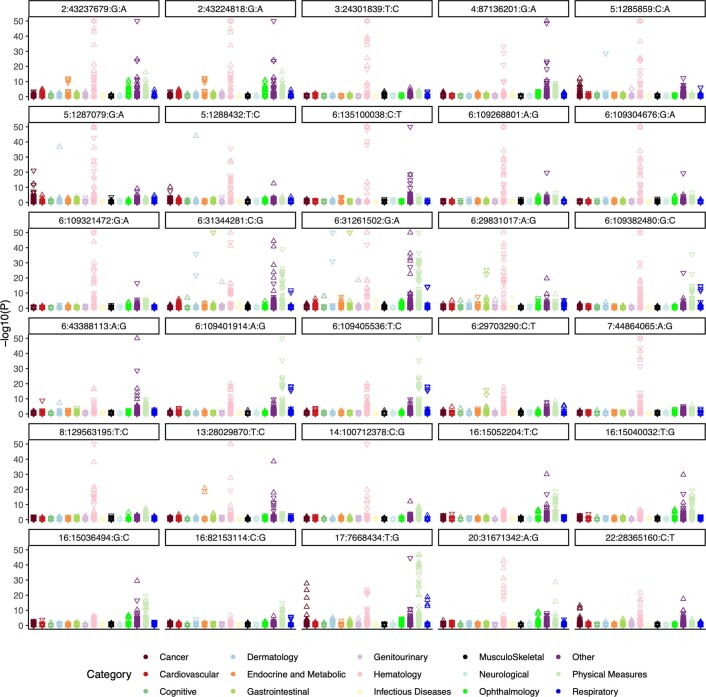
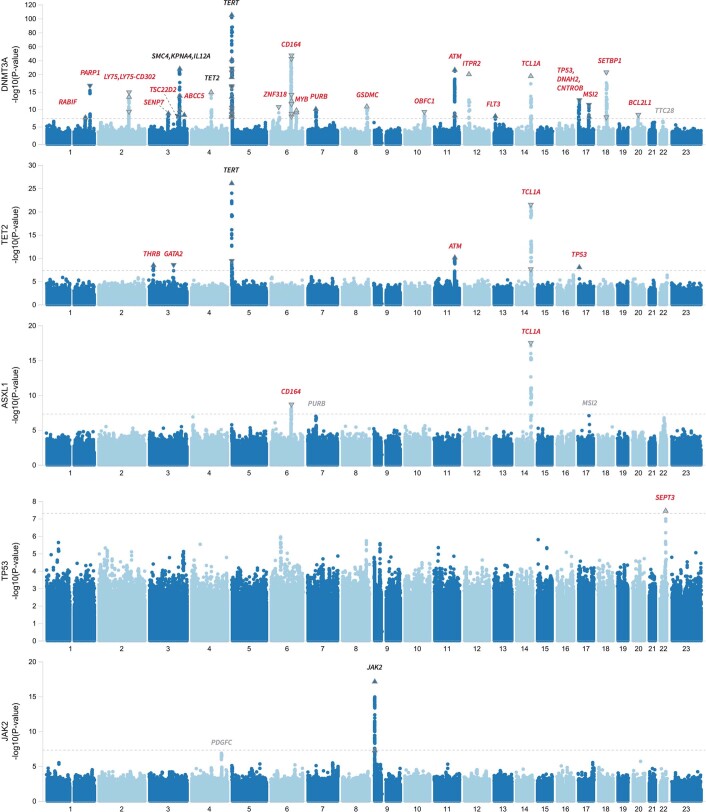
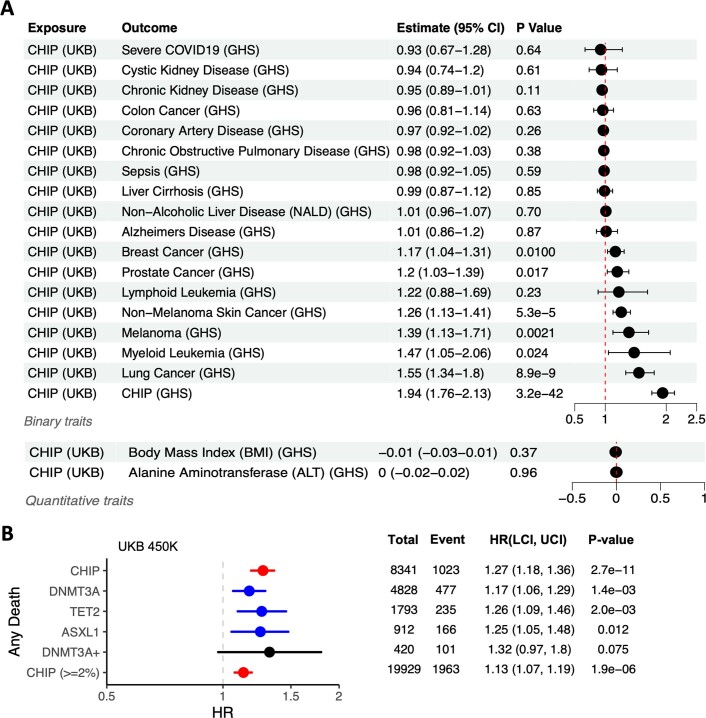
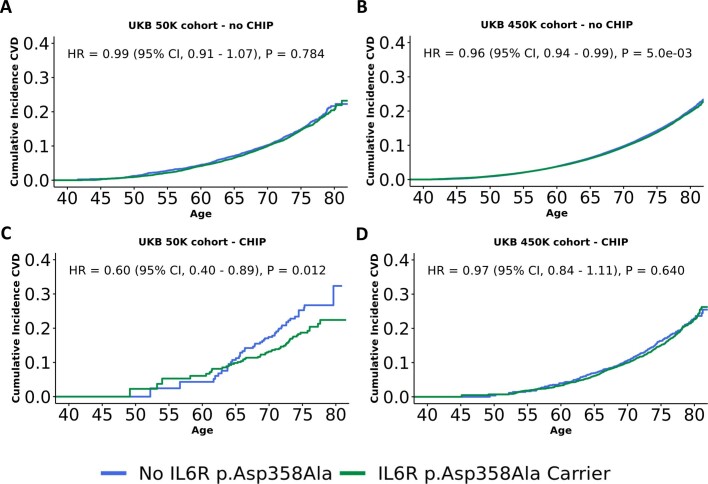
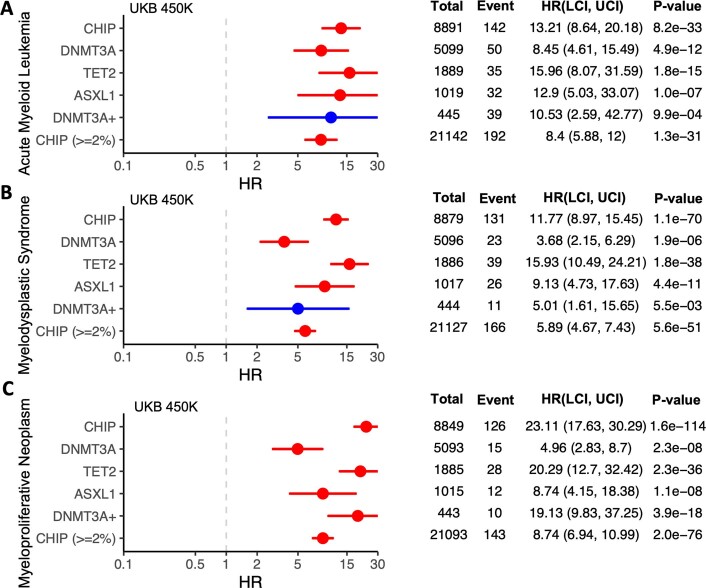
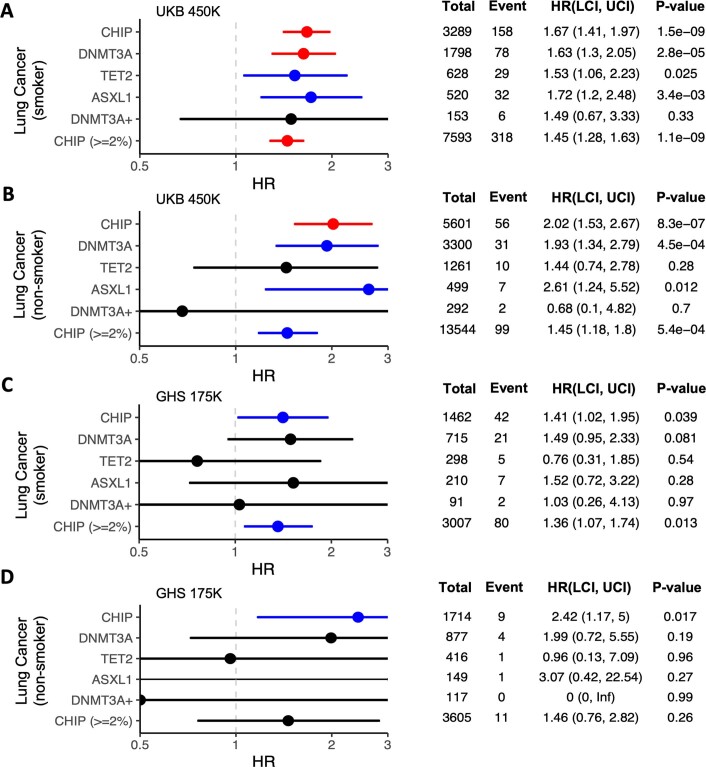
Clonal haematopoiesis involves the expansion of certain blood cell lineages and has been associated with ageing and adverse health outcomes1-5. Here we use exome sequence data on 628,388 individuals to identify 40,208 carriers of clonal haematopoiesis of indeterminate potential (CHIP). Using genome-wide and exome-wide association analyses, we identify 24 loci (21 of which are novel) where germline genetic variation influences predisposition to CHIP, including missense variants in the lymphocytic antigen coding gene LY75, which are associated with reduced incidence of CHIP. We also identify novel rare variant associations with clonal haematopoiesis and telomere length. Analysis of 5,041 health traits from the UK Biobank (UKB) found relationships between CHIP and severe COVID-19 outcomes, cardiovascular disease, haematologic traits, malignancy, smoking, obesity, infection and all-cause mortality. Longitudinal and Mendelian randomization analyses revealed that CHIP is associated with solid cancers, including non-melanoma skin cancer and lung cancer, and that CHIP linked to DNMT3A is associated with the subsequent development of myeloid but not lymphoid leukaemias. Additionally, contrary to previous findings from the initial 50,000 UKB exomes6, our results in the full sample do not support a role for IL-6 inhibition in reducing the risk of cardiovascular disease among CHIP carriers. Our findings demonstrate that CHIP represents a complex set of heterogeneous phenotypes with shared and unique germline genetic causes and varied clinical implications.


Conflict of interest statement

M.D.K., A.D., S.O., N.B., D.L., K.W., A.M., M.V.M., S.S., J.H., J.T., J.A.K., V.M.R., Y.Z., Y.H., A.G., C.G., J. Mbatchou, R.R.W., N.V., J.B., N.N.P., M.G.L., M.J., D.J.G., L.A.L., M.N.C., G.S.A., A.E.L., M.A.R.F., R.D., C.P., A.R.S., G.T., A.A.F., W.S., J.G.R., J.D.O., J. Marchini, H.M.K., A.B., G.R.A. and E.J. are current employees and/or stockholders of Regeneron Genetics Center or Regeneron Pharmaceuticals.

Figures

Fig. 1
Fig. 1. GWAS of CHIP.
Manhattan plot showing results from a genome-wide association analysis of CHIP. Twenty-four loci reach genome-wide significance (P ≤ 5 × 10−8, dashed line), and top-associated variants per locus are labelled with biologically relevant genes. Three of these loci have been previously identified (black), whereas 21 represent novel associations (red). Loci with suggestive signal (P ≤ 5 × 10−7) are labelled in grey. Association models were run with age, age2, sex and age × sex, and 10 ancestry-informative principal components as covariates. P-values are uncorrected and are from two-sided tests performed using approximate Firth logistic regression.
Fig. 2
Fig. 2. Germline effect size comparisons across CHIP and Forest plots of PARP1 and LY75 missense variants.
a, Using results from CHIP gene-specific association analyses, effect sizes of index SNPs are compared across CHIP subtypes. SNPs were chosen as those that were independent on the basis of clumping and thresholding (with some refinement based on our conditionally independent variant list) and genome-wide significant in at least one association with CHIP or a CHIP subtype. Certain loci showed notably different effects across CHIP subtypes, as seen at the CD164 locus, which was associated with DNMT3A CHIP and ASXL1 CHIP but not TET2 CHIP, and the TCL1A locus, which was associated with increased risk of DNMT3A CHIP but reduced risk of other CHIP subtypes (blue rectangles). b, Forest plots are shown reflecting the protective associations of a PARP1 missense variant (rs1136410-G) and two LY75 missense variants (rs78446341-A, rs147820690-T) with our DNMT3A CHIP phenotype in the UKB and GHS cohorts. Centre points represent odds ratios as estimated by approximate Firth logistic regression, with errors bars representing 95% confidence intervals. P-values are uncorrected and reflect two-sided tests. Numbers below the cases and controls columns represent counts of individuals with homozygote reference, heterozygote and homozygous alternative genotypes, respectively.
Fig. 3
Fig. 3. Phenome association profiles per CHIP subtype.
Profiles are shown for each CHIP gene subtype reflecting phenome-wide association results. The y-axis (concentric circles) represents the proportion of phenotypes within a trait category that were nominally associated (P ≤ 0.05) with carrier status of the CHIP gene. A CHIP gene had to have at least one disease category with the proportion of associated phenotypes ≥ 0.2 to be included in the figure. As expected, haematological traits show the largest proportion of phenotypic trait associations overall. The largest number of cancer associations are seen for DNMT3A CHIP, whereas JAK2 CHIP shows the highest proportion of cardiovascular associations. Respiratory associations are most pronounced for ASXL1 CHIP. SUZ12 CHIP shows a unique profile across CHIP subtypes, with a higher proportion of ophthalmological and endocrine associations. Association models were run with age, age2, sex and age × sex, and ten ancestry-informative principal components as covariates.
Fig. 4
Fig. 4. Increased risk of lung cancer among CHIP carriers.
a, Forest plot and table featuring hazard ratio estimates from Cox proportional hazard models of the risk lung cancer among CHIP carriers. Error bars represent a 95% confidence interval. Associations are similar across common CHIP subtypes, as well as among CHIP carriers with lower VAF (≥2%). Models are adjusted for sex, low density lipoprotein, high density lipoprotein, smoking status, pack years, BMI, essential primary hypertension, type 2 diabetes mellitus, and 10 genetic principal components specific to a European ancestral background. HR, hazard ratio. UKB 450K, the 450,00-participant full UKB dataset. DNMT3A+ represents subjects with DNMT3A CHIP and at least one other type of CHIP mutation. b, Estimated associations via four Mendelian randomization methods between CHIP and lung cancer. Each point represents one of 29 instrumental variables (that is, conditionally independent SNPs) that were identified in the UKB cohort as associated with CHIP. The x-axis shows the effect estimate (beta) of the SNP on CHIP in the UKB cohort, and the y-axis shows the effect estimate (beta) of the SNP on lung cancer in the GHS cohort. The slope of each regression line represents the effect size estimated by respective methods. IVW, inverse variance weighted.
Extended Data Fig. 1
Extended Data Fig. 1. Workflow to Identify CHIP and Prevalence Estimates For Carriers of CHIP Mutations.
A. Graphic depicting at a high-level the workflow used to collect and sequence the exomes of multiple large cohorts and to then identify CHIP mutations from this data. B-C. CHIP prevalence increases with age of donor at time of DNA collection in both the UKB (B, n = 484,629 individuals; one-sided F-test, P < 10−16) and GHS (C, n = 157,724 individuals; one-sided F-test, P < 10−16) cohorts, with the centre line representing the general additive model spline and the shaded region representing the 95% confidence interval. D-E. Similar to B-C, the prevalence of CHIP mutations per CHIP gene for each of the top 8 most common CHIP genes increase with age in the UKB (D, n = 484,629 individuals; one-sided F-test, P < 10−16) and in GHS (E, n = 157,724 individuals; one-sided F-test, P < 10−16).
Extended Data Fig. 2
Extended Data Fig. 2. Count Distribution and Pairwise Enrichments of Clonal Hematopoiesis of Indeterminate Potential (CHIP) Gene Mutations.
A. Total number of individuals with mutations (y axis, log10 scale) in each of the 23 genes that were used to determine CHIP status across the UKB (blue) and GHS (red) CHIP callsets. B-C. Pairwise mutation counts across the UKB (B) and DiscoverEHR (C) callsets across individuals with at least two identified CHIP mutations. The color scale reflects the significance of the p-value for association between mutated CHIP gene pairs as determined by logistic regression. Per CHIP gene pair, these models included CHIP gene 1 mutation carrier status as the outcome, CHIP gene 2 mutation carrier status as the predictor, and age, sex, and smoking status (ever vs never) as covariates. P values are log10 transformed (see Table S1 for complete enrichment results).
Extended Data Fig. 3
Extended Data Fig. 3. Finemapping results at the LY75 locus on chromosome 2.
A. Fine-mapping the summary statistics from our association analysis of CHIP prioritizes the P1247L missense variant (rs78446341-A, AAF = 0.02) as highly likely to be the causal variant driving one of three causal signals at this locus (CPIP = 0.913). At the top of the panel, a locus zoom plot shows marginal association results after inverse variance weighted meta analysis across UKB and GHS (p-values are uncorrected and derive from two-sided tests performed using approximate Firth logistic regression and subsequent meta analysis). Top common variants, including those prioritized by clumping and thresholding and COJO from UKB associations are highlighted with black circles. The rs78446341-A missense variant is highlighted as well and is in low linkage disequilibrium (LD) with the other SNPs. FINEMAP estimated 3 signals were most parsimonious here (PP = 0.55). B. Fine-mapping the summary statistics from our association analysis of DNMT3A-CHIP prioritizes the P1247L missense variant (rs78446341-A, MAF = 0.02, CPIP = 0.20, CS = 4) and the rarer G525E missense variant (rs147820690-T, AAF = 0.002 CPIP = 0.60, CS = 2) as likely to be the causal variants driving the signal at two out of four causal signals at this locus. Here, FINEMAP estimated 3 signals (PP = 0.57) or 4 signals (PP = 0.41) were likely; we report results for K = 3 in Table S6 and show results from K = 4 here. The other prioritized signals are those identified by clumping and thresholding and COJO: rs12472767-C (2-159925824-T-C, CPIP = 0.99, CS = 1) and rs12472767-C (2-159821048-C-T, CPIP = 0.28, CS = 3). CS: Credible Set, PP: Posterior Probability, PIP: Posterior Inclusions Probability, CPIP: Conditional Posterior Inclusion Probability.
Extended Data Fig. 4
Extended Data Fig. 4. Results from a phenome-wide association analysis.
Results from a phenome-wide association analysis are shown for the thirty SNPs from our GWAS that had the largest number of significant associations (P < 5 x 10⁻⁸). Associations are most common among hematological, body mass, and auto-immune traits (seen across the ‘dermatology’, ‘gastroenterology’, and ‘other’ phenotypic categories). For visualization, associations with –log10(P) < 50 were set to 50. Association models were run with age, age2, sex, and age-by-sex, and 10 ancestry-informative principal components (PCs) as covariates. P-values are uncorrected and derive from two-sided tests performed using approximate Firth logistic regression. See Table S10 for full associations results.
Extended Data Fig. 5
Extended Data Fig. 5. GWAS of CHIP Subtypes.
Manhattan plot showing results from a genome-wide association analysis of CHIP subtypes. While we ran CHIP subtype analysis for each of the 8 most recurrently mutated CHIP genes (Tables S11–S19), we show Manhattan plots for the 5 CHIP subtypes that had at least 1 genome-wide significant common variant association. These included DNMT3A-CHIP (23 significant loci), TET2-CHIP (6 significant loci), ASXL1-CHIP (2 significant loci), TP53-CHIP (1 significant locus), and JAK2-CHIP (1 significant locus). Novel biologically relevant genes are labeled at each locus, with red denoting novel loci, black identifying previously identified loci and grey identifying loci with suggestive signal (P < 5 x 10⁻⁷). Association models were run with age, age2, sex, and age-by-sex, and 10 ancestry-informative principal components (PCs) as covariates. P-values are uncorrected and are from two-sided tests performed using approximate Firth logistic regression.
Extended Data Fig. 6
Extended Data Fig. 6. Results from Mendelian Randomization models and incident risk of death among CHIP carriers.
A. Forest plot of results from Two Sample Mendelian Randomization (MR) modeling of the effect of CHIP on 20 traits of interest (including the two quantitative traits BMI and ALT). Reported p-values are uncorrected, and reflect two-sided Z-tests derived from an inverse variance weighted (IVW) MR procedure. Significant causal association between CHIP and breast cancer, prostate cancer, non-melanoma skin cancer, melanoma, myeloid leukemia, and lung cancer are supported by these models. As expected, estimates of germline effect on CHIP from UKB and GHS are strongly correlated (odds ratio = 1.94 [1.76–2.13], P = 3.2 x 10−42). B. CHIP and its most common subtypes are significantly associated with death from any cause across UKB. Hazard ratio (HR) estimates from cox-proportional hazard models are shown, with error bars that represent a 95% confidence interval. P-values are uncorrected and derive from two-sided Wald tests. Models are adjusted for sex, LDL, HDL, pack years, smoking status, BMI, essential primary hypertension, type 2 diabetes mellitus, and 10 European specific genetic PCs.
Extended Data Fig. 7
Extended Data Fig. 7. CVD Incidence in IL6R Mutation Carriers with and without CHIP.
A-B. Survival curves are drawn showing that IL6R p.Asp358Ala mutation carriers (green) are not an elevated risk of CVD incidence (y-axis) compared with non-carriers (blue) in either the first 50K individuals from UKB (A) or the full 450K cohort (B). C-D. In contrast, IL6R p.Asp358Ala mutation carriers are estimated to be at a reduced risk of CVD events (C) (HR = 0.60), but only in the first 50K samples from UKB (D). Models are adjusted for sex, LDL, HDL, pack years, smoking status, BMI, essential primary hypertension, type 2 diabetes mellitus, and 10 European specific genetic PCs. Hazard ratios (HR) were estimated using cox-proportional hazard modeling, with p-values uncorrected and derived from two-sided Wald tests.
Extended Data Fig. 8
Extended Data Fig. 8. Incident risk of myeloid cancer subtypes among CHIP carriers from the UKB.
A-C. Forest plots and tables featuring hazard ratio (HR) estimates from cox-proportional hazard models are shown, with error bars that represent a 95% confidence interval. CHIP and its most common subtypes are significantly associated with acute myeloid leukemia (AML) (A), Myelodysplastic Syndromes (MDS) (B), and myeloproliferative neoplasm (MPN) (C). Here, results are depicted from analyses in which we removed samples that had a diagnosis of malignant cancer prior to sequencing collection. Models are adjusted for sex, LDL, HDL, pack years, smoking status, BMI, essential primary hypertension, type 2 diabetes mellitus, and 10 European specific genetic PCs. Hazard ratios (HR) were estimated using cox-proportional hazard modeling, with p-values uncorrected and derived from two-sided Wald tests.
Extended Data Fig. 9
Extended Data Fig. 9. Incident risk of lung cancer among CHIP carriers from the UKB and GHS cohorts.
A-D. Forest plots and tables featuring hazard ratio (HR) estimates from cox-proportional hazard models are shown, with error bars that represent a 95% confidence interval. CHIP and its most common subtypes are significantly associated with lung cancer in both smokers and non-smokers across UKB (A-B) and GHS (C-D). Here, results are depicted from analyses in which we removed samples that had a diagnosis of malignant cancer prior to DNA collection. Models are adjusted for sex, LDL, HDL, pack years, smoking status, BMI, essential primary hypertension, type 2 diabetes mellitus, and 10 European specific genetic PCs. Hazard ratios (HR) were estimated using cox-proportional hazard modeling, with p-values uncorrected and derived from two-sided Wald tests.

Comment in

References

    1. Jaiswal S, et al. Age-related clonal hematopoiesis associated with adverse outcomes. New Engl. J. Med. 2014;371:2488–2498. doi: 10.1056/NEJMoa1408617. - DOI - PMC - PubMed
    1. Jaiswal S, et al. Clonal hematopoiesis and risk of atherosclerotic cardiovascular disease. New Engl. J. Med. 2017;377:111–121. doi: 10.1056/NEJMoa1701719. - DOI - PMC - PubMed
    1. Jaiswal S, Ebert BL. Clonal hematopoiesis in human aging and disease. Science. 2019;366:eaan4673. doi: 10.1126/science.aan4673. - DOI - PMC - PubMed
    1. Zekavat SM, et al. Hematopoietic mosaic chromosomal alterations increase the risk for diverse types of infection. Nat. Med. 2021;27:1012–1024. doi: 10.1038/s41591-021-01371-0. - DOI - PMC - PubMed
    1. Niroula A, et al. Distinction of lymphoid and myeloid clonal hematopoiesis. Nat. Med. 2021;27:1921–1927. doi: 10.1038/s41591-021-01521-4. - DOI - PMC - PubMed