. 2022 Dec;612(7940):495-502.
doi: 10.1038/s41586-022-05253-4. Epub 2022 Nov 30.

Genomic signature of Fanconi anaemia DNA repair pathway deficiency in cancer

Affiliations

Genomic signature of Fanconi anaemia DNA repair pathway deficiency in cancer

Andrew L H Webster et al. Nature. 2022 Dec.

Abstract

Fanconi anaemia (FA), a model syndrome of genome instability, is caused by a deficiency in DNA interstrand crosslink repair resulting in chromosome breakage1-3. The FA repair pathway protects against endogenous and exogenous carcinogenic aldehydes4-7. Individuals with FA are hundreds to thousands fold more likely to develop head and neck (HNSCC), oesophageal and anogenital squamous cell carcinomas8 (SCCs). Molecular studies of SCCs from individuals with FA (FA SCCs) are limited, and it is unclear how FA SCCs relate to sporadic HNSCCs primarily driven by tobacco and alcohol exposure or infection with human papillomavirus9 (HPV). Here, by sequencing genomes and exomes of FA SCCs, we demonstrate that the primary genomic signature of FA repair deficiency is the presence of high numbers of structural variants. Structural variants are enriched for small deletions, unbalanced translocations and fold-back inversions, and are often connected, thereby forming complex rearrangements. They arise in the context of TP53 loss, but not in the context of HPV infection, and lead to somatic copy-number alterations of HNSCC driver genes. We further show that FA pathway deficiency may lead to epithelial-to-mesenchymal transition and enhanced keratinocyte-intrinsic inflammatory signalling, which would contribute to the aggressive nature of FA SCCs. We propose that the genomic instability in sporadic HPV-negative HNSCC may arise as a result of the FA repair pathway being overwhelmed by DNA interstrand crosslink damage caused by alcohol and tobacco-derived aldehydes, making FA SCC a powerful model to study tumorigenesis resulting from DNA-crosslinking damage.


Conflict of interest statement

Competing interests: Rocket Pharmaceuticals provided research funding and partial salary support to A.S. for an unrelated project. P.J.C. is a founder, director and consultant for Mu Genomics Ltd. B.S. is a co-inventor of intellectual property related to DCN1 small molecule inhibitors licensed by MSK to Cinsanso. He has rights to receive royalty income as a result of this arrangement. MSK has financial interests related to this intellectual property and Cinsanso as a result of this arrangement. Other authors declare no competing interests.

Figures

Extended Data Fig. 1.
Extended Data Fig. 1.. Clinical characteristics of the FA SCC cohort and its mutational landscape.
a Age at diagnosis for the FA SCC (n=41), HPV+ (n=71) and HPV- (n=415) sporadic HNSCC cohorts, for which full clinical data was available. Clinical data for sporadic HNSCC cohorts were obtained from the TCGA database. b and c Characteristics of the 41 FA patients with complete clinical information available. Some individuals had multiple cancers. For these cases, survival was calculated from the first cancer sequenced in this study.* numbers are based on 41 individuals with complete history. ** based on the first sample sequenced if multiple tumors sequenced. d Type and tissue site of the sequenced tumors. * two were in pyriform sinus, one in oropharynx; ** cell lines are from the tongue, pharynx, and oral cavity. *** one of these samples is a metastasis to a lymph node of another tumor in this set. e TP53 variant allele frequency (%) spread for n=43 biologically independent FA SCCs with a TP53 SNV or indel mutation. Mutant allele frequency was corrected for individual tumor purity as calculated by Theta2. Median and IQR are indicated. f Oncoplot of the FA SCC cohort indicating the variant type by color and the gene effected is listed on the left. Recurrent focal CNAs were defined by GISTIC2. Amplifications were classified as log2(sCNA)≥0.9 and focal deletions as log2(sCNA)≤−0.9 after normalizing for tumor purity. Samples are stratified by SCC tissue subtype. One adenocarcinoma sample (cervical adenocarcinoma) is shown, while the bladder and intestinal adenocarcinomas are not displayed. The y-axis of the top graph indicates the number of total somatic gene alterations from the GISTIC2 and SNV/indel analysis. In all cases, n refers to independent biological samples or individuals.
Extended Data Fig. 2.
Extended Data Fig. 2.. Assesing the SNV burden and COSMIC SNV mutational signatures of FA SCC.
a Comparison of tumor mutation burden between TCGA cohorts and the FA SCC cohort (n=55 independent SCCs). Each dot represents the number of exonic SNV and indel mutations detected per sample, with median mutation burden indicated by a black horizonal line. FA SCC samples are colored red and TCGA-HNSCC samples are colored blue. b sigfit (Bayesian procedure) and Sigflow (bootstrapping procedure) extraction of COSMIC single-base substitution (SBS) signatures from n=13 HSCT-negative FA SCC whole-exome samples (each with >100 SNVs) and n=4 HSCT-negative FA SCC whole-genome samples (with SNV calls restricted to the exome). c sigfit and Sigflow extraction of SBS signatures from n=4 HSCT-negative FA SCC whole-genome samples, surveying genome-wide SNVs. d sigfit and Sigflow extraction of COSMIC indel (ID) signatures from n=4 HSCT-negative FA SCC whole-genome samples with matched normal controls. Mutation fraction indicates the fraction of tumor mutations that can be explained by the particular signature. Signature exposure (sig exposure) is the number of mutations that contributed to the particular signature. sigfit, error bars indicate the 95% highest posterior density (HPD) intervals. Grey bars indicate non-significant signature exposures, defined as exposures for which the lowest HPD limit is less than 0.01. Sigflow, boxplots indicate the median signature exposure value and interquartile range (IQR). Whisker ends are positioned at Q1 (first quartile) - 1.5xIQR, or at the minimum value when larger than this lower range value, and Q3 (third quartile) + 1.5xIQE, or at the maximum value when smaller than this upper range value. In all cases, n refers to independent biological samples.
Extended Data Fig. 3.
Extended Data Fig. 3.. Copy number instability in FA SCC.
a Plot displaying chromosomal locations of recurrent focal amplification peaks detected by GISTIC2 in all FA SCCs (n=60 samples, including 55 independent SCCs, 2 SCC metastases, and 3 SCC samples sequenced by both WGS/WES) and one cervical adenocarcinoma. GISTIC2 q-value is shown below, with default minimum calling threshold displayed as a green line. b A plot displaying chromosome location of recurrent focal deletion peaks detected by GISTIC2 in all FA SCCs (n=60). GISTIC2 q-value is shown below, with default minimum calling threshold displayed as a green line. c Copy-number alteration heatmap displaying detected sCNAs for all FA SCCs (n=60) and one FA-associated cervical adenocarcinoma, colored by amplitude intensity and normalized for individual tumor purity. Each row is a tumor sample. d Comparison of focal sCNA numbers between FA SCC, HPV+ sporadic HNSCC, HPV sporadic HNSCC, BRCA2mut carcinomas, and BRCA1mut carcinomas. For FA SCC, n=20 whole-genome & n=40 whole-exome samples are displayed and colored by sample type. For HPV+ sporadic HNSCC, n=18 whole-genome samples and n=71 genome-wide CNV array (CGH) are shown separately. For HPV sporadic HNSCC, n=24 whole-genome samples and n=415 CGH samples are displayed separately. For BRCA2mut carcinomas n=41 whole-genome samples are shown. For BRCA1mut carcinomas, n=24 whole-genome samples are displayed. Focal copy number alterations are defined by GISTIC2, and gated at log2(sCNA)≥0.9 or log2(sCNA)≤−0.9 after correcting for tumor purity. Two-tailed Mann-Whitney U test p-values are indicated, with median and IQR shown. e ASCAT plot of a WGS FA SCC (F17P1). Total copy number is represented by the purple line. Minor allele is represented by the blue line. Indicated are notable oncogenes and tumor suppressors localizing to focal sCNA regions. f Genomic Circos plot displaying all somatic SV events detected by Illumina WGS of sample F17P1 depicted in panel e. g ASCAT plots displaying allele-specific CNAs in select WES-sequenced FA SCC tumors with little to no detectable HSCT-donor SNP contamination. Upper left (F32P1), Upper right – (F16P1-Vulv), Bottom left (F4P1), Bottom right (F25P1). F32P1 is HPV+, but harbors somatic deletions of TP53 and CDKN2A. In all cases, n refers to independent biological samples.
Extended Data Fig. 4.
Extended Data Fig. 4.. SV breakpoint landscape and subclonal structure of FA SCC.
a Scatter plot displaying localization of 8,896 SV breakpoints (from 4,448 SVs) in FA SCC by chromosome and genomic position. Relative breakpoint density is indicated by height from the baseline. Annotated are curated oncogenes and tumor suppressors localizing to breakpoint hotspots. b Hatchet subclonal absolute copy-number prediction of a low-HSCT+ FA SCC (F44P1). A copy number of 2 is considered copy-neutral. Individual predicted subclones (n=3) are displayed as distinct colored lines. c Battenberg-(DPClust) decomposition of 4 HSCT-negative FA tumor whole-genome samples with matched normal controls. Each annotated peak is a detected clone within the SCC, with peak area indicating fractional composition of tumor cells.
Extended Data Fig. 5.
Extended Data Fig. 5.. SV breakpoint localization of FA SCC, sporadic HNSCC, BRCA2mut, and BRCA1mut tumors relative to genome replication timing and fragile sites.
a Replication timing of the SV breakpoint loci. Plotted in black is the expected replication timing distribution. Plotted in blue is the observed SV breakpoint localization to early, mid, or late replicating genomic regions. Vertical axis indicates relative abundance and horizontal axis indicates standard deviation from mean replication timing. Kolmogorov-Smirnov (KS) p-values are indicated. n corresponds to the number of breakpoints included in the sample for each analysis. b Binned SV breakpoint counts from the indicated cohorts and SV class, localizing to common and rare fragile sites. SV class highlighted in red indicates a significant association, as determined by indicated p-value of two-tailed z-score test compared to 1000 permutations of fragile site locations. c Binned SV breakpoint counts localizing to “early-replicating fragile sites”. SV class highlighted in red indicates a significant association, as determined by indicated p-value of two-tailed z-score test compared to 1000 permutations of fragile site locations.
Extended Data Fig. 6.
Extended Data Fig. 6.. Complex SVs in FA SCC and the transcriptional landscapes of FA SCC and sporadic HNSCC.
a Number of somatic SV chains detected in 10x-sequenced FA SCCs (n=4), where a chain is defined as ≥ 2 discrete SVs (≥ 4 unique breakpoints). Median and IQR are indicated. b Number of SVs present in 108 SV chains in 10x-sequenced FA SCCs. Mean (4.6 SVs) and IQR are indicated. c Number of SVs of indicated class present in 108 SV chains from 10x-sequenced FA SCCs. Means and IQRs are indicated. d SV breakpoint distribution from 108 SV chains stratified by human chromosome number. e Somatic SV burden of n=9 PacBio-sequenced FA SCCs. 3 samples (indicated) were sequenced to 10x average coverage, and 6 samples were sequenced to 30x average coverage. f Somatic SV class proportions in n=9 PacBio-sequenced FA SCCs. Medians and IQRs are indicated. g Illumina & PacBio % SV call overlap for SVs > 1kb and deletions < 1kb for n=9 FA SCCs sequenced on both platforms. Shown are % of PacBio SV calls > 1kb present in Illumina BRASS output, % of PacBio deletion calls <1kb present in Illumina indel calls, and % of Illumina SV calls >1kb present in PacBio BAMs. Median and IQR are indicated. h Comparison of deletion sizes (<1kb) detected by SV calling in n=9 PacBio FA SCCs and by indel calling in the same 9 FA SCCs sequenced by Illumina WGS. Median and IQR are shown. i Examples of fold-back inversions (FBI) driving sharp copy-number change at key oncogenic loci identified in FA SCCs (PacBio data). j Comparison of the raw number of unbalanced translocation events in FA SCC (n=20), HPV-negative sporadic HNSCC (n=23), BRCA2mut (n=41), and BRCA1mut (n=24) cohorts. Two-tailed Mann-Whitney U test p-values are indicated, with median and IQR shown. k Comparison of hg19 expected vs. observed percentage of somatic SV breakpoints in 9 PacBio-sequenced FA SCCs that localize to repeat regions. Unpaired two-tailed t-test p-value is indicated (t=7.371, df=8), with median and IQR shown. l Breakpoint density graph displaying GC% sequence composition within +/− 100bp from SV breakpoints identified in PacBio sequencing data, calculated relative to hg19 global GC% frequency (40.9%) (notated as “expected”). Median and IQR are displayed. m Comparison of hg19 expected vs. observed percentage of somatic SV breakpoints from FA SCCs (n=20) and HPV-negative sporadic HNSCC cohorts (n=23) that localize to repeat regions and to the indicated repeat class (Illumina WGS). Two-tailed Mann-Whitney U test p-values are indicated, with median and IQR shown. n Comparison of the number of retrotransposon element (RTE) insertions in FA SCC (n=20), HPV-negative sporadic HNSCC (n=23), BRCA2mut (n=41), and BRCA1mut (n=24) cohorts. Two-tailed Mann-Whitney U test p-values are indicated, with median and IQR shown. o Cancer-relevant genes differentially expressed between FA SCC (n=6) and sporadic HNSCC (n=520) as assessed by RNAseq, including genes displayed in Fig. 1c. Differential expression is gated at log2(FC)>1 or log2(FC)<−1 with DESeq2 FDR-adjusted p-value < 0.05. DESeq2 implementation of Wald test with FDR-adjusted p-value is indicated. Genes whose relative expression are impacted by a sCNA are colored orange. Genes whose relative expression is discordant with sCNA frequency are colored blue. Genes not identified in focal sCNA peaks are colored white. GAPDH and PGK1 are indicated in black and added as housekeeping controls. p Quality-control distribution graph showing log2(FC) values of all genome-wide transcripts comparing FA SCC (n=6) vs sporadic HNSCC (n=520). Median and IQR is displayed. q DNA repair genes differentially expressed in FA SCC (n=6) versus sporadic HNSCC (n=520) by RNAseq. Differential expression is gated at log2(FC)>1 or log2(FC)<−1 with DESeq2 FDR-adjusted p-value <0.05. DESeq2 implementation of Wald test with FDR-adjusted p-value is indicated. r Aldehyde dehydrogenase (Aldh) and alcohol dehydrogenase (Adh) genes differentially expressed between FA SCC (n=6) and sporadic HNSCC (n=520). Differential expression is gated at log2(FC)>1 or log2(FC)<−1 with DESeq2 FDR-adjusted p-value <0.05. DESeq2 implementation of Wald test with FDR-adjusted p-value is indicated. s Gene-set enrichment/depletion (GO) analysis of genes differentially expressed between FA SCC and sporadic HNSCC. Genes entered into analysis were gated at log2(FC)>1 or log2(FC)<−1 with DESeq2 FDR-adjusted p value < 10−5. Gene sets were gated at >2-fold enrichment over expected background with GO Fisher’s exact test FDR-adjusted p-value <0.01 to be reported in the figure. In all cases, n refers to independent biological.
Extended Data Fig. 7.
Extended Data Fig. 7.. Copy-number instability in sporadic HNSCC coupled to FA pathway deficiency.
a Oncoplot of 415 HPV-negative sporadic HNSCCs, displaying somatic copy-number alteration (sCNA) or SNV/indel-alteration of FA pathway genes or ALDH2. Mutation type is indicated in the legend. Top bar graph indicates the relative copy-number instability of each sample. Blue indicates deletions, magenta indicates amplifications. GISTIC2 q-value (FDR) values: XRCC2 (1×10⁻²²), MAD2L2 (1×10⁻⁷), RAD51 (1×10⁻¹), ALDH2 (2×10⁻¹). b Mutational frequency of key HNSCC driver genes in HPV-negative sporadic HNSCC samples with MAD2L2, ALDH2, RAD51, or XRCC2 deletions (n=52) versus entire HPV-negative TCGA-HNSCC cohort (n=415). GISTIC q-value (FDR) values: CDKN2A (4×10264), PTPRD (7×1040), KMT2C (1×10²²), PIK3CA (5×1057), NSD1 (1×10⁴), CSMD1 (9×10101), LATS2 (2×10²³), MXD4 (5×10⁴), CCND1 (8×10252), FAT1 (9×1036), SDHB (7×10⁷), NOTCH2 (8×10¹⁹), MYC (6×10²²), NOTCH1 (2×10³), DIP2C (3×10²), NCOR2(2×101), TGIF(4×10⁶), PTEN (4×10¹¹), EGFR (1×1052). c Number of focal copy-number alterations in sporadic HNSCC tumors (n=321 samples with data on smoking history), stratified by number of cigarette pack-years associated with each sample. Shown are cases with zero pack years (no recorded smoking), cases with more than one (>1) pack-years, and cases with more than two (>2), more than three (>3), more than four (>4) and more than eight (>8) pack years. Two-tailed Mann-Whitney U test p-values are indicated, with median and IQR shown. d HPV-negative sporadic HNSCC samples (n=415) ranked by number of focal somatic copy-number alteration (sCNA) peaks as defined by GISTIC2. Annotated are the top and bottom sCNA quartiles, with the top quartile being most unstable and the bottom quartile being most stable. Median and IQR displayed. e Comparison of the number of cigarette pack-years for smokers in top (n=104) and bottom (n=104) copy-number quartiles. Two-tailed Mann-Whitney U test p-value is indicated, with median and IQR shown. f Bar chart indicating the proportion (%) of samples within top and bottom sCNA quartiles exhibiting each respective COSMIC signature ID3, ID8, SBS4, or DBS2. Annotated are fold-differences in these proportions. g Comparison of the total number of ID3, ID8, SBS4, and DBS2 signature events between top (n=104) and bottom (n=104) sCNA quartiles. Indicated in brackets is the proportion (%) of total SBS, DBS, or ID events represented by the respective signature in each sCNA quartile. In all cases, n refers to independent biological samples.
Extended Data Fig. 8.
Extended Data Fig. 8.. Characterization of a murine FA SCC model.
a In vitro cell growth curve of pre-engraftment Fanca+/+ and Fanca−/− keratinocytes, measured by cell count over six days with three independent experimental replicates per genotype. Data points indicate the mean cell count and bars indicate standard deviation. b Mean replicate tumor volumes measured at multiple time points during the 2nd, 6th, and 11th engraftment cycles of Fanca+/+ and Fanca−/− keratinocytes. Each genotype has 4 independent replicates, each of which in turn is comprised of 4 co-engrafted tumor sites on a single mouse (for a total of 16 tumors per genotype). Each data point represents one replicate as the mean volume of its 4 constituent tumors at the specified time point, with standard error bars indicated. 100×103, 70×103, and 35×103 cells were engrafted at 2nd, 6th, and 11th engraftment respectively. 1st engraftment data is shown in Fig. 4c. Fanca−/− was reduced to 3 replicates at the 6th and 11th cycles due to recurrent loss through host death. c Number of tumor SVs categorized by class: inversion (INV), deletion (DEL), tandem duplications (TD), translocation (TRA) in n=4 Fanca+/+ and n=3 Fanca−/− replicates from 6th engraftment cycle. Two-tailed unpaired t-test p-values displayed (inversions: t=2.934, df=5), with medians and IQRs indicated. d Proportion (%) of SVs represented by each class in n=4 Fanca+/+ and n=3 Fanca−/−replicates at 6th engraftment cycle. Two-tailed unpaired t-test p-values displayed (inversions: t=2.666, df=5), with medians and IQRs indicated. e Unsupervised-clustering heatmap displaying differential transcriptomic gene-set enrichment across all replicates at pre-engraftment and 1st, 2nd, 6th, & 11th engraftment cycles for Fanca+/+ and Fanca−/− genotypes (32 samples). Relative gene set enrichment or depletion is indicated by color scale at each time point (ANOVA test). Gene sets displayed have a FDR-adjusted p-value < 10−7. Pre indicates pre-engraftment, E indicates engraftment, R indicates replicate. f RNAseq differential expression heatmap across all replicates displaying time-course expression changes in genes associated with keratinocyte identity, EMT transition, and inflammation/immune cell activation. Heatmap color indicates -scaled log2-normalized expression (32 samples). Pre indicates pre-engraftment, E indicates engraftment, R indicates replicate. In all cases, n refers to independent biological samples.
Extended Data Fig. 9.
Extended Data Fig. 9.. Single cell transcriptomics of case F44P1 and integration with other single-nuclei FA SCC samples.
a Feature plots superimposed on a UMAP embedding displaying cell type identity markers corresponding to the annotated clusters in Fig. 4g. Macrophage (CD163), CD4+ T-cells (CD4), CD8+ T cells (CD8A), KRT14/5+ tumor keratinocytes (KRT14), neutrophils (HCAR2), fibroblasts (COL11A1), mast cells (TPSAB1), Langerhans dendritic cells (CD207), p-EMT tumor keratinocytes (LAMA3), myofibroblasts (ACTA2), differentiated tumor keratinocytes (SPRR2E), endothelial cells (VWF). See methods for additional markers used for identification. b ASCAT plot of WGS sample F44P1 (top), inferred single-cell copy-number analysis displaying distinct amplifications in tumor keratinocyte, p-EMT tumor keratinocyte, and differentiated tumor keratinocyte clusters (bottom) c Feature plot displaying the scTSK sensor score for case F44P1. d Feature plots displaying a selection of scTSK markers. e Feature plot displaying p-EMT sensor score for case F44P1. f Feature plots displaying a selection of p-EMT markers. g Fold-enrichment in gene expression between p-EMT vs non-EMT tumor keratinocytes in F44P1 (DESeq2 log2(x) > 0.2, Wald test with FDR-adjusted p-value < 0.05) shown by GO term. GO enrichment Fisher’s exact test FDR-adjusted p-value displayed. h UMAP embedding displays the integrated clustering of F44P1 (single-cell), F46P1 (single-nuclei), and F38P1 (single-nuclei) samples after quality control (k=1,986 cells). Cell type identities are indicated in the legend. i scTSK and p-EMT sensor scores of integrated samples, split by constituent tumor sample. Also see Supplementary Fig. 1 for examples of cellular markers used in h and i.
Extended Data Fig. 10.
Extended Data Fig. 10.. Spatial transcriptomics of FA SCC and fibroblast-tumor keratinocyte interactions.
a left to right: H&E-stained scan of sample F38P1 showing a scale bar, spatial feature plots of CCND1, EGFR, SNAI2, LAMC2, TGFBI expression and imputed G1/G2-M/S cell-cycle stage. b GSEA EMT hallmark enrichment plot, assessed using a pre-ranked gene list determined from differential expression analysis between the p-EMT tumor cluster 6 against the remaining tumor clusters. EMT hallmark enrichment and normalized enrichment scores were 0.64722323 and 2.0873358, respectively, with the nominal p-value = 0 and the adjusted FDR value = 0. c ASCAT plot of the F38P1 WGS sample (top). Inferred single-spot copy-number analysis displaying distinct amplifications in tumor versus normal tissue (bottom). d Location of tumor keratinocytes and adjacent non-tumor stroma (top) used for spatial neighborhood analysis. Differential expression between tumor keratinocyte spots and directly adjacent stromal spots (bottom). e Ligand-receptor interaction analysis between tumor-associated fibroblasts and p-EMT tumor keratinocytes vs. non-EMT tumor keratinocytes in F44P1 single-cell sample.
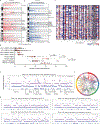
Fig. 1
Fig. 1. Comparison of the mutational landscapes of Fanconi anemia (FA) squamous cell carcinomas (SCCs) and sporadic head and neck SCCs (HNSCCs).
a Cancer-specific survival curves for n=41 individuals with FA SCC and complete clinical history, n=69 HPV-positive sporadic HNSCC cases, and n=394 HPV-negative sporadic HNSCC cases from TCGA with disease-specific survival data. The p-value was determined by a Mantel-Cox log-rank test. b Number of paired-end reads aligning without clipping to non-repetitive regions of any HPV genome in FA SCCs (n=20 WGS and n=40 WES) and sporadic HNSCCs from TCGA (n=42 WGS and n=513 WES). c Comparison of gene alteration frequencies between independent FA SCCs (n=55) and HPV-negative sporadic HNSCCs (n=415), with focal somatic copy number alteration (sCNA) peaks defined by GISTIC2 [read-depth change of log2(sCNA)≥0.9 (amplification) or log2(sCNA)≤−0.9 (deletion) relative to binned region coverage in pool of normals] and with normalization for tumor purity in both cohorts. SNV is single nucleotide variation. TP53 and PDL1 sCNA frequencies were determined manually for FA SCC. * and # indicate genes contained within the same focal sCNA peak. GISTIC2 FDR q-values for the FA SCC cohort are listed for each applicable gene affected by a copy-number alteration. ** indicates a selection of genes not captured by GISTIC2, with sCNA-frequencies being extracted from cBioPortal – Pan-Cancer Atlas (HPV-Negative HNSCC). In all cases, n refers to independent biological samples or individuals.
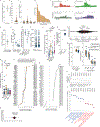
Fig. 2
Fig. 2. The structural variant landscape of FA SCC.
a Comparison of somatic structural variant (SV) numbers in the whole genomes of FA-associated cancers (20 SCCs and 2 adenocarcinomas), HPV-positive sporadic HNSCC, HPV-negative sporadic HNSCC, BRCA2-deficient (BRCA2mut), or BRCA1-deficient (BRCA1mut) tumors. b SV counts in FA SCCs (n=20) and HPV-negative sporadic HNSCCs (n=23) cohorts categorized by SV class: deletion (DEL), translocation (TRA), inversion (INV), and tandem duplication (TDs). INV include reciprocal inversions, fold-back inversions and complex intrachromosomal rearrangements with inverted orientation. c The proportion of all SVs attributed to each SV class in samples shown in panel b. d SV class size distribution in the indicated tumor samples. Size (in base pairs; bp) is defined by intrachromosomal distance between the left and right SV breakpoints. x indicates the median size. e Replication timing and common fragile site localization of SV breakpoints, stratified by both SV class and tumor cohort. Color scale indicates correlation strength. Detailed data is shown in Extended Data Fig. 5. f Mechanism of breakpoint resolution in FA SCC (n=20) and HPV-negative sporadic HNSCC (n=23) cohorts, categorized by the double-strand DNA break repair pathways: non-homologous end joining (NHEJ), microhomology-mediated end joining (MMEJ), and single strand annealing (SSA). Indicated is the proportion (%) of BRASS re-assembled breakpoints predicted to have been repaired by each pathway, based on previously established homology parameters. Two-tailed Mann-Whitney U test p-values are indicated, with median and IQR shown (a-d). In all cases, n refers to independent biological samples or individuals.
Fig. 3
Fig. 3. Complex FA SCC SVs identified by 10x linked-read, PacBio long read, and Illumina WGS.
a Circos plot of somatic structural variants (SVs) larger than 30kb detected using 10x linked-read WGS in FA SCC (sample F17P1). 8 selected multi-SV chains are highlighted using distinct colors, with the outer ring segmented by chromosome number. A chain is defined as a minimum of 4 barcode-linked breakpoints (≥ 2 SVs). b Illustration of SV chain #1 from panel a. Color legend is shared with panel c. Arrows indicate orientation of each segment relative to the hg19 reference genome. c Illustration of a somatic SV chain containing unbalanced translocations, fold-back inversions, and templated insertion chains present in FA SCC sample F45P1. d Deduced amplification mechanism at select oncogenes in FA SCC as assessed by PacBio sequencing. e Proportion of translocations events that are unbalanced (non-reciprocal and copy-number altering) among FA SCCs (n=20), HPV-negative sporadic HNSCCs (n=19), BRCA2mut carcinomas (n=40), and BRCA1mut carcinomas (n=24). 5 sporadic HNSCC samples and 1 BRCA2mut sample with ≤3 translocation events were excluded. f Number of fold-back inversion events in the same cohorts. FA SCCs (n=20), HPV-negative sporadic HNSCCs (n=23), BRCA2mut carcinomas (n=40), and BRCA1mut carcinomas (n=24). g % of the samples in each cohort with 0, 1, 2, 3, or more than 3 unique FBI-TIC chains. h Comparison of expected (hg19 reference) vs. observed percentage of somatic SV breakpoints localizing to indicated repeat class. Breakpoints from n=9 FA SCC PacBio samples are shown. Two-tailed Mann-Whitney U test p-values are indicated, with median and IQR shown (e-f). Unpaired two-tailed Student’s t-test p-values are indicated, with median and IQR shown (SINE: t=5.627, df=8, Tandem: t=4.786, df=8) (h). In all cases, n refers to independent biological samples or individuals.
Fig. 4
Fig. 4. Characterization of a murine FA SCC model, single-cell and spatial transcriptomics of human FA SCCs.
a Schematic of the serial engraftment of murine keratinocytes. b Representative micrographs of H&E-stained tumors derived from Fanca+/+ and Fanca−/− keratinocytes at the first engraftment cycle. c Tumor volumes during first engraftment of Fanca+/+ and Fanca−/− keratinocytes. Each point represents the mean volume of four tumors from one mouse with the standard error shown. Four replicates, each comprising four tumors intradermally engrafted within a single mouse, are indicated by separate curves. d Somatic SV counts in n=3 Fanca−/− and n=4 Fanca+/+ tumors at the 6th engraftment cycle. Bars indicate median-IQ range. Two-tailed, unpaired t-test p-value (t=2.574, df=5) is shown. e and f Protein levels of epithelial and mesenchymal (e) and inflammatory (f) markers measured by western blotting of different engraftments. g UMAP embedding of single-cell transcriptomics data of FA SCC sample F44P1 (k=634 cells). h Spatial transcriptomic clusters identified in FA SCC sample F38P1(left) and UMAP embedding of spot clusters with annotated identity (right), i KRT14 expression, spatially-mapped scTSK and p-EMT sensor score in F38P1 Visium sample. j The FA pathway prevents SV formation by repairing DNA interstrand crosslinks created by endogenous and exogenous aldehydes. k The constitutive FA repair deficiency leads to copy number alterations of oncogenes and tumor suppressors driving SCC development. Innate inflammatory keratinocyte response and the EMT in FA SCC may contribute to their aggressive nature. We propose that the functional overload of a genetically unaltered FA pathway by exogenous aldehydes in tobacco and alcohol leads to sporadic HNSCCs. It remains to be determined whether and how DNA damage contributes to EMT and more aggressive behavior in sporadic HNSCCs. In all cases, n refers to independent biological samples. Extended discussion is in the Supplementary data.

References

    1. Auerbach AD & Wolman SR Susceptibility of Fanconi’s anaemia fibroblasts to chromosome damage by carcinogens. Nature 261, 494–496, doi:10.1038/261494a0 (1976). - DOI - PubMed
    1. Sasaki MS & Tonomura A A high susceptibility of Fanconi’s anemia to chromosome breakage by DNA cross-linking agents. Cancer Res 33, 1829–1836 (1973). - PubMed
    1. Taylor AMR et al. Chromosome instability syndromes. Nat Rev Dis Primers 5, 64, doi:10.1038/s41572-019-0113-0 (2019). - DOI - PMC - PubMed
    1. Garaycoechea JI et al. Alcohol and endogenous aldehydes damage chromosomes and mutate stem cells. Nature 553, 171–177, doi:10.1038/nature25154 (2018). - DOI - PMC - PubMed
    1. Langevin F, Crossan GP, Rosado IV, Arends MJ & Patel KJ Fancd2 counteracts the toxic effects of naturally produced aldehydes in mice. Nature 475, 53–58, doi:nature10192 [pii] 10.1038/nature10192 (2011). - DOI - PubMed

Methods References

    1. Auerbach AD & Schroeder TM First announcement of the Fanconi anemia International Registry. Blood 60, 1054 (1982). - PubMed
    1. Nowak JA & Fuchs E Isolation and culture of epithelial stem cells. Methods Mol Biol 482, 215–232, doi:10.1007/978-1-59745-060-7_14 (2009). - DOI - PMC - PubMed
    1. Schober M & Fuchs E Tumor-initiating stem cells of squamous cell carcinomas and their control by TGF-beta and integrin/focal adhesion kinase (FAK) signaling. Proc Natl Acad Sci U S A 108, 10544–10549, doi:10.1073/pnas.1107807108 (2011). - DOI - PMC - PubMed
    1. Wellcome-Sanger. Cancer Genome Project – Cancer IT Pipeline. Github; (https://github.com/cancerit/).
    1. Li H Aligning sequence reads, clone sequences and assembly contigs with BWA-MEM. bioRxiv, doi:arXiv:1303.3997v2 (2013).

Publication types

MeSH terms