. 2022 Dec;612(7940):555-563.
doi: 10.1038/s41586-022-05475-6. Epub 2022 Nov 30.

Ras drives malignancy through stem cell crosstalk with the microenvironment

Affiliations

Ras drives malignancy through stem cell crosstalk with the microenvironment

Shaopeng Yuan et al. Nature. 2022 Dec.

Abstract

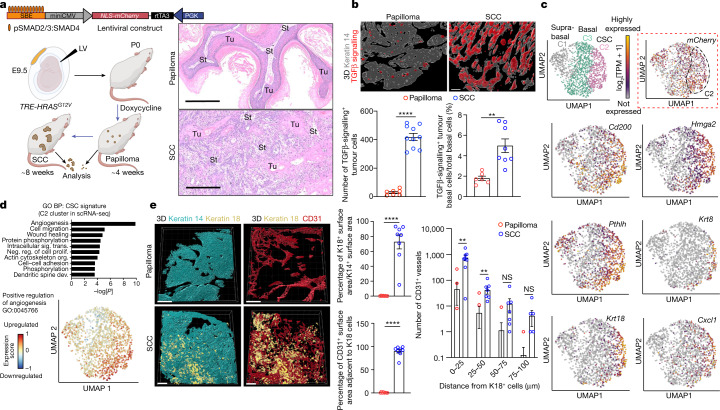
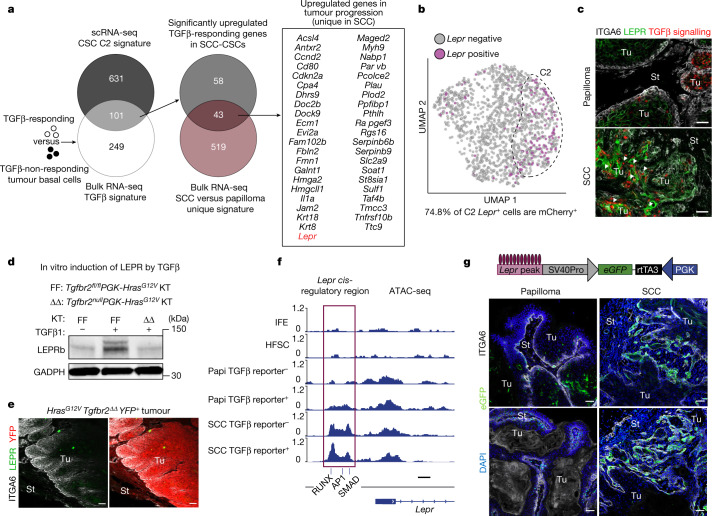
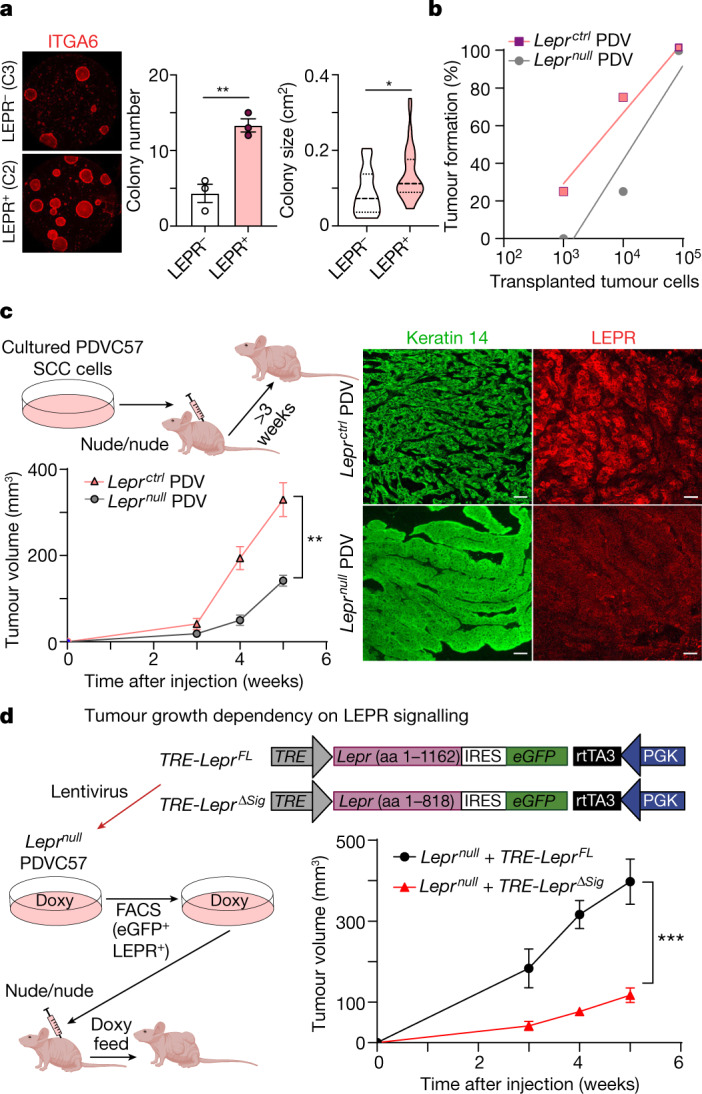
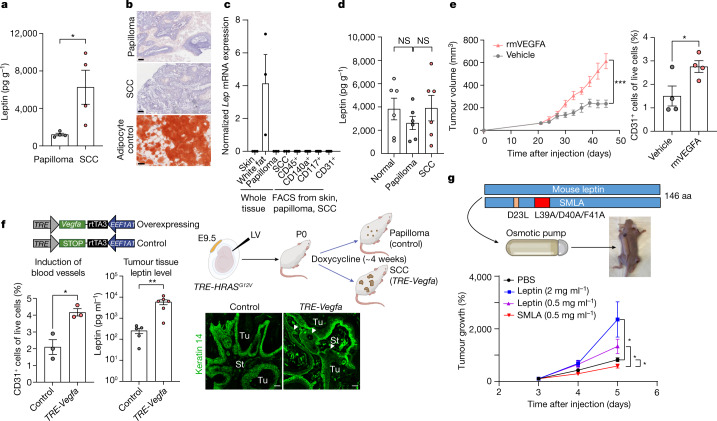
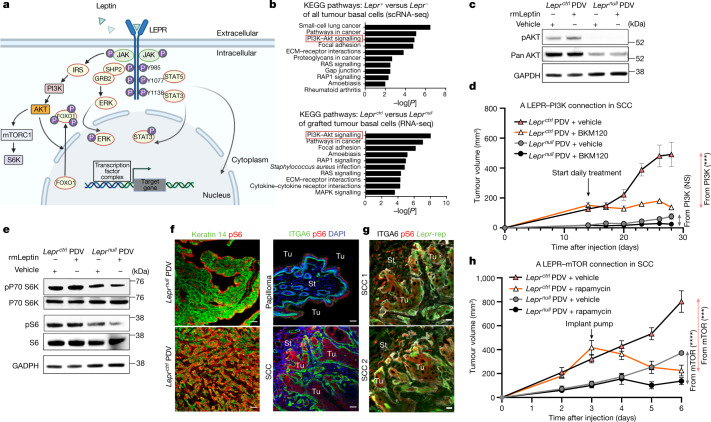
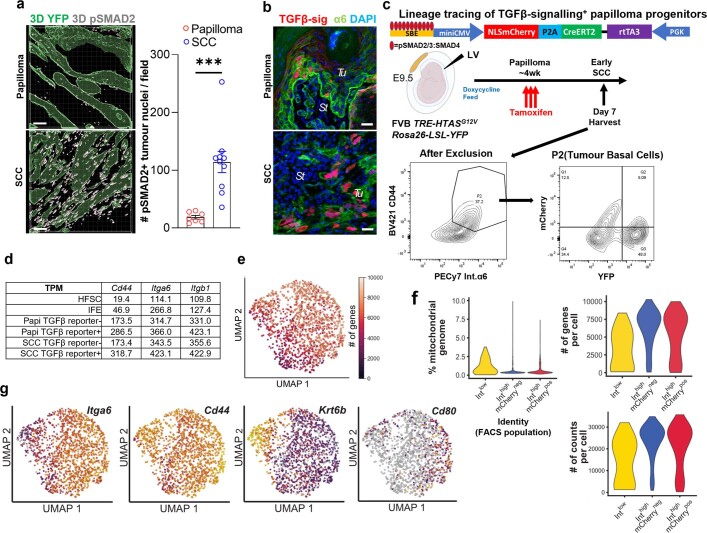
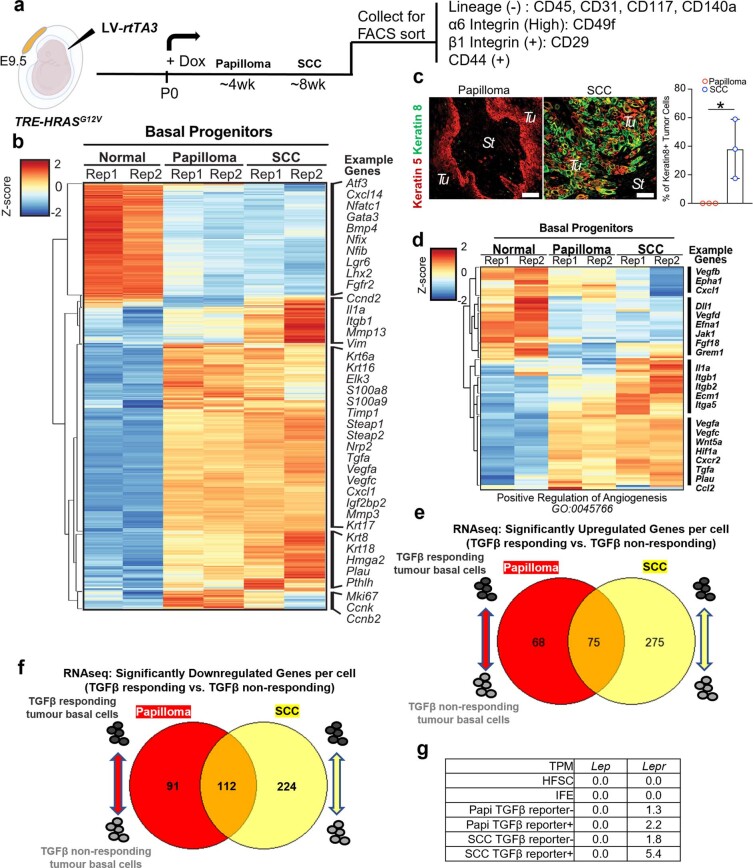
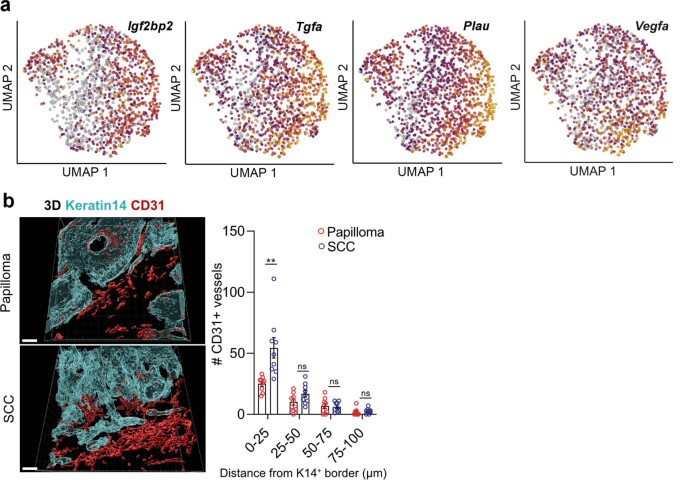
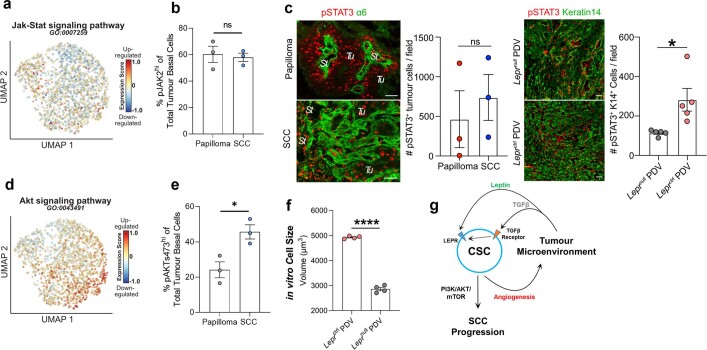
Squamous cell carcinomas are triggered by marked elevation of RAS-MAPK signalling and progression from benign papilloma to invasive malignancy1-4. At tumour-stromal interfaces, a subset of tumour-initiating progenitors, the cancer stem cells, obtain increased resistance to chemotherapy and immunotherapy along this pathway5,6. The distribution and changes in cancer stem cells during progression from a benign state to invasive squamous cell carcinoma remain unclear. Here we show in mice that, after oncogenic RAS activation, cancer stem cells rewire their gene expression program and trigger self-propelling, aberrant signalling crosstalk with their tissue microenvironment that drives their malignant progression. The non-genetic, dynamic cascade of intercellular exchanges involves downstream pathways that are often mutated in advanced metastatic squamous cell carcinomas with high mutational burden7. Coupling our clonal skin HRASG12V mouse model with single-cell transcriptomics, chromatin landscaping, lentiviral reporters and lineage tracing, we show that aberrant crosstalk between cancer stem cells and their microenvironment triggers angiogenesis and TGFβ signalling, creating conditions that are conducive for hijacking leptin and leptin receptor signalling, which in turn launches downstream phosphoinositide 3-kinase (PI3K)-AKT-mTOR signalling during the benign-to-malignant transition. By functionally examining each step in this pathway, we reveal how dynamic temporal crosstalk with the microenvironment orchestrated by the stem cells profoundly fuels this path to malignancy. These insights suggest broad implications for cancer therapeutics.


Conflict of interest statement

E.F. has served on the scientific advisory boards of L’Oreal and Arsenal Biosciences. The other authors declare no competing interests.

Figures

Fig. 1
Fig. 1. Benign-to-invasive rewiring of the tumour-initiating CSC transcriptome fuels angiogenesis.
a, The tumour model. Lentivirus containing a TGFβ mCherry reporter and transactivator rtTA3 was injected at a low titre in utero into the amniotic sacs of E9.5 TRE-HRASG12V mouse embryos to sparsely transduce individual skin progenitors. Postnatally, doxycycline activates rtTA3 and induces HRASG12V in these stem cells. Haematoxylin and eosin (H&E) staining reveals temporally distinct pathologies of benign and malignant SCCs. Tu, tumour; St, stroma. Scale bars, 300 µm. b, Quantification of a collapsed z-stack of 3D whole-mount immunofluorescence images and FACS-purified mCherry+ITGA6high basal progenitors reveals increased TGFβ signalling as tumours progress to invasive SCCs (Extended Data Fig. 1b). Bottom left: n = 7 (papilloma) and n = 10 (SCC); bottom right: n = 6 (papilloma) and n = 8 (SCC) tumours per stage. P< 0.0001 (left) and P = 0.0018 (right). Scale bars, 50 µm. c, UMAP representations and unsupervised k-nearest-neighbour-based clustering of single-cell transcriptomes performed on pooled FACS-isolated integrinlow (spiked, 159 total suprabasal) and integrinhigh (bulk, 1,346 total basal) cells from invasive SCC tumours. Clusters C2 and C3, basal progenitors; C1, suprabasal cells. Note that mCherry (TGFβ reporter, dotted box) is enriched in, but not exclusive to, C2 (35.8% of all basal cell progenitors). C2 is enriched for markers of SCC-CSCs with tumour-initiating and invasive properties. The UMAP plots show the relative expression levels (log2[TPM + 1]) of these genes across single cells. See also Extended Data Fig. 1g. d, Angiogenesis is the top GO biological process (BP) term of C2 CSC transcripts (UMAP displays clustering). P values were calculated using DAVID bioinformatic analysis. See also Extended Data Fig. 3. Dev., development; neg. reg., negative regulation; org., organization; prolif., proliferation; sig. trans., signal transduction. e, 3D collapsed whole-mount immunofluorescence images of the invasive fronts of tissue sections. Keratin 18 (K18) identifies CSCs; CD31 identifies vasculature. Scale bars, 150 µm. Quantifications are of keratin 18+ cell abundance, proximity to vessels and distances with vessels. n = 8 (top middle), n = 8 (bottom middle) and n = 8 (right) tumours per condition per stage. P < 0.0001 (top and bottom middle); and P0–25 = 0.0020, P25–50 = 0.0176, P50–75 = 0.1337, P75–100 = 0.1358. For b and e, statistical analysis was performed using unpaired two-tailed Student’s t-tests; NS, P ≥ 0.05; *P ≤ 0.05, **P ≤ 0.01, ***P ≤ 0.001, ****P ≤ 0.0001. Data are mean ± s.e.m. (b and e). See also Supplementary Tables 1–3. The diagram in a was created using BioRender. Source data
Fig. 2
Fig. 2. Leptin receptor is a TGFβ-regulated gene induced in tumour-initiating CSCs and localized to invasive SCC fronts.
a, Venn diagram showing that 101 genes constitute a refined CSC signature shared by single-cell C2 and TGFβ-responsive transcriptomes in SCC basal progenitors (Extended Data Fig. 2). Of the 101 genes, the 43 listed overlap and are upregulated in the papilloma-to-SCC transition. b, Lepr-expressing cells reside within the C2 basal SCC population and overlap around 75% with TGFβ-reporter+ cells. c, Immunofluorescence analysis of primary mouse skin SCC confirms that LEPR is rarely expressed in papillomas but is enriched in TGFβ-reporter+ SCC cells (arrowheads). Scale bars, 50 µm. d, LEPR immunoblot analysis. Cultured HrasG12V keratinocytes (KT) that are wild type (FF) but not mutant (ΔΔ) for the TGFβ receptor gene (Tgfbr2) elevate LEPR substantially in response to active recombinant TGFβ1. GAPDH was used as the loading control. Gel source data are provided in Supplementary Fig. 1a. e, Immunofluorescence analysis of tumour tissue from FR-LSL-HrasG12V;Tgfbr2fl/fl;R26-LSL-YFP mice transduced at a low titre with PGK-creERT2 lentivirus, and treated with tamoxifen to induce YFP(pseudoRed)+ HrasG12VTgfbr2ΔΔ tumorigenesis. The loss of TGFβ signalling results in non-invasive tumours that do not express LEPR. Scale bars, 50 µm. f, ATAC-seq was performed on FACS-purified ITGA6highITGB1high basal populations of interfollicular epidermis (IFE, SCA1+), bulge hair follicle stem cells (HFSCs, CD34+) and tumour cells (CD44high) either positive or negative for TGFβ responsiveness (mCherry). ATAC peaks associated with the Lepr locus opened during tumorigenesis, with the encased cluster 6 peak (containing RUNX, AP1 and SMAD motifs) opening predominantly during SCC progression. Scale bar, 500 bp. Papi, papilloma. See also Extended Data Figs. 4 and 5. g, Schematic of the in vivo Lepr ATAC-peak eGFP reporter assay. Reporter activity is greatly enriched at the benign-to-invasive SCC transition. Scale bars, 50 µm. See also Supplementary Tables 4 and 5.
Fig. 3
Fig. 3. Leptin receptor promotes superior tumour-initiating ability and is an essential regulator of SCC progression.
a, Stem cell colony assay. When placed in culture, FACS-isolated, LEPR-expressing basal SCC progenitors exhibit higher colony-forming efficiency (n = 3, P = 0.0069) and form larger colonies (n = 13 (LEPR), n = 39 (LEPR+), P = 0.0106) compared with non-expressing counterparts. Dish diameter, 10 cm. b, Limiting dilution assay. Leprnull PDVC57 (PDV) SCC cells were generated by CRISPR–Cas9 gene editing (Extended Data Fig. 6b). Serial orthotopic transplantation assays reveal that Leprctrl SCC cells possess higher tumour-initiating ability compared with Leprnull SCC cells. n = 4 (105 and 104 cells) and n = 8 (103 cells). c, Leptin receptor deficiency impairs SCC progression. Allografted PDV SCC cells were injected intradermally into immunocompromised Nude mice. Leprnull PDV tumours display reduced growth compared with their control counterparts (n = 4, P = 0.0039 for the end timepoint). Immunofluorescence shows papilloma-like morphology in Leprnull PDV tumours and SCC morphology in Leprctrl PDV tumours. Scale bars, 50 µm. d, LEPR signalling functions in SCC progression. Lentiviruses containing doxycycline (doxy)-inducible versions of either full-length (FL) Lepr or LeprΔsig were transduced into Leprnull PDV SCC cells expressing rtTA3 (required for doxycycline-induced activation of the TRE) (Extended Data Fig. 6d). Leprnull PDV tumour growth is robust only when full-length Lepr but not LeprΔsig is reintroduced into tumour cells (n = 6, P = 0.0008 for the end timepoint), underscoring the need for active LEPR signalling, and not merely LEPR, in tumour growth. For a, c and d, statistical analysis was performed using unpaired two-tailed Student’s t-tests. For a, c and d, data are mean ± s.e.m. aa, amino acids. The diagrams in c and d were created using BioRender. Source data
Fig. 4
Fig. 4. Leptin levels increase in the malignant tumour microenvironment and are caused by elevated angiogenesis.
a, ELISAs. Leptin in tumour tissue lysates is elevated as papillomas progress to SCC. n = 4 tumours per stage. P = 0.0322. b, Oil red O staining shows no overt signs of mature adipocytes (red) within the stroma surrounding SCCs versus papillomas. Scale bars, 250 µm. c, Quantitative PCR reveals no significant Lep transcriptional differences in the tumour microenvironments of SCCs versus papillomas. The positive control is Lep mRNA from white adipose tissue beneath the normal trunk skin. n = 3 (each whole tissue condition), n = 5–9 (each FACS-isolated population). d, The levels of blood plasma leptin in normal, papilloma and SCC-bearing mice are appreciable, but do not significantly differ. n = 6 for each condition. e, Tumour growth and angiogenesis are enhanced by intradermal recombinant mouse VEGFA (rmVEGFA), injected every 3 days into PDV SCC tumours and assayed beginning at day 21 after grafting. VEGFA increases the CD31+ tumour vasculature, as judged by flow cytometry. n = 8 (left) and n = 4 (right) tumours per condition. P = 0.0002 for the end timepoint (left); P = 0.0440 (right). The vehicle control was PBS without mouse VEGFA. f, Elevated expression of SCC stem cell C2 signature gene Vegfa is sufficient to enhance local angiogenesis and elevate leptin levels in the tumour microenvironment. TRE-HRASG12V mice were transduced in utero with low-titre lentivirus containing EEF1A1-rtTA3 with TRE-Vegfa or TRE-STOP (schematic). The quantification shows that, after 4 weeks of doxycycline induction, CD31+ vasculature (n = 3 tumours per stage, P = 0.0133) and tissue leptin levels (n = 5, control tissues, n = 6, TRE-Vegfa tissues; P = 0.0093) are increased in tumours with CSCs that express elevated Vegfa. On the basis of the immunofluorescence analysis, VEGFA over-expressing tumours advance to invasive (arrowhead) SCCs when the controls are still papillomas. Scale bars, 50 µm. g, SCC tumour growth is sensitive to plasma leptin levels. Recombinant leptin or mutant SMLA leptin agonist (doses indicated) was delivered to the circulation by an osmotic pump and the effects on PDV SCC tumour growth were monitored for 5 weeks. n = 12 (PBS control), n = 8, (each LEP or SMLA condition). From top to bottom, P = 0.0121, P = 0.0194, P = 0.0392. Statistical analysis was performed using unpaired two-tailed Student’s t-tests (a and dg). Data are mean ± s.e.m. (a and cg). aa, amino acids.The diagrams in f and g were created using BioRender. Source data
Fig. 5
Fig. 5. Leptin receptor signalling promotes SCC progression through the PI3K–AKT and mTOR pathways.
a, Schematic illustrating the complexities of leptin receptor signalling. b, The top ten KEGG pathways of genes significantly upregulated in progenitors of Lepr-expressing HRAS(G12V) SCCs (data from Fig. 1) (top) and Leprctrl versus Leprnull PDV tumours (bottom). P values were calculated using DAVID bioinformatic analysis. c, Immunoblots of protein lysates from Leprnull and Leprctrl SCC cells treated with recombinant leptin or vehicle control for 48 h before analysis. Note the leptin-dependent activation of pAKT exclusively in LEPR+ cells, along with higher AKT levels (Extended Data Fig. 8e). Gel source data are provided in Supplementary Fig. 1b. d, Immunocompromised mice with Leprctrl and Leprnull PDV tumours on opposite sides of their backs were administered the PI3K inhibitor BKM120 or vehicle control daily through oral gavage beginning at 14 days after PDVC57 cell injections. As judged by this assay, most tumour growth attributable to PI3K signalling operates through LEPR. n = 6 for each condition. P = 0.0576 (Leprnull) and P = 0.0007 (Leprctrl) at the end timepoint. e, Immunoblotting reveals signs of mTORC1 pathway elevation (pS6 and pS6-kinase) after leptin–LEPR signalling in vitro. An identical GAPDH image from Fig. 5c is displayed here as a reference, as they are from the same experiment. Gel source data and experiment details are provided in Supplementary Fig. 1b. f, The importance of leptin–LEPR signalling in activating mTORC1 signalling is accentuated in vivo, where the background from other growth factors in enriched medium is eliminated. pS6 immunofluorescence reveals LEPR dependency on mTORC1 activity in PDV-engrafted tumours and particularly pronounced activity at the invading fronts of LEPR+ HRASG12V SCCs. Scale bars, 50 µm. g, pS6 immunofluorescence (mTORC1 activity) and Lepr eGFP reporter (rep) activity co-localize in cells at invading HRASG12V SCC fronts. Scale bars, 20 µm. h, Immunocompromised mice with Leprctrl and Leprnull PDV tumours on opposite sides of their backs were continuously administered rapamycin or vehicle control at t = 3 weeks and then monitored for tumour progression. As judged by this assay, most tumour growth attributable to mTOR signalling operates through LEPR. n = 6 (each condition). P < 0.0001 (Leprnull) and P = 0.0002 (Leprctrl) at the end timepoint. For d and h, statistical analysis was performed using unpaired two-tailed Student’s t-tests. Data are mean ± s.e.m. (d and h). The diagram in a was created using BioRender. Source data
Extended Data Fig. 1
Extended Data Fig. 1. Benign papillomas and invasive SCCs exhibit distinct molecular signatures for angiogenesis and TGFβ responsiveness.
a, Collapsed z-stack rendering of 3D whole mount immunofluorescence for nuclear pSMAD2. Scale bars, 50 µm. (n = 8 tumours per stage, p = 0.0007). b, Immunofluorescence of sagittal tumour sections for TGFβ reporter (mCherry) signalling, α6 integrin to demarcate the tumour-stromal border and DAPI (nuclei). Note elevated mCherry at invasive fronts of the SCC (see Fig. 1b for quantifications). c, Lineage tracing of TGFβ-signalling tumour cells marked at the papilloma stage, traced to the SCC and analysed by FACS shows that TGFβ-responding papilloma cells contribute significantly to SCC tumour progression. d, Transcript levels of Itga6, Itgb1 and Cd44 are increased from normal skin to papilloma and SCC. e, UMAP of the number of genes per cell. f, Violin plots showing that the quality of samples (with FACS labelled cell identities) in the scRNAseq was high as judged by the number of counts per cell, the number of genes per cell, and the low percentage of the mitochondrial genome captured. g, UMAPs of control genes for basal SCC cells (Itga6, Cd44), suprabasal tumour cells (Krt6b) and SCC-CSCs (Cd80) (see Fig. 1c for additional details). All statistics were using unpaired two-tailed Student’s t-test: ns, p ≥ 0.05); *, p ≤ 0.05); **, p ≤ 0.01; ***, p ≤ 0.001; ****, p ≤ 0.0001. Data are presented as mean ± s.e.m. The diagram in c was created using BioRender. Source data
Extended Data Fig. 2
Extended Data Fig. 2. FACS-isolation and transcriptomic analysis of basal progenitors from normal skin, benign papilloma and SCC.
a, Experimental design for the tumour model as in Fig. 1a, used to purify basal progenitors from papillomas and SCCs. Basal cells (n = 2 mice per condition) are isolated by FACS using tumour basal cell markers (ITGA6, ITGB1, and CD44) with non-epithelial cell types (CD31, endothelial cells; CD45 pan-immune cells; CD117, melanocytes; CD140a, mesenchymal cells) excluded. b, Heatmap representation of bulk RNAseq of FACS-isolated basal progenitors from normal skin epithelia, papilloma, and SCC (in replicate) show significant molecular changes and stage-specific signatures during tumour progression. c, Immunofluorescence images show that keratin 8 positive tumour cells, as a proxy for the C2 SCC cancer-stem cell signature, are rare in the papilloma stage and much enriched in the invasive SCC stage. (n = 3 tumours per stage, p = 0.0334). Tu, tumour; St, stroma. Scale bars,50 µm. d, Heat map of the angiogenesis GO-Term. Note: RNAseq in Extended Data Fig. 2b and d, Rep1 SCC displayed mixed SCC-papilloma features. e, For high throughput RNA sequencing, two independent replicates of four FACS isolated populations were used. Venn diagram shows the differential expression of genes (DEG) analysis of RNAseq data from TGFβ responding tumour basal cells over their non-responding neighbours and compared between papilloma and SCC. DEG analysis yielded 68 TGFβ responding upregulated genes unique to the papilloma stage, 275 TGFβ responding upregulated genes unique to the SCC stage, and 75 upregulated genes shared by both stages. f, DEG analysis yielded 91 TGFβ responding downregulated genes unique to the papilloma stage, 224 TGFβ responding downregulated genes unique to the SCC stage, and 112 downregulated genes shared by both stages. g, Transcript levels of Lep are below the limits of detection in papillomas and SCCs. And Lepr are also not expressed in normal skin SCs. All statistics were using unpaired two-tailed Student’s t-test: ns, p ≥ 0.05; *, p ≤ 0.05); **, p ≤ 0.01; ***, p ≤ 0.001; ****, p ≤ 0.0001. Data are presented as mean ± s.e.m. Source data
Extended Data Fig. 3
Extended Data Fig. 3. Increased angiogenesis during progression from papilloma to SCC.
a, UMAP of the examples of angiogenesis-associated mRNAs from scRNA analyses of SCCs that show enrichment in the C2 signature (see Fig. 1c for annotation of clusters). b, Collapsed z-stack rendering of clearing and whole-mount immunofluorescence of tissue sections (n > 8 tumours per stage). Keratin 14 labels the tumour epithelium; CD31 labels the vasculature. Quantifications are at right. Note that the blood vessel proximity is closer in invasive SCC than papilloma. Scale bars, 40 µm. (n = 8 tumours per condition per stage, p(0–25) = 0.0034, p(25–50) = 0.0801, p(50–75) = 0.7548, p(75–100) = 0.4734). All statistics were using unpaired two-tailed Student’s t test: ns, p ≥ 0.05); *, p ≤ 0.05); **, p ≤ 0.01; ***, p ≤ 0.001; ****, p ≤ 0.0001. Data are presented as mean ± s.e.m. Source data
Extended Data Fig. 4
Extended Data Fig. 4. LEPR expression in skin and SCCs from human and quality control for ATAC Sequencing.
a, LEPR immunofluorescence of human normal skin, head and neck SCC (HNSCC), and lung metastases from human SCC A431 epidermal cells following tail-vein injections in immunocompromised mice. Top row: LEPR labelling alone; bottom row: LEPR, Keratin 14 and DAPI. Scale bars,50 µm. b, Correlation plot between ATAC replicates of TGFβ-responding and non-responding SCC and papilloma. All replicates have a correlation coefficiency > 0.92 and p < 0.001 (denoted as ***). The test statistic is based on Pearson’s product moment correlation coefficient and follows a t distribution with n-2 degrees of freedom. c, ATAC peak distribution of all 6 samples according to gene features. All samples display comparable distributions. d, Distribution of tagmented fragments in all ATAC-seq samples. Nucleosome laddering is clear in all samples. All statistics were using unpaired two-tailed Student’s t-test: ns, p ≥ 0.05); *, p ≤ 0.05); **, p ≤ 0.01; ***, p ≤ 0.001; ****, p ≤ 0.0001. Data are presented as mean ± s.e.m.
Extended Data Fig. 5
Extended Data Fig. 5. Benign papilloma and invasive SCC display distinct epigenetic signatures.
a, ATAC sequencing is performed on FACS-purified α6hiβ1hi basal populations of interfollicular epidermis (IFE, Sca1+), bulge hair follicle stem cells (HFSCs, CD34+), and tumour cells (CD44hi) either positive or negative for TGFβ-responsiveness (mCherry). Peaks are clustered according to their openness in each population by k-mean clustering. b, Venn diagram showing marked divergence of ATAC peaks from TGFβ-responding tumour basal cells and their non-responding neighbours between papilloma and SCC stages (n = 2 for each condition, each stage). c, Motif enrichment analysis of the 7 ATAC peak clusters. d, Quantifications of the Lepr cis-regulatory region boxed in Fig. 2f. e, Immunofluorescence images reveal that transcription factors RUNX1 and FOS are not detected in normal homeostatic skin but are enriched progressively during tumorigenesis. Scale bars, 50 µm. See also pSMAD2 immunofluorescence quantifications in Extended Data Fig. 1a. f, Lepr EGFP reporter and TGFβ mCherry reporter show minimal activity in papillomas but co-localize at the invasive fronts of SCC. Note numerous SCC cells marked by EGFP cytoplasm and mCherry nucleus. Integrin (white) denotes invasive fronts. For the original images, scale bars, 20 μm. For the magnified insets, scale bar, 10 μm. The percentages of reporter double-positive (DP) cells in these invasive regions are significantly higher in SCC than in papilloma. Majority of the TGFβ mCherry reporter+ cells are these DP cells in SCC compared to the ones in papilloma. (n = 4 for papilloma, n = 3 for SCC; top right: p = 0.0477; bottom right: p < 0.0001). All statistics were using unpaired two-tailed Student’s t -test: ns, p ≥ 0.05); *, p ≤ 0.05); **, p ≤ 0.01; ***, p ≤ 0.001; ****, p ≤ 0.0001. Data are presented as mean ± s.e.m. Source data
Extended Data Fig. 6
Extended Data Fig. 6. Lepr ATAC peak activity is sensitive to TGFβ and to Lepr knockout or overexpression.
a, Lepr cis-regulatory region reporter (see Fig. 2g and Extended Data Fig. 5f) was transduced into PDV SCC cells and tested for its sensitivity to TGFβ in vitro. Flow cytometry quantifications show that Lepr reporter-fluorescence is strongly accentuated in the presence of active recombinant TGFβ1 (n = 3, p = 0.0068). b, Leprnull PDVC57 SCC cells were generated by targeted CRISPR/CAS9 technology and validated by iSeq. Blue denotes sequence comparison region; green sgRNA; red, Lepr frameshift mutation in Clone 2. MiSeq analysis of Lepr targeted Clone 1 (which did not alter LEPR expression), and Clone 3 (which did reduce LEPR expression but not to the extent of Clone 2). Immunoblot (right) shows complete loss of LEPR protein in this clone, which was selected for further study. GAPDH is used as loading control. For gel source data, see Supplementary Fig. 2a. c, Quantifications showing reduced proliferation in Leprnull compared to LeprCtrl PDV tumours, as judged by EdU-labelling 2 h prior to harvesting. (n = 5 tumours per condition, p = 0.0024). d, Transduced cells are validated by pan-LEPR immunoblot analysis. Brackets denote expected sizes of full-length (FL) LEPR and Δsig LEPR, which lacks the LEPR-signalling domain. α-Tubulin is used as loading control. For gel source data, see Supplementary Fig. 2b. All statistics were using unpaired two-tailed Student’s t-test: ns, p ≥ 0.05); *, p ≤ 0.05); **, p ≤ 0.01; ***, p ≤ 0.001; ****, p ≤ 0.0001. Data are presented as mean ± s.e.m. Source data
Extended Data Fig. 7
Extended Data Fig. 7. Increased angiogenesis elevates local leptin levels and promotes Lepr-mediated tumour progression.
a, Fluorescently labelled leptin placed in the circulation can elevate local tissue levels of leptin in the skin and skin tumours. ELISA-like assays show that by delivery of 680RD labelled recombinant leptin through osmotic pump for 1W, fluorescence can be detected in skin and tumour tissue lysatesin a dose-depend manner. (n = 4 for each condition; Left: p = 0.0055; Right: p = 0.0199). b, Tumour growth and angiogenesis are enhanced by systemic recombinant mouse mVEGFA, delivered to the circulation by an osmotic pump distant from PDV SCC tumour sites, which are monitored for about 5W. CD31+ tumour vasculature is evaluated by flow cytometry (Left: n = 8 tumour per condition, p = 0.0004 for the end time point; Right: n = 4 per condition, p = 0.0461, paired due to the nature of angiogeneiss and relative location of pump). Vehicle control is PBS lacking mVEGFA. c, Osmotic pump delivery of recombinant protein to elevate circulating leptin levels does not appreciably induce angiogenesis in normal skin. Leptin was administered at two different doses and PBS was used as a control (n = 5 for each condition, p(PBS-Lep0.5) = 0.1133, p(Lep0.5-Lep2) = 0.0865, p(PBS-Lep2) = 0.0029). When taken with Fig. 4g, this finding indicates that elevated levels of plasma leptin on its own is sufficient to enhance tumour growth, independent of possible secondary consequences arising from enhanced angiogenesis that might otherwise bring other hormones or growth factors to the surrounding tumour tissue. d, Immunofluorescence of tissue sections for Lepr reporter and CD31. EGFP labels the CSCs; CD31 labels the vasculature. Quantifications are based on the average distance from the CD31+ vasculature to tumour basal cells with or without reporter signalling. (n = 8 regions per condition, p = 0.0049). All statistics were using unpaired (unless noted) two-tailed Student’s t-test: NS, p ≥ 0.05); *, p ≤ 0.05); **, p ≤ 0.01; ***, p ≤ 0.001; ****, p ≤ 0.0001. Data are presented as mean ± s.e.m. Scale bars, 50 µm. The diagram in b was created using BioRender. Source data
Extended Data Fig. 8
Extended Data Fig. 8. Akt but not Jak/Stat pathway signature is enriched in SCC CSCs.
a, The Jak-Stat pathway mRNA signature is not enriched in any of the three scRNAseq SCC clusters. b, Flow cytometry for pJAK2 reveals that JAK-signalling is activated in skin tumours, but is not significantly changed between papillomas and SCCs. (n = 3 for independent tumours per stage. p = 0.7565 with two-sided unpaired Student’s t-test.). c, pSTAT3 immunofluorescence shows that although not detected in homeostatic skin, STAT3 is activated similarly in both papilloma and SCC (left). pSTAT3 is reduced but not abolished in Leprnull compared to LeprCtrl PDV tumours (right), suggesting that LEPR’s main role in SCC tumour progression is not to activate STAT3. Scale bars, 50 µm. Quantifications accompany each analysis. (Left: n = 3 for tumours per stage, p = 0.5835; Right: n = 5 for tumours per condition, p = 0.0195. All are independent samples.). d, Lepr downstream signalling Akt pathway mRNA signature is enriched in C2 cluster of scRNAseq of SCC. e, Flow cytometry reveals that the percentage of pAKTs473 cells is higher in SCC than papilloma. (n = 3 for independent tumours per stage, p = 0.0237). f, Leprctrl PDV cells are significantly larger in size compared to Leprnull PDV cells (n = 4 for each condition, p < 0.0001). g, Schematic summarizing our findings. During tumour progression, dynamic crosstalk between HRASG12V oncogenic epithelial SCs and their tumour microenvironment promotes an increase in the production of angiogenesis factors by emerging SCC-CSCs, which in turn fuels angiogenesis, elevating the levels of circulating factors, such as leptin by increasing vasculature density. The perivasculature also raises local immune cells that elevate local TGFβ levels. Enhanced TGFβ-signalling in the CSCs not only promotes an EMT-like invasion, but also activates Lepr transcription. This triggers a leptin-LEPR signalling cascade, elevating PI3K-AKT-mTORC signalling and fuelling SCC progression. The genes in this cascade are often found mutated in cancers, but as shown here, can be driven by interactions between CSCs and their tumour microenvironment. See also Fig. 5a. All statistics were using unpaired two-tailed Student’s t-test: ns, p ≥ 0.05); *, p ≤ 0.05); **, p ≤ 0.01; ***, p ≤ 0.001; ****, p ≤ 0.0001. Data are presented as mean ± s.e.m. Source data

Comment in

References

    1. Dotto GP, Rustgi AK. Squamous cell cancers: a unified perspective on biology and genetics. Cancer Cell. 2016;29:622–637. doi: 10.1016/j.ccell.2016.04.004. - DOI - PMC - PubMed
    1. Harper JR, et al. Analysis of the rasH oncogene and its p21 product in chemically induced skin tumors and tumor-derived cell lines. Carcinogenesis. 1987;8:1821–1825. doi: 10.1093/carcin/8.12.1821. - DOI - PubMed
    1. Nassar D, Latil M, Boeckx B, Lambrechts D, Blanpain C. Genomic landscape of carcinogen-induced and genetically induced mouse skin squamous cell carcinoma. Nat. Med. 2015;21:946–954. doi: 10.1038/nm.3878. - DOI - PubMed
    1. Quintanilla M, Brown K, Ramsden M, Balmain A. Carcinogen-specific mutation and amplification of Ha-ras during mouse skin carcinogenesis. Nature. 1986;322:78–80. doi: 10.1038/322078a0. - DOI - PubMed
    1. Miao Y, et al. Adaptive immune resistance emerges from tumor-initiating stem cells. Cell. 2019;177:1172–1186. doi: 10.1016/j.cell.2019.03.025. - DOI - PMC - PubMed

Publication types

MeSH terms