. 2023 Jan;613(7945):696-703.
doi: 10.1038/s41586-022-05484-5. Epub 2022 Nov 30.

Social trauma engages lateral septum circuitry to occlude social reward

Affiliations

Social trauma engages lateral septum circuitry to occlude social reward

Long Li et al. Nature. 2023 Jan.

Abstract

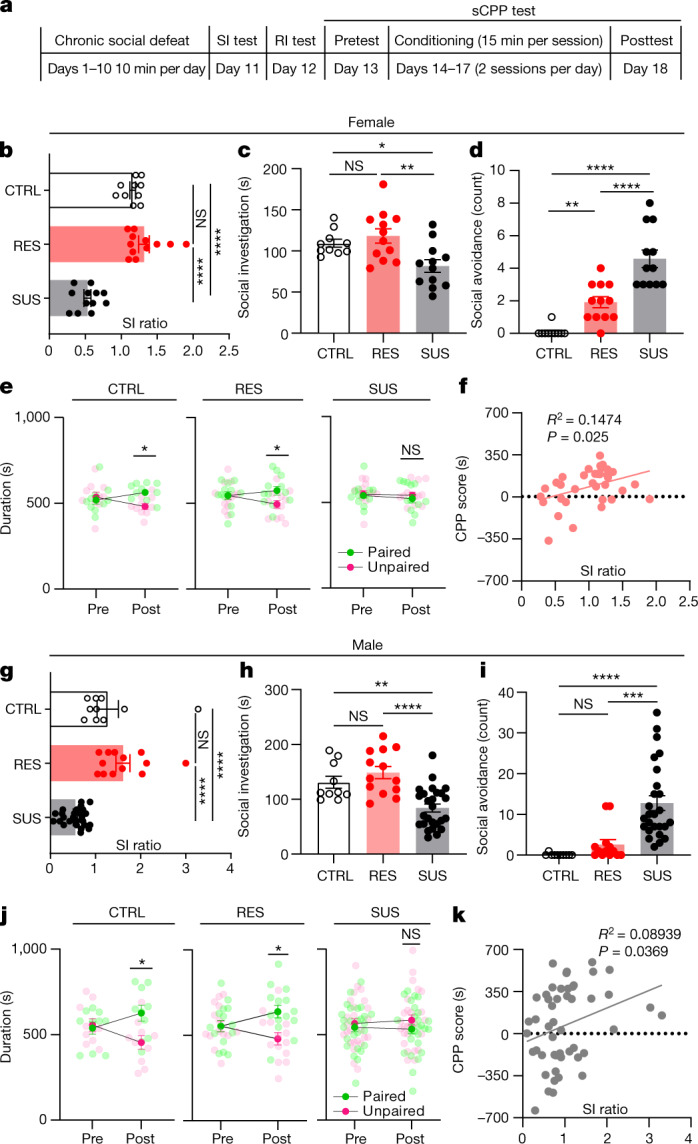
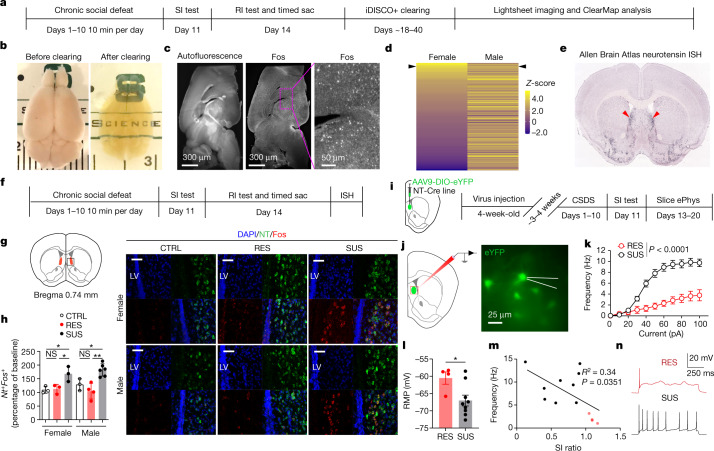
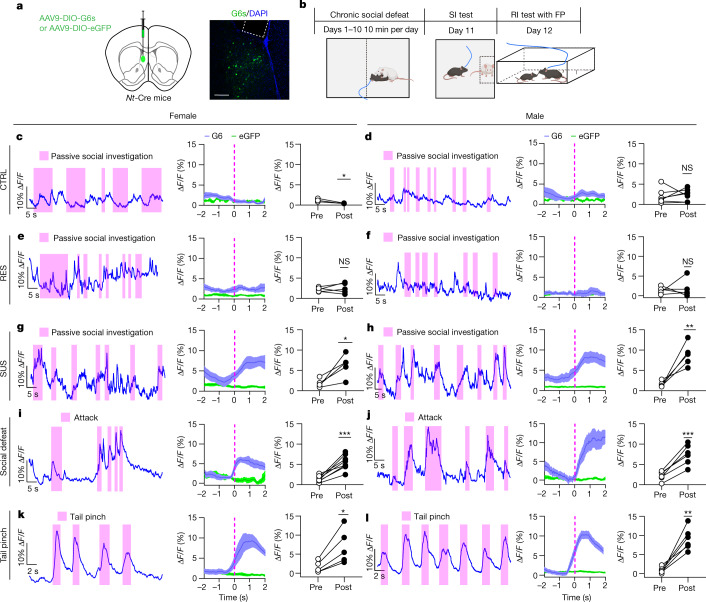
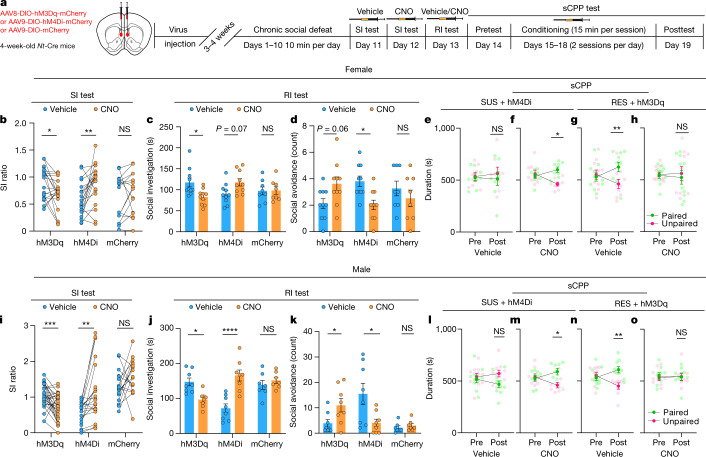
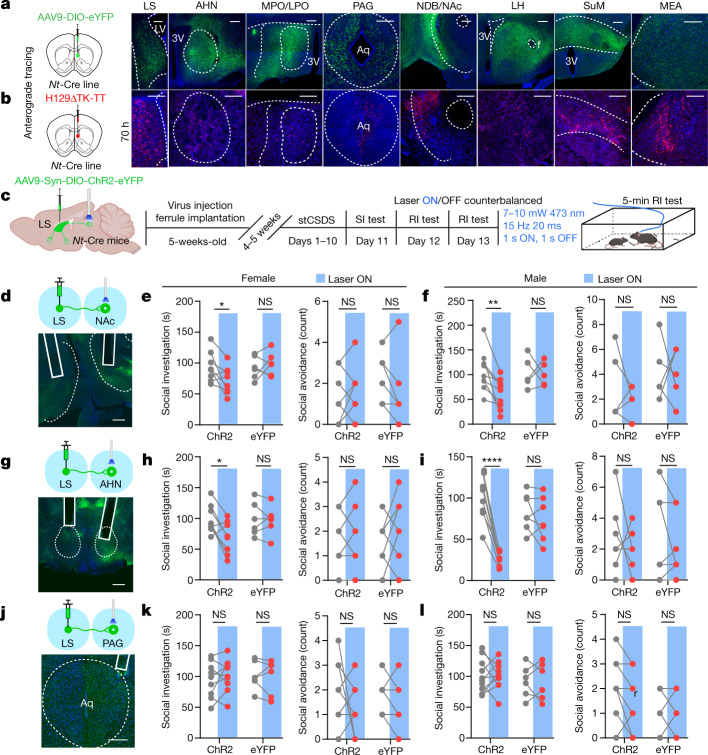
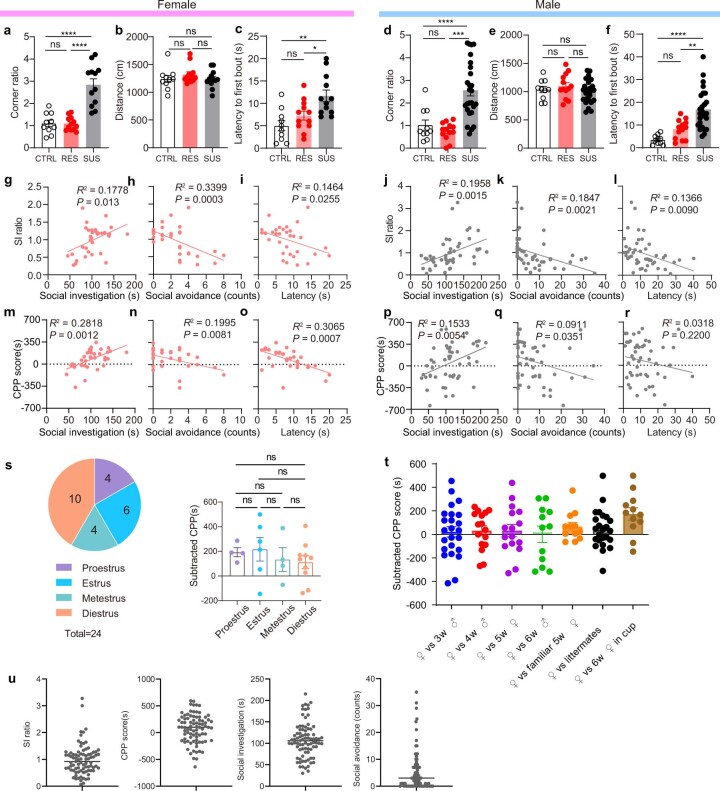
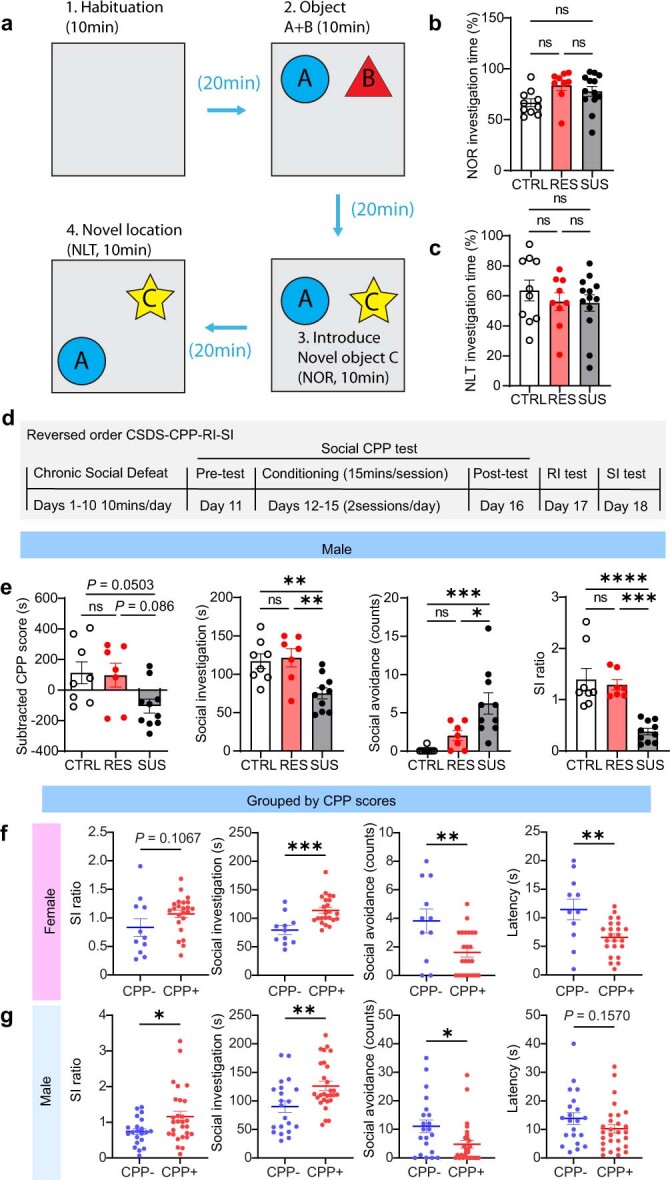
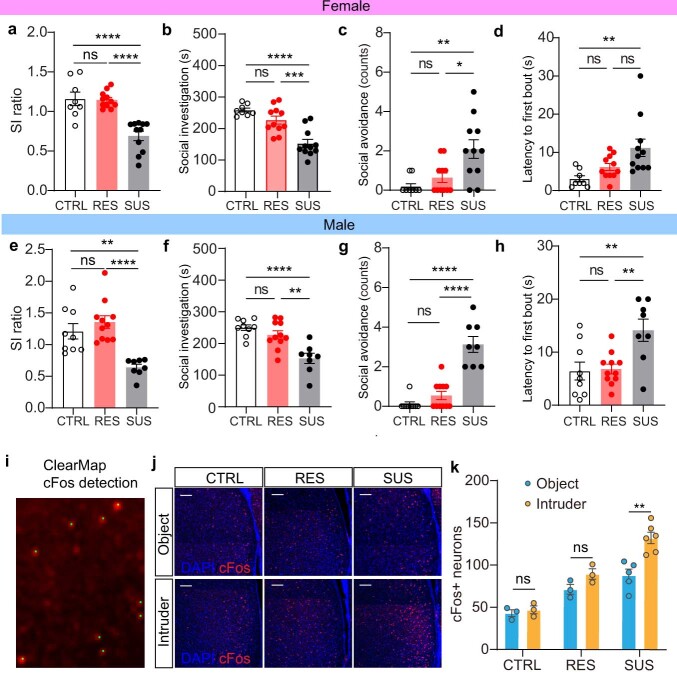
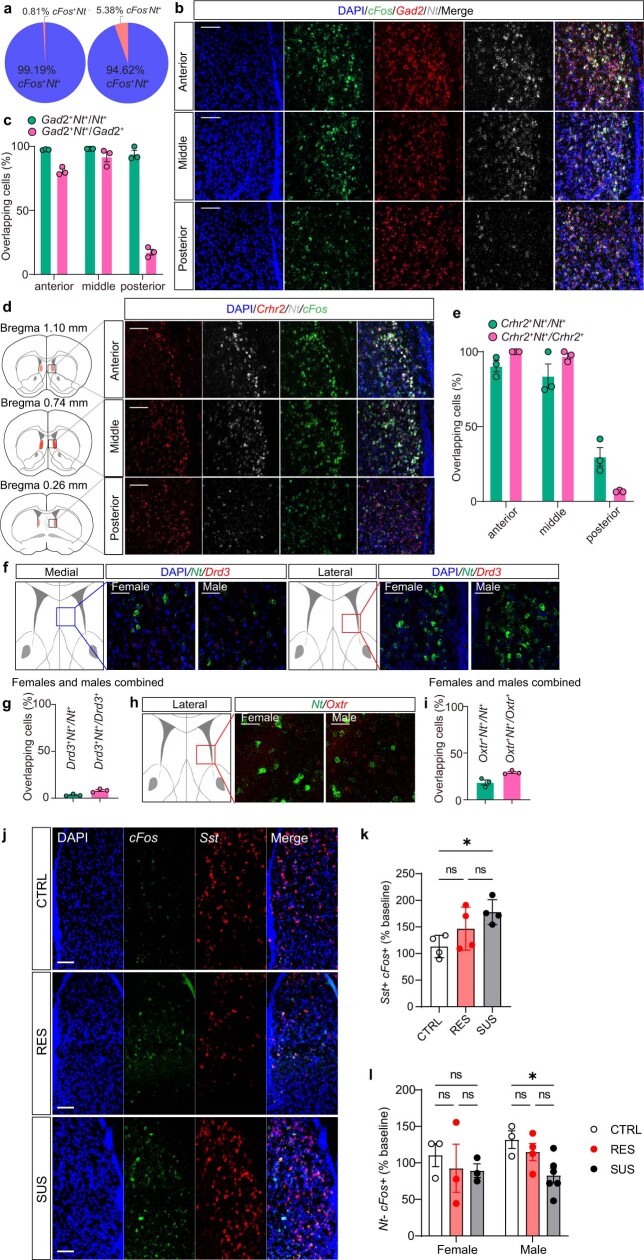
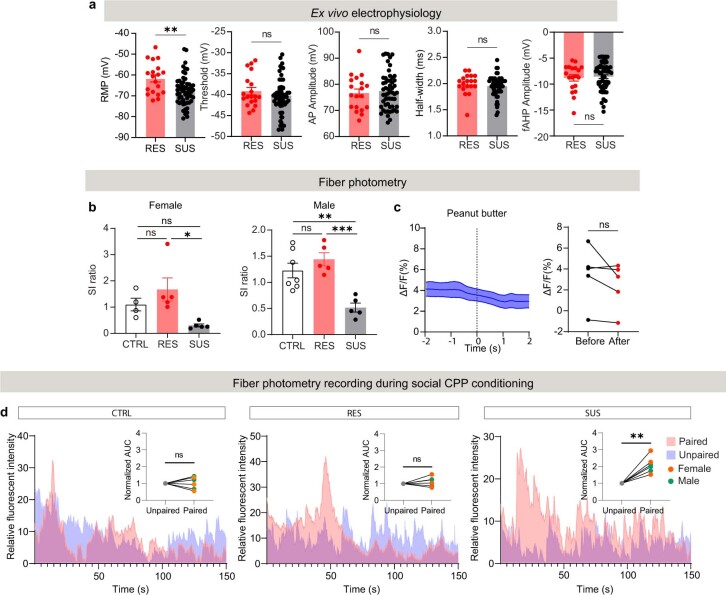
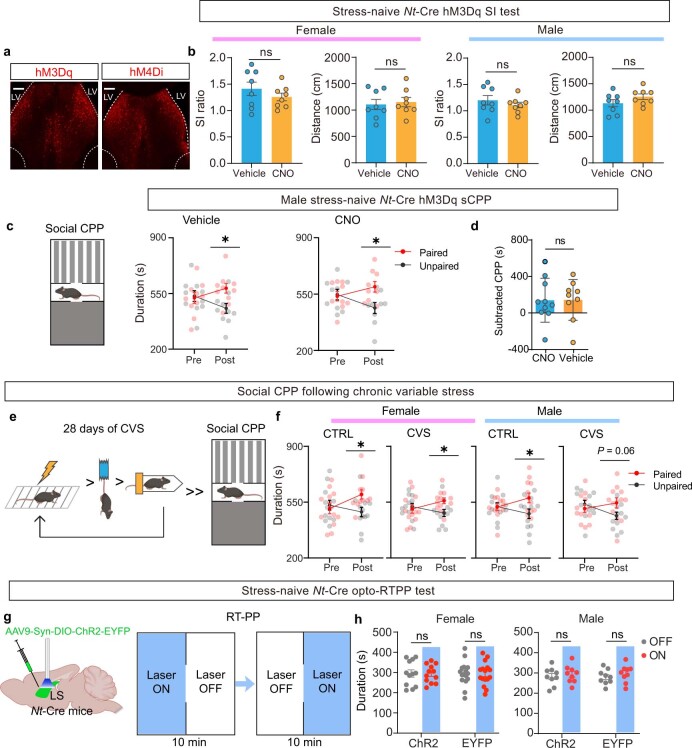
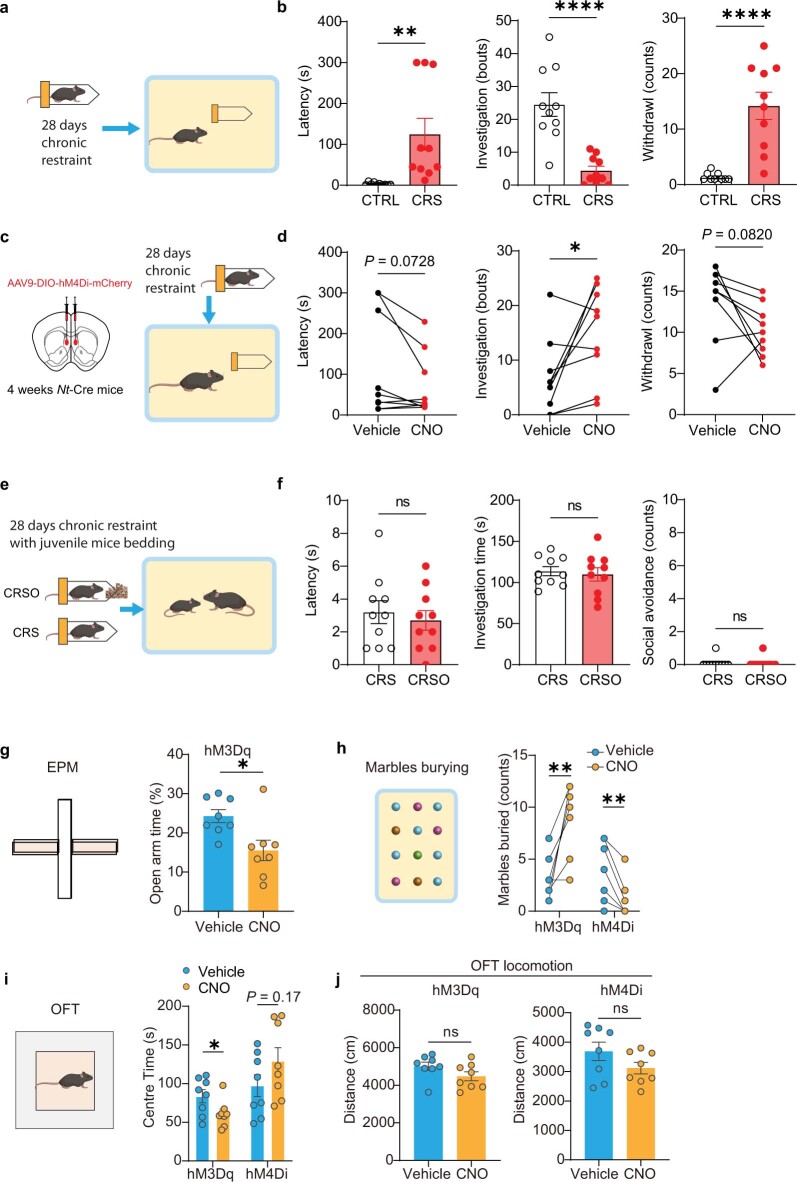
In humans, traumatic social experiences can contribute to psychiatric disorders1. It is suggested that social trauma impairs brain reward function such that social behaviour is no longer rewarding, leading to severe social avoidance2,3. In rodents, the chronic social defeat stress (CSDS) model has been used to understand the neurobiology underlying stress susceptibility versus resilience following social trauma, yet little is known regarding its impact on social reward4,5. Here we show that, following CSDS, a subset of male and female mice, termed susceptible (SUS), avoid social interaction with non-aggressive, same-sex juvenile C57BL/6J mice and do not develop context-dependent social reward following encounters with them. Non-social stressors have no effect on social reward in either sex. Next, using whole-brain Fos mapping, in vivo Ca2+ imaging and whole-cell recordings, we identified a population of stress/threat-responsive lateral septum neurotensin (NTLS) neurons that are activated by juvenile social interactions only in SUS mice, but not in resilient or unstressed control mice. Optogenetic or chemogenetic manipulation of NTLS neurons and their downstream connections modulates social interaction and social reward. Together, these data suggest that previously rewarding social targets are possibly perceived as social threats in SUS mice, resulting from hyperactive NTLS neurons that occlude social reward processing.


Conflict of interest statement

The authors declare no competing interests.

Figures

Fig. 1
Fig. 1. Susceptible mice show social reward impairment after CSDS in both males and females.
a, Experimental timeline for social behaviour tests following chronic social defeat. b,g, SI ratios of females (one-way analysis of variance (ANOVA) with Tukey’s multiple-comparisons test, F (2, 31) = 53.96, P < 0.0001, n = 10 (CTRL), 12 (RES), 12 (SUS) (b); and of males (one-way ANOVA, F (2, 46) = 24.36, P < 0.0001, n = 10 (CTRL), 13 (RES), 26 (SUS) (g). c,h, Social investigation time from RI test of females (one-way ANOVA, F (2, 31) = 6.755, P = 0.0037) (c); and of males (F (2, 46) = 14.82, P < 0.0001) (h). d,i, Social avoidance of females (F (2, 31) = 33.13, P < 0.0001) (d) and males (F (2, 46) = 15.37, P < 0.0001) (i). e, Time spent in paired and unpaired chambers during sCPP test (female CTRL (two-way repeated-measures ANOVA followed by Šídák’s multiple-comparisons test, F (1, 18) = 7.023, P = 0.0163, n = 10); RES mice (F (1, 22) = 4.598, P = 0.0433, n = 12); and SUS mice (F (1, 22) = 0.08155, P = 0.7779, n = 12)). f, Correlation between SI ratio and sCPP in females (R2 = 0.1474, P = 0.025). j, Time spent in paired and unpaired chambers during sCPP test (two-way repeated-measures ANOVA: male CTRL (F (1, 18) = 6.074, P = 0.0240, n = 10); RES mice (F (1, 26) = 7.499, P = 0.0110, n = 13); and SUS mice (F (1, 50) = 0.4818, P = 0.4908, n = 26)). k, Correlation between SI ratio and sCPP in males (R2 = 0.08939, P = 0.0369). NS, not significant. *P < 0.05, **P < 0.01, ***P < 0.001, ****P < 0.0001. All data expressed as mean ± s.e.m. Source data
Fig. 2
Fig. 2. NTLS neuronal activity is associated with altered social behaviours in susceptible mice.
a, Timeline of iDISCO+ Fos analysis from the RI test after CSDS. Timed sac, mice were perfused 90 min after RI test. b, Mouse brain before and after iDISCO+ clearing. c, Autofluorescence and Fos signal from lightsheet imaging. d, ClearMap analysis showing differentially activated brain regions from RES versus SUS mice. Arrowheads indicate LS. e, Neurotensin expression from Allen Brain Atlas ISH data. f, Timeline of ISH. g,h, Multiplex ISH (g) showing Fos expression (h) in NT neurons in females (one-way ANOVA, F (2, 6) = 7.887, P = 0.0209, n = 3 mice per group, three slices per mouse) and males (F (2, 10) = 13.13, P = 0.0016, n = 3 (CTRL), 4 (RES), 6 (SUS), three slices per mouse); scale bars, 50 μm. LV, lateral ventricle. i, Timeline of slice electrophysiology (ePhys) following CSDS. j, eYFP+ NTLS neurons patched in whole-cell configuration. k, Current–frequency curve showing counts of action potentials evoked by incremental steps of injected current. NTLS neurons from SUS mice (n = 55 neurons) compared with RES mice (two-way ANOVA, P < 0.0001, n = 19). l, Resting membrane potential (RMP) for SUS and RES mice (two-tailed Mann–Whitney test, P = 0.0336, n = 4 (RES), 9 (SUS). m, Correlation between SI ratio and firing rate evoked by a 100 pA step current (Pearson’s correlation, R2 = 0.34, P = 0.0351). Each dot represents the mean value per mouse for RES (red, n = 4) and SUS (black, n = 9) mice. n, Sample traces of excitability for RES (red) and SUS (black) mice following 100 pA current injection. *P < 0.05, **P < 0.01. All data expressed as mean ± s.e.m. Source data
Fig. 3
Fig. 3. In vivo NTLS activity in different social and stress contexts.
a, AAV-DIO-GCaMP6s injection and expression in LS. b, Timeline of FP experiments. ch, Left, representative Ca2+ trace of NTLS neurons during resident intruder test (pink strips indicate passive social investigation); middle, peri-event plot of NTLS neuron activity 2 s before and after intruder approach; right, statistics for neuron activity 2 s before and 2 s after social events in CTRL females (paired two-tailed t-test, t6 = 3.379, P = 0.0149, n = 7) (c) and males (t6 = 0.5081, P = 0.6295, n = 7) (d); in RES females (t4 = 0.6528, P = 0.5495, n = 5) (e) and males (t4 = 0.2939, P = 0.7834, n = 5) (f); and in SUS females (t4 = 3.772, P = 0.0196, n = 5) (g) and males (t4 = 4.844, P = 0.0084, n = 5) (h). il, Left, representative Ca2+ trace of NTLS neurons in CTRL mice during social defeat and tail pinches; middle, peri-event plot of NTLS neuron activity 2 s before and 2 s after attack/tail pinch; right, statistics of neuron activity 2 s before and 2 s after event in female defeat (t7 = 6.852, P = 0.0002, n = 8) (i), male defeat (t6 = 6.973, P = 0.0010, n = 7) (j), female tail pinch (t4 = 3.988, P = 0.0163, n = 5) (k) and male tail pinch (t5 = 6.137, P = 0.0017, n = 6) (l). All data were analysed using paired two-tailed t-test. *P < 0.05, **P < 0.01, ***P < 0.001. All data expressed as mean ± s.e.m. Scale bar, 100 μm. The illustrations in b were created with BioRender (https://biorender.com). Source data
Fig. 4
Fig. 4. Chemogenetic manipulations of NTLS neurons alter social behaviour following CSDS.
a, Experimental timeline for DREADD experiments. bd,ik, SI ratio, social investigation and social avoidance following chemogenetic activation (RES mice) or inhibition (SUS mice) of NTLS neurons during social test following CSDS (two-way repeated-measures ANOVA, female: F (2, 53) = 9.785, P = 0.0002, n = 18 (hM3Dq), 20 (hM4Di), 16 (mCherry) (b), F (2, 25) = 5.807, P = 0.0085 (c), F (2, 25) = 5.906, P = 0.0079, n = 9 (hM3Dq), 10 (hM4Di), 8 (mCherry) (d); male: F (2, 64) = 12.96, P < 0.0001, n = 30 (hM3Dq), 20 (hM4Di), 17 (mCherry) (i), F (2, 20) = 19.46, P < 0.0001 (j), F (2, 20) = 10.12, P = 0.0009, n = 8 (hM3Dq), 8 (hM4Di), 7 (mCherry) (k)). eh,lo, Social preference rescued by inhibition of NTLS neurons in female SUS mice (two-way repeated-measures ANOVA, CNO (e), F (1, 14) = 7.272, P = 0.0174, n = 8; vehicle (f), F (1, 14) = 0.3070, P = 0.5883, n = 8); and in male SUS mice (CNO (l), F (1, 14) = 4.710, P = 0.0477, n = 8; vehicle (m), F (1, 18) = 1.627, P = 0.2183, n = 10). Activation of NTLS populations in RES females (two-way repeated-measures ANOVA, CNO (g), F (1, 18) = 0.1653, P = 0.6891, n = 10; vehicle (h), F (1, 18) = 8.490, P = 0.0093, n = 10); and in RES males (CNO (n), F (1, 14) = 0.2221, P = 0.6447, n = 8; vehicle (o), F (1, 16) = 9.283, P = 0.0077, n = 9) blocked social CPP formation. *P < 0.05, **P < 0.01, ***P < 0.001, ****P < 0.0001. All data expressed as mean ± s.e.m. Source data
Fig. 5
Fig. 5. Optogenetic manipulation of NTLS downstream regions alters social behaviour in CSDS mice.
a, Anterograde AAV-DIO-eYFP tracing from NTLS neurons. b, Anterograde HSV-1 (H129ΔTK-TT) trans-synaptic tracing (70 h post injection) verifies monosynaptic connections between NTLS neurons and regions shown in a. c, AAV-DIO-ChR2 injection and timeline for resident intruder optogenetics experiments. dl, ChR2 axon terminal activation in NAc (d), AHN (g) and PAG (j) during RI test in females (NAc (e), social investigation, F (1, 12) = 4.836, P = 0.0482; social avoidance, F (1, 12) = 2.935, P = 0.1123, n = 8 (ChR2), 6 (eYFP); AHN (h), social investigation, F (1, 12) = 4.947, P = 0.0461, social avoidance, F (1, 12) = 0.8571, P = 0.3728, n = 8 (ChR2), 7 (eYFP)); PAG (k), social investigation, F (1, 13) = 0.6986, P = 0.4183; social avoidance, F (1, 13) = 0.07324, P = 0.7909, n = 8 (ChR2), 6 (eYFP); and in males (social investigation, NAc (f), F (1, 13) = 4.540, P = 0.0528; social avoidance, F (1, 13) = 0.2848, P = 0.6026, n = 9 (ChR2), 5 (eYFP); AHN (i), social investigation, F (1, 13) = 28.94, P = 0.0001, social avoidance, F (1, 13) = 0.06521, P = 0.8024, n = 8 (ChR2), 7 (eYFP); PAG (l), social investigation, F (1, 14) = 0.002038, P = 0.9646; social avoidance, F (1, 14) = 1.750, P = 0.2071, n = 9 (ChR2), 6 (eYFP) (f)). Two-way repeated-measures ANOVA was performed for all comparisons. *P < 0.05, **P < 0.01, ****P < 0.0001. All data expressed as mean ± s.e.m. Scale bars, 200 μm. The illustrations in c were created with BioRender (https://biorender.com). Source data
Extended Data Fig. 1
Extended Data Fig. 1. Detailed ethological analysis of social behaviour alterations in CSDS animals.
af, SUS mice show higher corner ratio (One-Way ANOVA, female, F (2, 31) = 29.62, P < 0.0001, n = 10 (CTRL), 12 (RES), 12 (SUS) (a), males, F (2, 46) = 17.58, P < 0.0001, n = 10 (CTRL), 13 (RES), 26 (SUS) (d)), while showing no locomotor activity deficits (One-Way ANOVA, female, F (2, 31) = 0.8416, P = 0.4406 (b), males, F (2, 46) = 0.8416, P = 0.4376, (e)) during SI test and showing longer latency to first social bout (One-Way ANOVA, female, F (2, 31) = 8.399, P = 0.0012, (c), males, F (2, 46) = 16.63, P < 0.0001, (f)) during RI test. gl, Correlation between SI ratio and social investigation time (female, R2 = 0.1728, P = 0.0145 (g), male, R2 = 0.1958, P = 0.0015 (j)), social avoidance (female, R2 = 0.3399, P = 0.0003 (h), male, R2 = 0.1847, P = 0.0021 (k)) and latency to first social bout (female, R2 = 0.1464, P = 0.0255 (i), male, R2 = 0.1366, P = 0.0090 (l)). mr, Correlation between CPP score and social investigation time (female, R2 = 0.2818, P = 0.0012 (m), male, R2 = 0.1533, P = 0.0054 (p)), social avoidance (female, R2 = 0.1995, P = 0.0081 (n), male, R2 = 0.0911, P = 0.0351 (q)) and latency to first social bout (female, R2 = 0.3065, P = 0.0007 (o), male, R2 = 0.0318, P = 0.2200 (r)). s, Subtracted CPP score of different stages of female estrus cycle show stage of the cycle has no effect on social CPP formation (One-Way ANOVA, F (3, 20) = 0.5148, P = 0.6768, n = 4 (Proestrus), 6 (Estrus), 4 (Metestrus), 10 (Diestrus)). t, Subtracted CPP score of different social targets for female social CPP. u, Distribution of different behaviour parameters of CTRL, RES, SUS animals. ns, not significant. * P < 0.05, ** P < 0.01, *** P < 0.001, **** P < 0.0001. All data are expressed as mean ± s.e.m. Source data
Extended Data Fig. 2
Extended Data Fig. 2. Memory tests in animals exposed to CSDS, effects of reversed test order on social behaviours, and behavioural parameters grouped by CPP score.
a, Schematic diagram of novel object recognition (NOR) test and novel location test (NLT). b, Novel object investigation time (One-Way ANOVA, F (2, 29) = 3.041, P = 0.0633, n = 10 (CTRL), 9 (RES), 13 (SUS)) and c, novel location investigation time (One-Way ANOVA F (2, 29) = 0.5601, P = 0.5772). d, Schematic diagram of reversed behaviour test order. e, Subtracted CPP score (One-Way ANOVA, F (2, 22) = 3.984, P = 0.0334), social investigation time (F (2, 22) = 8.267, P = 0.0021), social avoidance (F (2, 22) = 9.919, P = 0.0008) and SI ratio (F (2, 22) = 18.32, P < 0.0001, n = 8 (CTRL), 7 (RES), 9 (SUS). f, g, Social behavioural parameters after grouping by CPP score, (f) females, SI ratio (two-tailed t-test, t = 1.660, df = 32, P = 0.1067), social investigation time (t = 3.788, df = 32, P = 0.0006), social avoidance (t = 3.001, df = 32, P = 0.0052), latency (t=3.204, df = 32, P = 0.0031), n = 11 (CPP-), 23 (CPP+). (g) males, SI ratio (two-tailed t-test, t = 2.298, df = 47, P = 0.0261), social investigation time (t=2.868, df = 47, P = 0.0062), social avoidance (t = 2.545, df = 47, P = 0.0143), latency (t = 1.438, df = 47, P = 0.1570), n = 21 (CPP-), 28 (CPP+). ns, not significant, * P < 0.05, ** P < 0.01, *** P < 0.001, **** P < 0.0001. All data are expressed as mean ± s.e.m. Source data
Extended Data Fig. 3
Extended Data Fig. 3. Cleared whole brain activity data.
ad, Female iDISCO+ groups’ SI ratio (One-Way ANOVA, F (2, 27) = 22.25, P < 0.0001, n = 8 (CTRL), 11 (RES), 11 (SUS)) (a), social investigation time (One-Way ANOVA, F (2, 27) = 20.24, P < 0.0001) (b), social avoidance (One-Way ANOVA, F (2, 27) = 7.747, P = 0.0022) (c) and latency to first social bout (One-Way ANOVA, F (2, 27) = 6.075, P = 0.0066) (d). eh, Male iDISCO+ groups’ SI ratio (One-Way ANOVA, F (2, 25) = 13.85, P < 0.0001, n = 9 (CTRL), 11 (RES), 8 (SUS)) (e), social investigation time (One-Way ANOVA, F (2, 25) = 14.07, P < 0.0001) (f), social avoidance (One-Way ANOVA, F (2, 25) = 38.76, P < 0.0001) (g) and latency to first social bout (One-Way ANOVA, F (2, 25) = 7.370, P = 0.0030) (h). i, ClearMap cFos detection verification shows annotation (green dots) matching cFos signal (red nuclei). j, Brain slice cFos staining verification in males showing most of the cFos+ cells are in the lateral part of the lateral septum. k, Statistics of LS cFos during RI test following CSDS in males (Unpaired two-tailed t-test, CTRL, t4 = 1.434, P = 0.2248, n = 3 per group, RES, t4 = 1.957, P = 0.1219, n = 3 per group, SUS, t9 = 4.429, P = 0.0016, n = 5 (object), 6 (intruder)). ns, not significant, * P < 0.05, ** P < 0.01, *** P < 0.001, **** P < 0.0001. All data are expressed as mean ± s.e.m. Scale bar, 100 μm. Source data
Extended Data Fig. 4
Extended Data Fig. 4. Characterization of co-expression of neurotensin and other genes in lateral septum.
a, Ratio of Nt+cFos+ /Nt+ (492 of 520 neurons) and Nt+cFos+ /cFos+ (492 of 496 neurons) in LS of SUS mice. b,c, Multiplex ISH shows Nt and Gad2 colocalization in anterior, middle and posterior LS (b) shows most of the neurotensin neurons are GABAergic neurons (c). (n = 3 slices per mouse, n = 3 mice per group, scale bar, 100 μm). d,e, Multiplex ISH shows Nt and Crhr2 colocalization in LS (d) shows Nt neurons and Crhr2 neurons are largely overlapping in anterior and middle parts of the LS, but show very low colocalization in the posterior part of the LS (e). (n = 3 slices per mouse, n = 3 mice per group, scale bar, 100 μm). f, g, Multiplex ISH shows Nt and Drd3 do not overlap in the LS (n = 3 slices per mouse, n = 3 mice per group, scale bar, 50 μm). h, i, Multiplex ISH shows Nt and Oxtr showing very low overlap in the LS (n = 3 slices per mouse, n = 3 mice per group, scale bar, 50 μm). j, Confocal images of Sst and cFos expression in CTRL, RES and SUS mice after RI test. k, Comparison of Sst+ cFos+ neurons between the three groups (One-Way ANOVA, F (2, 9) = 4.780, P = 0.0385, n = 4 per group, Scale bar, 100 μm). l, Comparison of Nt cFos+ neurons between female CTRL, RES and SUS mice (One-Way ANOVA, F (2, 6) = 0.2755, P = 0.7683, n = 3 per group) and males (F (2, 10) = 4.980, P = 0.0316, n = 3–6). ns, not significant, * P < 0.05. All data are expressed as mean ± s.e.m. Source data
Extended Data Fig. 5
Extended Data Fig. 5. Slice electrophysiology following CSDS, measurement of Ca2+ activity in NTLS neurons responses during food reward and social conditioning.
a, Characterization of ex vivo electrophysiology parameters measured in NTLS neurons following CSDS in SUS and RES mice. From left to right: Bar graph of average resting membrane potential per neuron (mean SUS= −67.49 mV +/− 0.975 mV, n = 55 with 4–8 neurons/mouse; mean RES = −61.62 mV +/− 1.73 mV, n = 19 with 4–7 neurons/mouse; two-tailed Welch’s t test, P = 0.0059). No difference in action potential threshold (two-tailed Welch’s test, P = 0.3037), amplitude (two-tailed Welch’s test, P = 0.6661), half-width duration (two-tailed Welch’s test, P = 0.3757) or fast after hyperpolarization (fAHP) amplitude (two-tailed Welch’s test, P = 0.7154). b, Social interaction ratio of fiber photometry cohort after CSDS in females (One-Way ANOVA, F (2, 11) = 5.629, P = 0.0207, n = 4 (CTRL), 5 (RES), 5 (SUS)) and males (One-Way ANOVA, F (2, 14) = 12.93, P = 0.0007, n = 7 (CTRL), 5 (RES), 5 (SUS (5)). c, Ca2+ activity in NTLS neurons during consumption of a peanut butter cup (left). Dashed line in c marks the beginning of biting. Comparison of Ca2+ ΔF/F change before and after biting (right, two-tailed paired t test, t = 1.577, df = 4, P = 0.1900, n = 5). d, Ca2+ traces in paired (pink) and unpaired (blue) conditioning chambers. The inset shows normalized area under curve (AUC) between paired and unpaired conditioning sessions (sexes combined, paired two-tailed t-test, CTRL, t = 0.1977, df = 5, P = 0.8511, RES, t = 1.049, df = 5, P = 0.3423, SUS, t = 5.453, df = 5, P = 0.0028), n = 6 per group). ns, not significant, * P < 0.05, ** P < 0.01, *** P < 0.001. All data are expressed as mean ± s.e.m. Source data
Extended Data Fig. 6
Extended Data Fig. 6. NTLS neuron manipulation in stress-naïve mice does not change social interaction and CVS has no effect on sCPP.
a, Expression of AAV-DIO-DREADDs in NTLS neurons. b, NTLS activation in stress-naïve mice does not change social behaviour in females (unpaired two-tailed t-test, t14 = 1.044, P = 0.3141, n = 8 per group) or males (unpaired two-tailed t-test, t14 = 1.434, P =0.3975, n = 8 per group). NTLS activation in stress-naïve mice does not change locomotor activity in females (unpaired two-tailed t-test, t14 = 0.3473, P = 0.7335, n = 8 per group) or males (unpaired two-tailed t-test, t14 = 1.425, P = 0.1762, n = 8 per group). c, NTLS chemogenetic activation in stress-naïve mice does not change social preference (Two-way repeated measures ANOVA, Vehicle, F = (1, 16) = 7.198, P = 0.0163, n = 9, CNO, F (1, 18) = 6.644, P = 0.0190, n = 10). d, Subtracted CPP score comparison between vehicle and CNO group (unpaired two-tailed t-test, t = 0.03518, df = 17, P = 0.9723, n = 10 per group). e, Schematic diagram of CVS and CPP test. f, CVS effect on sCPP in either sex (Two-way repeated measures ANOVA, female, CTRL, F (1, 22) = 4.824, P = 0.0389, n = 12, CVS, F (1, 22) = 5.172, P = 0.0331, n = 12; male, CTRL, F (1, 22) = 5.042, P = 0.0351, n = 12; CVS, F (1, 22) = 3.900, P = 0.0610, n = 12). g, Schematic diagram of virus injection and optogenetic manipulation of NTLS neurons during RTPP test. h, NTLS neuron activation does not alter real time place preference in either stress-naïve females (Paired two-tailed t-test, ChR2, t11 = 0.06179, P = 0.9518, n = 12, EYFP, t15 = 0.01923, P = 0.9849, n = 16) or males (Paired two-tailed t-test, ChR2, t8 = 0.3855, P = 0.7099, n = 9; EYFP, t8 = 0.6333, P = 0.5442, n = 9). ns, not significant. * P < 0.05. All data are expressed as mean ± s.e.m. Scale bar, 100 μm. BioRender was used to generate schematic figures in c,e,g. Source data
Extended Data Fig. 7
Extended Data Fig. 7. NTLS neurons modulate chronic restraint stress-induced object avoidance and anxiety-like behaviours.
a, Schematic diagram of chronic restraint stress and RI test. b, Comparison of latency to the first investigation (unpaired two-tailed t-test, t = 3.142, df = 18, P = 0.0056) and number of investigation bouts (t = 5.259, df = 18, P < 0.0001) with a novel restraint tube, or withdrawal from the tube (t = 5.229, df = 18, P < 0.0001), n = 10, between control (CTRL) and chronic restraint stressed (CRS) animals. c, Schematic diagram of CRS with DREADD manipulation during RI test. d, Latency (paired two-tailed t-test, t = 2.065, df = 8, P = 0.0728), and number of investigation bouts (t = 2.619, df = 8, P = 0.0307) with a novel restraint tube, or withdrawal from the tube (t = 1.988, df = 8, P = 0.0820), n = 9. e, Schematic diagram of chronic restraint stress with juvenile bedding/odour (CRSO) and RI test. f, Latency (unpaired two-tailed t-test, t = 0.5452, df = 18, P = 0.5923) and number of investigation bouts (t = 0.3971, df = 18, P = 0.6960) with a novel restrainer tube, or withdrawal from the tube (t = 0.000, df = 18, P > 0.9999), n = 10. g, NTLS activation in stress-naïve male mice leads to higher anxiety-like behaviour in the elevated plus maze (unpaired two-tailed t-test, t14 = 2.824, P = 0.0135, n = 8 per group). h, NTLS activation or inhibition in stress-naïve male mice modulate marble burying behaviour (two-tailed paired t-test, hM3Dq, t7 = 4.631, P = 0.0024, n = 8; hM4Di, t7 = 4.020, P = 0.0051, n = 8). i, NTLS activation or inhibition in stress-naïve male mice leads to higher or lower anxiety levels, respectively, in the open field test (unpaired two-tailed t-test, hM3Dq, t14 = 2.189, P = 0.0461, n = 8 per group; hM4Di, t14 = 1.424, P = 0.1762, n = 8 per group). j, with no locomotor changes (unpaired two-tailed t-test, hM3Dq, t14 = 1.641, P = 0.1230; hM4Di, t14 = 1.566, P = 0.1398). ns, not significant. * P < 0.05, ** P < 0.01, **** P < 0.0001. All data are expressed as mean ± s.e.m. BioRender was used to generate schematic figures in a,c,e,i. Source data
Extended Data Fig. 8
Extended Data Fig. 8. NTLS monosynaptic downstream region verification.
a, Schematic diagram of H129ΔTK-TT virus injection. 48 h after injection, there were no tdTomato+ neurons in downstream regions of NTLS neurons. b, Retrograde AAV-DIO-EGFP/tdTomato tracing verification shows NTLS→NAc, NTLS→AHN, NTLS→PAG monosynaptic connections. c, Colocalization analysis for overlapping NTLS projection neurons to the NAc/AHN/PAG. d, Cholera toxin subunit b (CTB) tracing for NTLS→NAc, NTLS→AHN, and NTLS→PAG projections. Representative image of LS (middle panel) with yellow arrowheads indicating neurons projecting to both NAc and AHN. White arrowheads indicate neurons projecting to both PAG and AHN. e, Number of projections showing colocalization of CTB tracers from three downstream regions (3 slices per brain region per mouse, n = 3 mice). All data are expressed as mean ± s.e.m. Scale bar, 100 μm.
Extended Data Fig. 9
Extended Data Fig. 9. Role of NTLS inputs to NAc and AHN in regulating social behaviours.
a, Schematic of NTLS targeting with NpHR and manipulation during social behaviour tests. be, NpHR axon terminal inhibition in the NAc (b, c) and AHN (d, e) rescued social investigation time and partially rescued social avoidance in both females (b, social investigation, F (1, 14) = 3.484, P = 0.0831, n = 8 per group; social avoidance, F (1, 14) = 1.180, P = 0.2956, n = 8 per group, d, social investigation, F (1, 14) = 4.982, P = 0.0425, n = 8 per group; social avoidance, F (1, 14) = 2.266, P = 0.1545, n = 8 per group) and males (c, social investigation, F (1, 14) = 0.2046, P = 0.6580, n = 8 per group; social avoidance, F (1, 14) = 1.214, P = 0.2891, n = 8 per group, e, social investigation, F (1, 14) = 4.597, P = 0.0501, n = 8 per group; social avoidance, F (1, 14) = 5.359, P = 0.0363, n = 8 per group). f-m, Optogenetic manipulation of NTLS→NAc and NTLS→AHN circuits during social CPP conditioning in both sexes. f, Activation of NTLS→NAc with ChR2 blocked social reward in RES females (EYFP, F (1, 12) = 2.362, P = 0.1502, n = 7, ChR2, F (1, 14) = 0.5543, P = 0.4689, n = 8) g, Inhibition of NTLS→NAc with NpHR rescued social reward deficits in SUS females (EYFP, F (1, 14) = 0.5105, P = 0.4867, NpHR, F (1, 14) = 4.183, P = 0.0601, n = 8 per group). h, Activation of NTLS→AHN with ChR2 blocked social reward in RES females (EYFP, F (1, 12) = 4.289, P = 0.0606, n = 7, ChR2, F (1, 14) = 0.0001296, P = 0.9911, n = 8). i, Inhibition of NTLS→AHN with NpHR rescued social reward deficits in SUS females (EYFP, F (1, 14) = 0.1068, P = 0.7487, NpHR, F (1, 14) = 4.575, P = 0.0505, n = 8 per group). j, Activation of NTLS→NAc with ChR2 blocked social reward in RES males (EYFP, F (1, 12) = 5.703, P = 0.0343, n = 7, ChR2, F (1, 14) = 0.2484, P = 0.6259, n = 8). k, Inhibition of NTLS→NAc with NpHR rescued social reward deficits in SUS males (EYFP, F (1, 14) = 4.053, P = 0.0637, NpHR, F (1, 14) = 4.140, P = 0.0613, n = 8 per group). l, Activation of NTLS→AHN with ChR2 blocked social reward in RES males (EYFP, F (1, 12) = 6.329, P = 0.0271, n = 7, ChR2, F (1, 14) = 0.1567, P = 0.6981, n = 8). m, Inhibition of NTLS→AHN with NpHR rescued social reward deficits in SUS males (EYFP, F (1, 12) = 0.6881, P = 0.4230, NpHR, F (1, 14) = 10.02, P = 0.0069, n = 8 per group). Two-way repeated measures ANOVA were performed for any comparison in this figure: ns, not significant. * P < 0.05, ** P < 0.01. All data are expressed as mean ± s.e.m. BioRender was used to generate schematic figures in a. Source data
Extended Data Fig. 10
Extended Data Fig. 10. Optogenetic validation of NTLS monosynaptic projections and effects of optogenetic stimulation of non-NTLS neurons on social behaviour.
a,b, ChR2-assisted circuit mapping of NTLS→NAc and NTLS→AHN pathways showing monosynaptic (with TTX), inhibitory (Cs-based internal, clamped at 0 mV) and GABAa-dependent (SR-95531, Gabazine) connections in 5/8 NAc/NDB neurons and 4/10 AHN neurons. c, Light-evoked inward current in a ChR2-EYFP+ Cre+ neuron in voltage-clamp mode (clamped at −70 mV) upon 1 s illumination with 470 nm blue light (left) and 15 Hz pulse-induced spikes (right). d, Schematic diagram of non-NTLS neuron infection and manipulation during social behaviour tests. e,f, Multiplex ISH for Nt and CreOff-ChR2-EYFP. c, Overlap of Nt+ EYFP+ neurons among EYFP+ neurons (2-3 slices per mouse, n = 5 mice). g, Light-evoked inward current in ChR2-EYFP+ non-Cre neurons in voltage-clamp mode (clamped at −70 mV) upon 1 s illumination with blue light (470 nm). h, Effect of ChR2 stimulation of non-Nt neurons on social investigation and social avoidance during RI test (Mixed-effects analysis two-way ANOVA, left, F (1, 13) = 0.2137, P = 0.6516, right, F (1, 13) = 0.5672, P = 0.4648, n = ChR2 (10), EYFP (5)). ns, not significant. All data are expressed as mean ± s.e.m. Scale bar, 50 μm. Source data

Comment in

References

    1. Feder A, Nestler EJ, Charney DS. Psychobiology and molecular genetics of resilience. Nat. Rev. Neurosci. 2009;10:446–457. doi: 10.1038/nrn2649. - DOI - PMC - PubMed
    1. Rappaport BI, et al. Peer victimization and dysfunctional reward processing: ERP and behavioral responses to social and monetary rewards. Front. Behav. Neurosci. 2019;13:120. doi: 10.3389/fnbeh.2019.00120. - DOI - PMC - PubMed
    1. Ethridge P, Sandre A, Dirks MA, Weinberg A. Past-year relational victimization is associated with a blunted neural response to rewards in emerging adults. Soc. Cogn. Affect. Neurosci. 2018;13:1259–1267. - PMC - PubMed
    1. Berton O, et al. Essential role of BDNF in the mesolimbic dopamine pathway in social defeat stress. Science. 2006;311:864–868. doi: 10.1126/science.1120972. - DOI - PubMed
    1. Krishnan V, et al. Molecular adaptations underlying susceptibility and resistance to social defeat in brain reward regions. Cell. 2007;131:391–404. doi: 10.1016/j.cell.2007.09.018. - DOI - PubMed

Publication types

MeSH terms