. 2022 Dec;612(7939):328-337.
doi: 10.1038/s41586-022-05491-6. Epub 2022 Nov 30.

PLD3 affects axonal spheroids and network defects in Alzheimer's disease

Affiliations

PLD3 affects axonal spheroids and network defects in Alzheimer's disease

Peng Yuan et al. Nature. 2022 Dec.

Abstract

The precise mechanisms that lead to cognitive decline in Alzheimer's disease are unknown. Here we identify amyloid-plaque-associated axonal spheroids as prominent contributors to neural network dysfunction. Using intravital calcium and voltage imaging, we show that a mouse model of Alzheimer's disease demonstrates severe disruption in long-range axonal connectivity. This disruption is caused by action-potential conduction blockades due to enlarging spheroids acting as electric current sinks in a size-dependent manner. Spheroid growth was associated with an age-dependent accumulation of large endolysosomal vesicles and was mechanistically linked with Pld3-a potential Alzheimer's-disease-associated risk gene1 that encodes a lysosomal protein2,3 that is highly enriched in axonal spheroids. Neuronal overexpression of Pld3 led to endolysosomal vesicle accumulation and spheroid enlargement, which worsened axonal conduction blockades. By contrast, Pld3 deletion reduced endolysosomal vesicle and spheroid size, leading to improved electrical conduction and neural network function. Thus, targeted modulation of endolysosomal biogenesis in neurons could potentially reverse axonal spheroid-induced neural circuit abnormalities in Alzheimer's disease, independent of amyloid removal.


Conflict of interest statement

J.G. is a member of the scientific advisory board at Vigil Neuro. The other authors declare no competing interests.

Figures
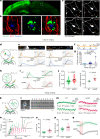
Fig. 1
Fig. 1. Plaque-associated axonal spheroids block AP propagation and disrupt interhemispheric connectivity.
a, Confocal images of a mouse brain after unilateral injection of AAV2-GFP. b, Images from the region in a indicated by a dashed box showing axonal spheroids that can only come from transcallosal projecting axons (green) that are not associated with the dendritic marker MAP2 (red). Scale bar, 5 μm. c, In vivo two-photon time lapse of axonal spheroids near an amyloid plaque (cyan dashed lines), showing dynamic (arrows) and stable (asterisk) structures. Scale bar, 5 μm. d, Schematics of axonal calcium imaging at two sides of an axonal spheroid (green) near a plaque (red) after electrical stimulation of the contralateral hemisphere. e, Example of GCaMP6f-labelled axons with (left) and without (right) spheroids and traces of axonal calcium dynamics in ROIs at both sides of the plaque (orange and blue). The y axis indicates the ΔF/F of calcium transients. The orange bars show the 50 Hz stimulus pulse train. The insets show magnified plots (grey rectangles). The black dotted lines indicate exponential regressions of the rising phase. The orange and blue dashed lines show estimated calcium rise times. Scale bars, 10 μm (top images) and 200 ms (insets). f, Traces showing conduction blockade (asterisks) after stimulation (yellow flash icons). g, Differences in estimated calcium rise times at axonal segments on both sides of an individual spheroid. n = 10, n = 21 and n = 8 axons for the no spheroid, small spheroid and large spheroid groups, respectively; obtained from n = 14 mice. h, Stimulation and calcium-imaging strategies to measure long-range interhemispheric axonal conduction. i, Traces of calcium dynamics in transcallosal axons imaged on the contralateral hemisphere. Scale bar, 200 ms (inset). j, The time interval between stimulation and the rise time presented by individual axons (left) or mice (right). n = 51 axons in n = 3 WT mice; n = 58 axons in n = 8 5xFAD mice. k, The strategy for axonal stimulation and two-photon voltage imaging of cell bodies to measure antidromic axonal conduction. l, Example of a voltage-sensor (ASAP3)-labelled cell body and the region of line scan (blue line) (left). Right, 1 kHz line scan kymograph after electrical stimulations (orange bars). The black arrows indicate APs. Scale bars, 10 μm (left and right vertical) and 100 ms (right horizontal). m, ASAP3 fluorescence traces. The orange bars indicate electrical stimulation. The electric current applied and the fast Fourier transform (FFT) power of 10 Hz are indicated below each trace. n, The probability of AP generation (FFT power) for each cell at a defined current. The inset shows examples of two individual cells at various current stimulations. o, The currents needed for 50% successful AP conduction for each cell (individual dots). n = 25 cells from n = 2 WT mice; n = 27 cells from n = 3 AD mice. p, The time interval between stimulation and AP spike time. n = 59 cells from n = 4 WT mice; n = 62 cells from n = 4 AD mice. q, The rise times (red shade) measured at the soma after stimulation of contralateral axons show similarity between GCaMP6f (green) or ASAP3 (grey). Scale bars, 10 ms (horizontal) and 1 arbitrary unit (AU) (vertical). Statistical analysis was performed using two-tailed Mann–Whitney U-tests (g, j (left), o and p) and a two-tailed paired t-test (j (right)). Data are mean ± s.e.m.
Fig. 2
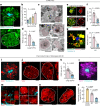
Fig. 2. Accumulation of abnormally ELPVs is associated with spheroid expansion and cognitive decline.
ah, Analyses in 5xFAD mice. a, Confocal image of spheroids labelled by LAMP1 (green) around an amyloid plaque (cyan). Bottom, magnified image (dashed box in the top image) of a large spheroid (white dotted outlines). The arrows indicate ELPVs. Scale bar, 10 μm. b, ELPV occurrence within spheroids at different ages in 5xFAD mice. n = 3 mice for each group. c, Electron microscopy images of spheroids showing diverse endolysosomal and autophagic vesicles (red shade). MVBs (i); an MVB, possibly fusing with an autophagosome (ii); an organelle with ILVs (iii); an autophagosome (iv); and the fusion of multiple MVBs (v) are shown. Scale bars, 500 nm. d, Spheroid size with the presence or absence of ELPVs. n = 3 mice from each group. e, Confocal images of spheroids (white dotted lines) with high or low levels of cathepsin D. Scale bar, 5 μm. f, Spheroid size as a function of cathepsin D levels. n = 6 mice for each group. g, Confocal image of spheroids expressing the pH sensor SEpHluorin-mCherry. Scale bar, 10 μm. h, Spheroid size as a function of pH (red–green fluorescence ratio). n = 4 mice for each group. io, Analyses of post-mortem brains of individuals with AD. i, Confocal image showing human spheroids around an amyloid plaque labelled by V0A1 (red). Scale bar, 10 μm. j, Confocal imaging of individual V0A1-labelled spheroids (white dotted lines). The arrowheads indicate enlarged vesicles. Scale bars, 2 μm. k, Spheroid size with the presence or absence of enlarged V0A1-labelled vesicles. n = 10 human individuals from each group. l, PLD3 (magenta) enrichment within spheroids. Scale bar, 10 μm. m,n, Confocal images of spheroids labelled with V0A1 in the brain of a human with AD with the PLD3(V232M) variant. Right, images of individual spheroids indicated by the orange boxes. Enlarged vesicles are indicated by arrows. The arrowheads indicate enlarged vesicles. Scale bars, 5 μm (m) and 2 μm (n). o, Occurrence of enlarged vesicle in PLD3(V232M) variant, AD and MCI post-mortem human brain tissues. n = 4 individuals with AD with the PLD3 variant, n = 6 individuals with AD and n = 4 individuals with MCI. Statistical analysis was performed using a Kruskal–Wallis test (b), two-tailed paired t-tests (d,f,h and k) and two-tailed Mann–Whitney U-tests (o). In all of the graphs, each pair of dots represents the average measurement from spheroids in the same mouse and data are mean ± s.e.m.
Fig. 3
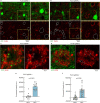
Fig. 3. PLD3 mediates endolysosomal vesicle enlargement and spheroid expansion.
a, Confocal image showing the enrichment of PLD3 in spheroids in 5xFAD mice. Scale bar, 10 μm. b, Confocal (left) and expansion microscopy (right) images of PLD3 immunofluorescence (red) and LAMP1–GFP (green) in spheroids. The arrows indicate PLD3 puncta within ELPVs. Scale bars, 2 μm (left) and 5 μm (right). c, Schematics of AAV-mediated PLD3 overexpression. d, Confocal images of spheroids after PLD3 (top) or control GFP (bottom) overexpression in 10-month-old 5xFAD mice. Right, magnified image of the area indicated by a white dashed box. Scale bars, 10 μm (left) and 5 μm (right). e, Spheroid size in 10-month-old 5xFAD mice with PLD3 or GFP overexpression, quantified by individual mice (top) or spheroids (bottom). n = 3 and n = 5 mice for the GFP and PLD3 groups, respectively. Each dot represents average measurements from 350–600 individual PAASs. The violin plots show the distributions of around 1,000–1,500 individual spheroids from each group. f, Confocal images of adjacent spheroids with (blue dashed line) and without (yellow dashed line) PLD3 overexpression. The arrows indicate ELPVs. Scale bar, 5 μm. g, ELPV occurrence in spheroids of 10-month-old 5xFAD mice with PLD3 or GFP overexpression. n = 3 and n = 4 mice for the GFP and PLD3 groups, respectively. Each dot represents the average measurement from 150 to 200 individual spheroids. h, Confocal images of spheroids in 5xFAD mice with PLD3 (left) or GFP (right) overexpression. The arrows indicate ELPVs. Scale bars, 5 μm (left) and 2 μm (right). i, ELPV size in spheroids of 10-month-old 5xFAD mice with PLD3 or GFP overexpression. n = 3 and n = 4 mice for the GFP and PLD3 groups, respectively. Each dot represents the average measurement from 500–1,000 ELPVs. j, Confocal (left two images) and expansion microscopy (right two images) images of Aβ42 immunofluorescence (red) and LAMP1–GFP (green) within spheroids. The arrows indicate Aβ42 puncta contained within ELPVs. Scale bars, 2 μm (left two images) and 5 μm (right two images). k, Confocal images showing incorporation of FM 1-43 dye into spheroids in cultured brain slices after treatment with vehicle or PitStop2. Scale bars, 10 μm. l, Quantification of FM 1-43 incorporation into PAASs after PitStop or Dynasore treatment. n = 20 spheroids for each group. The red dashed lines show regression to a sigmoid inhibition curve. m, In vivo assay to measure Aβ endocytosis into spheroids after intraparenchymal brain microinjections of fluorescently labelled Aβ42 peptide. n, Confocal images of fluorescently tagged Aβ42 (magenta) incorporated into spheroids (white). The arrows indicate Aβ42 puncta. Scale bars, 10 μm (left) and 5 μm (middle and right). o, Quantification of Aβ42 incorporation into spheroids. n = 3 mice, each with average measurements from n = 10 fields of view. Statistical analysis was performed using two-tailed Mann–Whitney U-tests (e and g) and two-tailed Welch’s t-tests (i and o), and F-tests were used to compare the fitted top and bottom parameters for each group in l. Data are mean ± s.e.m.
Fig. 4
Fig. 4. CRISPR–Cas9-mediated Pld3 deletion reduces spheroid size and improves axonal conduction.
a, The design of two guide RNAs targeting the Pld3 gene. b, Confocal images of adjacent spheroids with (blue dashed line) and without (yellow dashed line) Pld3 deletion. The arrows indicate ELPVs. Scale bar, 2 μm. c, ELPV occurrence in Pld3-deleted and control PAASs in 10-month-old 5xFAD/LSL-Cas9 mice. n = 4 mice for each group. Each dot is the average measurement of 150 to 250 individual spheroids. d, Confocal images of spheroids expressing control sgRNA (top) or Pld3-targeting sgRNA (bottom) in 10-month-old mice, showing infected (GFP+) and uninfected (red) spheroids around an amyloid plaque (cyan). Scale bars, 5 μm. e, Spheroid sizes in 10-month-old mice with or without Pld3 deletion, presented by individual mice (top) or individual spheroids (bottom). n = 6, n = 6 and n = 4 mice for control sgRNA, Pld3 sgRNA 1 and Pld3 sgRNA 2, respectively; each dot represents the average measurements of 350–600 individual spheroids (top). The violin plots show the distributions of around 1,200–2,600 individual PAASs from each group (bottom). f, Schematics of calcium imaging to measure conduction in contralateral axons with (yellow) or without (green) Pld3 manipulation. g,i, Example traces of calcium dynamics in contralateral axons after Pld3 deletion with sgRNA 2 (g) or overexpression (i). The orange bars show the 50 Hz spike train for stimulation. The insets show magnified plots of the calcium transients (grey rectangles). The black dotted lines indicate exponential regressions of the rising phase and the coloured vertical dashed lines show the estimated spike times. For the insets in g and i, scale bars, 200 ms (insets). h,j, Spike times in Pld3-deletion (h), Pld3-overexpression (OE) (j) or control axons, shown by either individual axons (left) or mice (right). n = 80 manipulated and n = 61 control axons from n = 6 mice with Pld3 deletion; n = 69 manipulated and n = 49 control axons from n = 5 mice with Pld3 overexpression. Statistical analysis was performed using two-tailed Mann–Whitney U-tests (c,e,h (left) and j (left)) and two-tailed paired t-tests (h (right) and j (right)). Data are mean ± s.e.m.
Fig. 5
Fig. 5. Reduction in axonal spheroids by Pld3 deletion improves neural circuit function.
a, Schematics of cholinergic neurons in the basal forebrain projecting to the cortex, infected with AAV viruses encoding either Pld3 or control sgRNAs (left). Right, two-photon images showing intermingled projecting basal forebrain axons (red) from the basal forebrain (red) with GCaMP6f-labelled cortical neurons (green). Scale bar, 100 μm. b, Representative two-photon image of GCaMP6f-labelled cortical neurons (purple dots). Scale bar, 50 μm. c, Example raw calcium traces from individual cortical neurons. d, Single-cell spike counts from individual neurons during a 30 min imaging session. Each dot represents the average spike count from all cells in the same mouse. The violin plots show distributions of spike counts from all individual neurons. e, Pairwise mutual information grouped by the distances between neurons. Data are mean ± s.e.m. Two-way analysis of variance was used to compare between groups. f, Neuron cluster size distributions classified by activity patterns (Louvain clustering; Methods). g, Quantification of population entropy (a measurement of temporal variance of the firing pattern) from each mouse imaged. For d,e and g, n = 4, n = 4 and n = 6 mice in the WT group, 5xFAD with control sgRNA group and 5xFAD with Pld3 sgRNA group, respectively. For f, n = 67, n = 21 and n = 45 clusters in the WT group, 5xFAD with control sgRNA group and 5xFAD with Pld3 sgRNA group, respectively. For d,f and g, statistical analysis was performed using one-way analysis of variance to compare among groups and the P values indicate a post hoc comparison between the groups, with Sidak’s correction for multiple comparisons. For d and g, the bars indicate the group mean.
Extended Data Fig. 1
Extended Data Fig. 1. Amyloid plaque-associated axonal spheroids predominantly show structural stability and some dynamism over extended intervals.
a, Confocal image of spheroids labelled with anti-LAMP-1 in a 5xFAD mouse. An axon labelled by GFP-expressing AAV co-localizes with LAMP-1. b, Estimation of the total number of spheroid-affected axons around individual amyloid plaques (Supplementary discussion 1). c, Frequency distribution of the number of spheroids per individual axon (top graph) and logarithmic transformation of the diameters of individual spheroids (bottom graph) quantified from confocal images of virally labelled individual axons, show a gaussian distribution (D’Agostino & Pearson normality test > 0.05, n = 76 for bulb number and 382 for bulb size. The fitted gaussian curves, 25 and 75 percentile values are marked with red lines). d, Quantification of the changes in axon spheroid number at different time intervals from in vivo time lapse images of individual axons, labelled with AAV-tdTomato (see Fig. 1). Each dot indicates an axon. Red dots indicate observed spheroid disappearance events. e, Pie chart representation of data in panel d, showing the proportions of imaged axons that showed PAAS appearance, disappearance, or no change during the respective time intervals. f, PAAS sizes change over time in individual axonal segments traced by in vivo imaging. Each line indicates a single axon.
Extended Data Fig. 2
Extended Data Fig. 2. Computational modelling of axonal conduction abnormalities caused by PAAS.
a, Computer simulations of membrane potentials recorded at two points on each side of PAAS (green and magenta arrows in upper panels) during a single action potential. Three different scenarios are presented demonstrating PAAS size-dependent conduction delay or block (lower panels) (See Supplementary Discussion 2 for details of the modelling results). b, Computer simulation of membrane potentials recorded at two points on each side of PAAS (green and magenta arrows) during a 20 Hz stimulation train. While single action potentials can be completely blocked by larger PAAS, repetitive stimulation can eventually lead to successful conduction of the action potential due to a capacitor effect of PAAS (Supplementary Discussion 2). c-d, Modelling of a simple resistor-capacitor electric circuit with 3 different levels of capacitance. Dashed line indicates 3 volts as an arbitrary threshold mimicking the minimal membrane potential to trigger neuronal firing. e, Representation of the simulation results with a range of spheroid diameters and membrane ion channel densities. f, Estimated probability distribution of the degree of conduction disruption in PAAS-forming axons. f’, Pie charts showing percentages for different types of conduction disruption patterns observed experimentally or by computational model prediction.
Extended Data Fig. 3
Extended Data Fig. 3. Axonal spheroids markedly disrupt spontaneous action potential conduction.
a, Two-photon in vivo calcium imaging of spontaneous activity in axons near amyloid plaques (blue) with and without PAAS. Given the relatively low frequency of spontaneously active neurons that can be captured in the vicinity of plaques, we used lower frame rates to image larger fields of view and were thus unable to measure precisely the Ca2+ rise times like in Fig. 1. b, Example traces of GCaMP6s fluorescence signal were obtained from ROIs (green and magenta circles) at the two sides of the plaques indicated in a (2Hz imaging frame rate). Mismatched Ca2+ transients are indicated with orange arrows. c, Correlation maps were calculated using the average fluorescence intensity within ROI1 (green circle in a, as reference, and colour-coded for correlation coefficient to every other pixel within the field of view. d, Decorrelation of GCaMP6s fluorescence in ROIs at the two axonal sides with respect to the plaque, during spontaneous Ca2+ transients (n = 12 axons without PAAS; and n = 10 axons with PAAS). Two-tailed Mann-Whitney test was used for comparison.
Extended Data Fig. 4
Extended Data Fig. 4. PAAS numbers in humans correlate with severity of cognitive impairment.
a, Axon spheroids labelled by Amyloid Precursor Protein (APP) immunofluorescence in post-mortem human brain (middle frontal gyrus), from subjects with mild cognitive impairment (MCI) and AD. b, Total spheroid number around individual plaques using APP immunostaining. Each dot indicates the average of 25 plaque measurements of an individual subject. Bars indicate group average. N = 12 AD and 6 MCI subjects. c, Spheroid size in AD and MCI patients based on APP immunofluorescence. Each dot represents an average measurement of 50 PAAS. N = 12 AD and 6 MCI subjects. d, Spheroid size in AD and MCI patients based on V0A1 immunostaining. Each dot represents an average measurement of 200~250 PAAS. N = 6 AD and 4 MCI patients. e, ApoE genotype, age, and Braak stage information of human AD and MCI brain tissue used in this study. f, CDR score and ABC score of patients with human AD with PLD3 V232M variant used in the study. Two-tailed Mann-Whitney tests were used in b, c and d. Data are represented as mean ± S.E.M.
Extended Data Fig. 5
Extended Data Fig. 5. Schematic diagram of the potential source of enlarged LAMP1-positive vesicles through disruption of the endosomal-lysosomal-autophagic system.
The endosomal-lysosomal-autophagic system is a dynamic and interconnected network of membranous organelles and vesicles that involves multiple biological processes, including endocytosis, autophagy, organelle maturation, vesicle trafficking and degradation. Enlarged LAMP1-positive vesicles (ELPVs) likely represent vesicular organelles at different stages of maturation into lysosomes, including late endosomes/multivesicular bodies (MVBs), endolysosomes (fusion product between late endosomes/MVBs and lysosomes), amphisomes (fusion product between autophagosomes and late endosomes/MVBs) and autolysosomes (fusion product between autophagosomes and lysosomes).
Extended Data Fig. 6
Extended Data Fig. 6. Additional data on the accumulation of enlarged vesicles within PAAS.
a, Confocal images of spheroids labelled by APP and Cathepsin D immunofluorescence in post-mortem human AD brain. Right panels show zoomed-in examples of spheroids (white dotted lines) with low or high Cathepsin D contents. All spheroids were positive with APP staining with variable labelling intensities. Some structures with saturated Cathepsin D labelling were likely to be microglia lysosomes. b, Spheroid size as a function of Cathepsin D contents. N = 11 human subjects. Each pair of dots represents average measurements from 50 spheroids in the same post-mortem brain. c, Comparisons of Cathepsin D levels within PAAS between AD and MCI patients. Each dot represents an average measurement of 50 PAAS. N = 12 AD and 6 MCI subjects. d, Receiver operating characteristic (ROC) curves clearly differentiate AD from MCI patients using PAAS diameter and APP or Cathepsin D contents as parameters. e-e’, Confocal image showing colocalization of V0A1 and LAMP1 in axonal spheroids in 5xFAD mice. f, Scatter plot of the intensities of Cathepsin D immunofluorescence against spheroid sizes, related to Fig. 2f. Each dot represents an individual spheroid, with individual mice labelled with different shapes. N = 50 spheroids for each mouse. Red line shows an exponential regression from all data, and p-value shows Z-test of decay coefficient against zero. g, Scatter plot of the pH sensor green to red fluorescence ratios against spheroid sizes, related to Fig. 2h. Each dot represents an individual spheroid, and dot colour indicates individual mice. N = 150 spheroids for each mouse. Coloured lines show linear regressions for data from each mouse, and p-values show Z-test of slope being zero. Two-tailed paired t test was performed in b. Two-tailed Mann-Whitney test was performed in c. Data are represented as mean ± S.E.M.
Extended Data Fig. 7
Extended Data Fig. 7. Absence of PLD3 protein expression in microglia and astrocytes in 5xFAD mice or human AD brains.
a and b, Confocal images showing absence of PLD3 signal (red) within Iba1-labelled microglia (green) in 5xFAD mouse brain (a) and post-mortem brain tissue of AD human patients (b). c, Confocal imaging of 5xFAD mouse brain showing absence of PLD3 signal (red) within S100-labelled astrocytes (green). d, Confocal imaging of human AD post-mortem brain tissue showing absence of PLD3 signal (red) within ALDH1L1-labelled astrocytes (green).
Extended Data Fig. 8
Extended Data Fig. 8. Analyses of ELPVs, spheroids and amyloid plaques in 5-month-old 5xFAD mice with PLD3 overexpression.
a, Confocal images of spheroids with GFP or PLD3 overexpression. Right panels show zoomed images from dashed boxes. b, Spheroid sizes in 5-month-old 5xFAD mice with PLD3 or GFP overexpression, presented by individual mice (b) or PAAS (b’). N = 6 and 5 mice for PLD3 and GFP groups, respectively; each dot represents average measurements from 350~600 PAAS. Violin plots show distributions of 1400~1600 individual PAAS from each group. c, Confocal images of adjacent PAAS with (blue dashed line) and without (yellow dashed line) PLD3 overexpression. Arrows indicated enlarged ELPVs. d, ELPV occurrence in PAAS in 5-month-old 5xFAD mice with PLD3 or GFP overexpression. N = 4 mice for each group. Each dot represents average measurements from 150~250 PAAS. e and f, Plaque number (e) and size (f) in mice with GFP or PLD3 overexpression. N = 5 and 6 for GFP and PLD3 groups, respectively. For (f), each dot represents average measurements from 100~250 plaques. g, Confocal images of LAMP1-positive vesicular structures in PAAS and cell bodies in 10-month-old mice with PLD3 overexpression. h, ELPV sizes in groups described in g. N = 4 mice for each group. Each dot represents average measurements from 500~1000 ELPVs from PAAS or 100–200 LAMP1-positive vesicles from cell bodies. i, Confocal images of spheroids and LAMP1-positive vesicles in wildtype mice overexpressing PLD3. Two-tailed Mann-Whitney tests were performed in b, b’ and d. Two-tailed unpaired t-tests were performed in e and f. Two-tailed Welch’s t-test was used in h. Data are represented as mean ± S.E.M.
Extended Data Fig. 9
Extended Data Fig. 9. Validation of CRISPR-Cas9-mediated PLD3 deletion.
a-d, Confocal images of PLD3 immunohistochemistry in tissue infected (green) and uninfected with PLD3-targeted sgRNA1 (a and c) or sgRNA2 (b and d). White dashed lines indicate outlines of infected cell bodies or individual spheroids. Yellow dashed lines indicate zoomed-in field of view on the right. e and f, Quantifications of PLD3 fluorescence intensities following background subtraction in cell bodies with (GFP+) or without (GFP-) PLD3-targeted sgRNA1 (e) or sgRNA2 (f). Each dot represents average fluorescence of a cell body. N = 13 GFP+ and 14 GFP- cell bodies in e; N = 21 GFP+ and 24 GFP- cell bodies in f. Mann-Whitney tests were performed. Data are represented as mean ± S.E.M.
Extended Data Fig. 10
Extended Data Fig. 10. Additional analyses of ELPVs, spheroids and amyloid plaques in mice with PLD3 deletion.
a and b, Confocal images of infected and uninfected PAAS in 5xFAD mice with control sgRNA (a) or PLD3-targeting sgRNA (b). c, Spheroid size in 5-month-old mice with control sgRNA or PLD3 sgRNA 2, presented by individual mice (c) or PAAS (c’). N = 4 and 5 mice for control and PLD3 sgRNA groups, respectively; each dot represents average from 350~600 PAAS measurements. Violin plots show the distributions of 800~1200 individual PAAS from each group. d, ELPV occurrence in mice with control sgRNA or PLD3 sgRNA 2. N = 4 mice for each group. Each dot represents the average measurements of 150~250 PAAS. e and f, Plaque number (e) and size (f) in mice with control or PLD3 sgRNA. N = 5 mice for each group. Each dot represents average measurements of 100~250 plaques. Two-tailed Mann-Whitney tests were performed in c, c’ and d. Two-tailed unpaired t-tests were performed in e and f. Data are represented as mean ± S.E.M.
Extended Data Fig. 11
Extended Data Fig. 11. Additional analyses of axonal conduction upon PLD3 modulation.
a, Spike times in axons expressing control sgRNA, presented by individual axons or by mice. n = 69 manipulated and 37 control axons, and N = 4 mice. b, Spike times in axons with dTomato overexpression, presented by individual axons (b) or by mice (b’). n = 42 manipulated and 21 control axons, from N = 4 mice. c, Example traces of calcium dynamics in contralateral axons following PLD3 deletion with sgRNA-1. Yellow flash icon indicates the time of stimulation. Orange bars show the 50 Hz spike train for stimulation. The inserts show zoomed-in plots of the calcium transients (grey rectangles). Black lines indicate exponential regressions of the rising phase and coloured vertical dashed lines show estimated spike times. d, Spike times in axons with PLD3-deletion using sgRNA-1, presented by individual axons (d) or by mice (d’). n = 71 manipulated and 46 control axons, and N = 5 mice. Two-tailed Mann-Whitney tests were performed in a, b and d. Two-tailed paired t-test were performed in a’, b’ and d’. Data are represented as mean ± S.E.M.
Extended Data Fig. 12
Extended Data Fig. 12. Proposed model of PAAS enlargement and functional consequences in Alzheimer’s disease.
1) Our study demonstrated that the accumulation of abnormally enlarged ELPVs is a major driver of PAAS enlargement. Small PAAS predominately contain mature lysosomes, while larger PAAS contain abundant and enlarged ELPVs. 2) We identified PLD3 as a critical modulator of MVB abnormalities and subsequent spheroid enlargement. PLD3 is uniquely sorted through the ESCRT pathway into the intralumenal vesicles (ILVs) of MVBs. The accumulation of PLD3 in spheroids could lead to MVB enlargement by interfering with ESCRT machinery. This process could be exacerbated with the presence of Aβ. Aβ from extracellular amyloid deposits is actively endocytosed and is present in the same subcellular compartments as PLD3. PLD3 could thus work synergistically with Aβ, leading to greater MVB abnormalities. 3) Large PAAS cause more severe conduction blocks, by functioning as current sinks. Given that hundreds of axons around each plaque develop spheroids and these structures remain stable for extended periods of times, the large number of plaques present in the AD brain could significantly affect neural networks by widespread disruption of axonal connectivity. 4) We found that cortical neurons in 5xFAD mice exhibited hyperactivity, and this can be corrected by restoring axon conduction through reducing PAAS in basal forebrain cholinergic projections. This suggests that PAAS can cause widespread disruption of neural circuit function. In addition, parallel compact axonal bundles that follow a stereotyped projection path along a tri-synaptic loop in hippocampus, a region critical for memory formation, could be particularly vulnerable to amyloid plaques located in the region. Furthermore, neural processes that rely on temporally precise long-range coordination among brain regions, such as memory consolidation, could be severely affected. In addition, synaptic plasticity could also be disrupted, due to the requirement of precise timing of firing between presynaptic and postsynaptic terminals. Altogether, action potential blocks caused by PAAS could be detrimental to various neural processes such as memory formation and reaction time, potentially contributing to cognitive decline in AD.

Comment in

References

    1. Cruchaga C, et al. Rare coding variants in the phospholipase D3 gene confer risk for Alzheimer’s disease. Nature. 2014;505:550–554. doi: 10.1038/nature12825. - DOI - PMC - PubMed
    1. Fazzari P, et al. PLD3 gene and processing of APP. Nature. 2017;541:E1–E2. doi: 10.1038/nature21030. - DOI - PubMed
    1. Gonzalez AC, et al. Unconventional trafficking of mammalian phospholipase D3 to lysosomes. Cell Rep. 2018;22:1040–1053. doi: 10.1016/j.celrep.2017.12.100. - DOI - PubMed
    1. Brier MR, et al. Loss of intranetwork and internetwork resting state functional connections with Alzheimer’s disease progression. J. Neurosci. 2012;32:8890–8899. doi: 10.1523/JNEUROSCI.5698-11.2012. - DOI - PMC - PubMed
    1. Selkoe DJ, Hardy J. The amyloid hypothesis of Alzheimer’s disease at 25 years. EMBO Mol. Med. 2016;8:595–608. doi: 10.15252/emmm.201606210. - DOI - PMC - PubMed

Publication types