. 2023 Feb 16;30(3):466-474.
doi: 10.1093/jamia/ocac232.

Modeling the impact of data sharing on variant classification

Affiliations

Modeling the impact of data sharing on variant classification

James Casaletto et al. J Am Med Inform Assoc. .

Abstract

Objective: Many genetic variants are classified, but many more are variants of uncertain significance (VUS). Clinical observations of patients and their families may provide sufficient evidence to classify VUS. Understanding how long it takes to accumulate sufficient patient data to classify VUS can inform decisions in data sharing, disease management, and functional assay development.

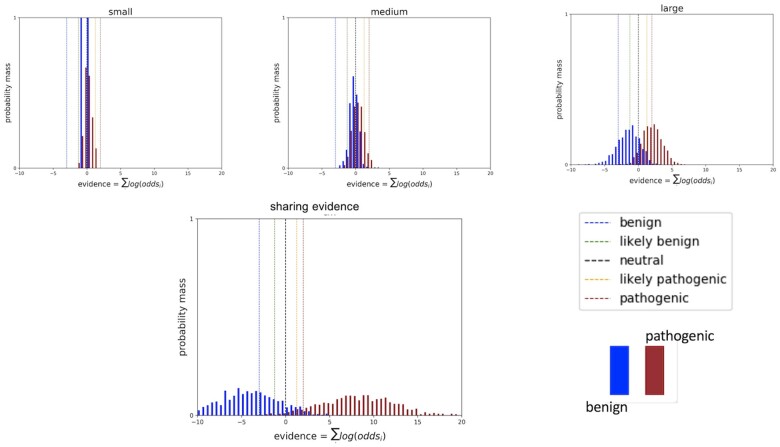
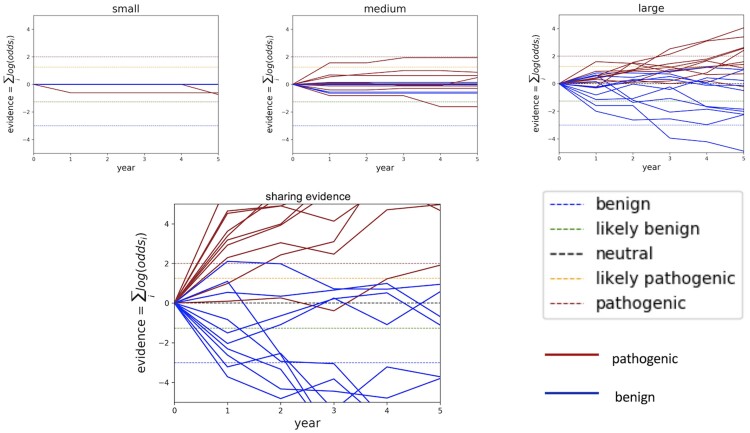
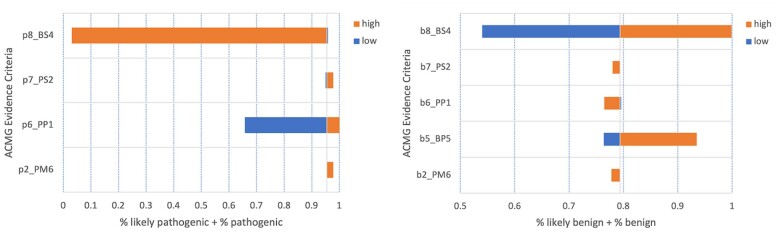
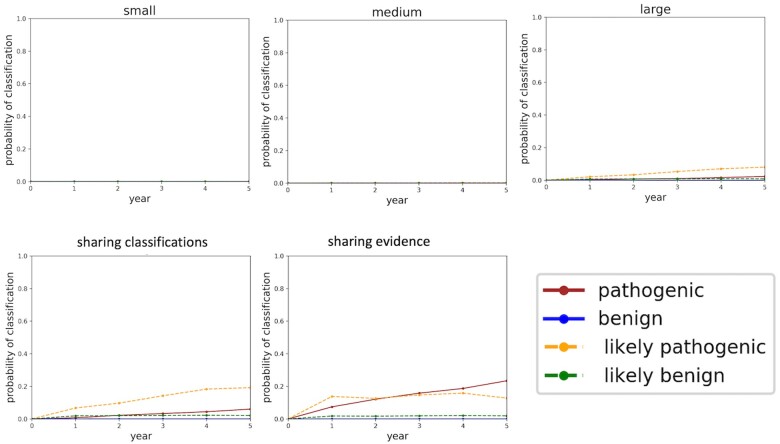
Materials and methods: Our software models the accumulation of clinical evidence (and excludes all other types of evidence) to measure their unique impact on variant interpretation. We illustrate the time and probability for VUS classification when laboratories share evidence, when they silo evidence, and when they share only variant interpretations.

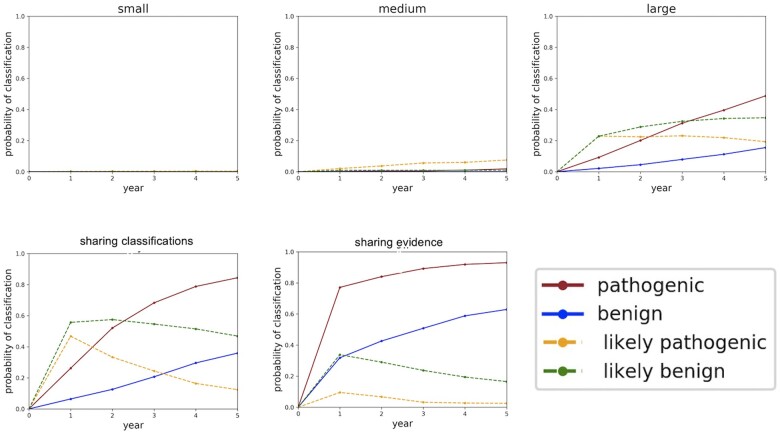
Results: Using conservative assumptions for frequencies of observed clinical evidence, our models show the probability of classifying rare pathogenic variants with an allele frequency of 1/100 000 increases from less than 25% with no data sharing to nearly 80% after one year when labs share data, with nearly 100% classification after 5 years. Conversely, our models found that extremely rare (1/1 000 000) variants have a low probability of classification using only clinical data.

Discussion: These results quantify the utility of data sharing and demonstrate the importance of alternative lines of evidence for interpreting rare variants. Understanding variant classification circumstances and timelines provides valuable insight for data owners, patients, and service providers. While our modeling parameters are based on our own assumptions of the rate of accumulation of clinical observations, users may download the software and run simulations with updated parameters.

Conclusions: The modeling software is available at https://github.com/BRCAChallenge/classification-timelines.

Keywords: benign; classification; genetic variation; modeling; pathogenic.


Figures

Figure 1.
Figure 1.
Histograms of cumulative log odds for classifying each of 1000 simulated variants present at a 1e−05 frequency in the population. Classification thresholds are demarcated as vertical hash lines.
Figure 2.
Figure 2.
Classification trajectories for 20 randomly selected variants at 1e−05 frequency in the population. Classification thresholds are demarcated as horizontal hash lines in the timeline plots.
Figure 3.
Figure 3.
Classification probabilities over the course of 5 years. The y-axis of these plots is the probability of classifying the variant, converted from the aggregated likelihoods of pathogenicity generated in the simulations. Year 0 constitutes the time just before the sequencing centers share their data and all the variants are unclassified. Year 1 constitutes the moment just after the sequencing centers share their data. As time progresses and more evidence becomes available, some of the variants which were LB get “promoted” to B, and similarly some of the variants which were LP get “promoted” to P. B: Benign; LB: Likely Benign; LP: Likely Pathogenic; P: Pathogenic.
Figure 4.
Figure 4.
Sensitivity of variant classification to the frequency of observing ACMG/AMP evidence criteria. These “high” and “low” values are taken from the confidence intervals in Table 1. (A) Tornado plot for the sensitivity of Pathogenic and Likely Pathogenic variants. (B) Tornado plot for the sensitivity of Benign and Likely Benign variants. ACMG: American College of Medical Genetics; AMP: Association for Molecular Pathology.
Figure 5.
Figure 5.
Probabilities of classifying variants at 1e−06 frequency plotted over the course of 5 years. The y-axis of these plots is the probability of classifying the variant, converted from the aggregated likelihoods of pathogenicity generated in the simulations. Year 0 constitutes the time just before the sequencing centers share their data and all the variants are unclassified. Year 1 constitutes the moment just after the sequencing centers share their data.

References

    1. Couch FJ, Nathanson KL, Offit K.. Two decades after BRCA: setting paradigms in personalized cancer care and prevention. Science 2014; 343 (6178): 1466–70. - PMC - PubMed
    1. Wexler RK, Elton T, Pleister A, Feldman D.. Cardiomyopathy: an overview. Am Fam Physician 2009; 79 (9): 778–84. - PMC - PubMed
    1. Berg JS. Exploring the importance of case-level clinical information for variant interpretation. Genet Med 2017; 19 (1): 3–5. - PMC - PubMed
    1. Harrison SM, Dolinsky JS, Knight Johnson AE, et al. Clinical laboratories collaborate to resolve differences in variant interpretations submitted to ClinVar. Genet Med 2017; 19 (10): 1096–104. - PMC - PubMed
    1. Cline MS, Liao RG, Parsons MT. et al. ; BRCA Challenge Authors. BRCA Challenge: BRCA Exchange as a global resource for variants in BRCA1 and BRCA2. PLoS Genet 2018; 14 (12): e1007752. - PMC - PubMed

Publication types