Observational Study
. 2022:36:103253.
doi: 10.1016/j.nicl.2022.103253. Epub 2022 Nov 7.

Hospitalisation for COVID-19 predicts long lasting cerebrovascular impairment: A prospective observational cohort study

Affiliations
Observational Study

Hospitalisation for COVID-19 predicts long lasting cerebrovascular impairment: A prospective observational cohort study

Kamen A Tsvetanov et al. Neuroimage Clin. 2022.

Abstract

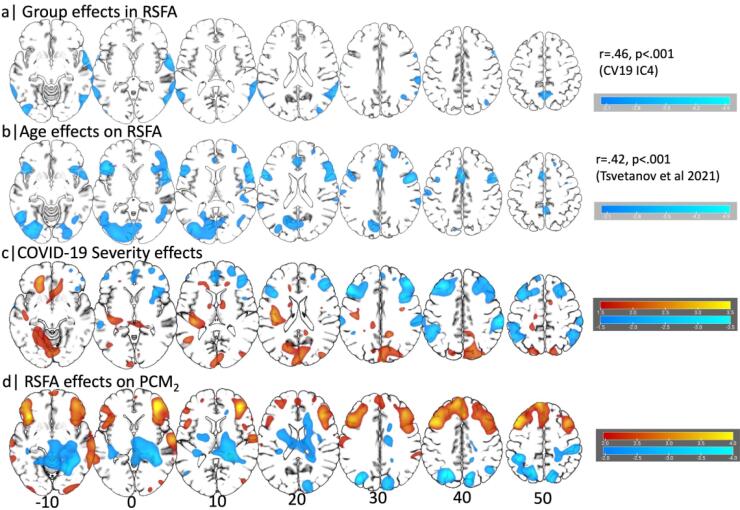
Human coronavirus disease 2019 (COVID-19) due to severe acute respiratory syndrome coronavirus-2 (SARS-CoV-2) has multiple neurological consequences, but its long-term effect on brain health is still uncertain. The cerebrovascular consequences of COVID-19 may also affect brain health. We studied the chronic effect of COVID-19 on cerebrovascular health, in relation to acute severity, adverse clinical outcomes and in contrast to control group data. Here we assess cerebrovascular health in 45 patients six months after hospitalisation for acute COVID-19 using the resting state fluctuation amplitudes (RSFA) from functional magnetic resonance imaging, in relation to disease severity and in contrast with 42 controls. Acute COVID-19 severity was indexed by COVID-19 WHO Progression Scale, inflammatory and coagulatory biomarkers. Chronic widespread changes in frontoparietal RSFA were related to the severity of the acute COVID-19 episode. This relationship was not explained by chronic cardiorespiratory dysfunction, age, or sex. The level of cerebrovascular dysfunction was associated with cognitive, mental, and physical health at follow-up. The principal findings were consistent across univariate and multivariate approaches. The results indicate chronic cerebrovascular impairment following severe acute COVID-19, with the potential for long-term consequences on cognitive function and mental wellbeing.

Keywords: COVID-19; Cardiorespiratory; Cerebrovascular; Microvascular; Neurology; SARS-CoV-2.


Conflict of interest statement

Declaration of Competing Interest The authors declare that they have no known competing financial interests or personal relationships that could have appeared to influence the work reported in this paper.

Figures

Fig. 1
Fig. 1
Schematic representation of various modality datasets in the study, their processing pipelines on a within-subject level, as well as data-reduction techniques and analytical strategy on between-subject level to test for associations between acute COVID-19 Severity and chronic cerebrovascular impairment. WHO-PS, COVID-19 WHO progression scale; BP, blood pressure; SpO2, blood oxygen saturation; fMRI, functional magnetic resonance imaging; RSFA, resting state fluctuation amplitudes; PCA, principal component analysis; ICA, independent component analysis; Covs, covariates of no interest; GLM, general linear model; PLS, partial least squares; LV, latent variable from PLS analysis; CRD, cardiorespiratory dysfunction component; CVB, cerebrovascular burden;
Fig. 2
Fig. 2
Group differences in RSFA. Source-based cerebrovasculometry for the component differentially expressed between groups: (a) independent component spatial map reflecting decrease in RSFA values in temporo-parietal regions. (b) Box plots of subject scores for patients hospitalised for COVID-19 (red) and control group (green, each circle represents an individual) indicating higher loading values for patients than controls as informed by two-sample unpaired permutation test (a robust regression was used to down-weight the effects of extreme data points). (For interpretation of the references to colour in this figure legend, the reader is referred to the web version of this article.)
Fig. 3
Fig. 3
Voxel-wise association in RSFA data. Association between RSFA and group identity (patient vs control) (a) To confirm the validity of results from the source-based cerebrovasculometry, we performed a second-level univariate analysis in SPM12 with RSFA as dependent variable. Group identity, age and sex were defined as predictors. The spatial pattern of group effects was highly consistent with the pattern identified using ICA (IC4), r = 0.46, p-spin < 0.001. (b) The spatial pattern associated with age effect was highly consistent with the pattern derived from a previous study using a large population-based cohort (n = 226, Tsvetanov et al., 2021b), r = 0.42, p-spin < 0.001. (c) Association between COVID-19 Severity PC1 (see Fig. 5A) and RSFA on voxel level showing a negative association between COVID-19 Severity and RSFA values in frontal and temporoparietal regions confirming the validity of the results in the partial-least squares analysis capturing the multivariate relationship between COVID-19 severity and cerebrovascular impairment. This was based on a second-level univariate analysis in SPM12 with RSFA as dependent variable. COVID-19 severity component, age and sex were defined as predictors. The nine measures constructing the COVID-19 severity component (COVID-19 SeverityPC1) included COVID-19 WHO Progression Scale and blood markers (CRP, ferritin, IL-6, bilirubin, d-dimer, PT, APTT and iPlatelets), see Fig. 5A. The model can be represented using Wilkinson’s notation as follows: RSFA ∼ 1 + COVID-19 SeverityPC1+ Age + Sex. (d) Association between the second physical, cognitive, and mental functioning component (PCMPC2) and RSFA on voxel level showing a positive association between phsycial and cognitive functioning with RSFA values in frontal and temporall regions. Maps are thresholded at uncorrected p-values of 0.05 for more complete description of the spatial representation.
Fig. 4
Fig. 4
Link between COVID-19 severity and RSFA. Partial least squares analysis of COVID-19 severity data at acute stage and RSFA-based cerebrovascular burden (CVB) at chronic stage. (a) Spatial distribution of parcellated RSFA values where dark to light colours are used for the strength of positive and negative correlations with the COVID-19 Severity profile (c). Note that regions with high cerebrovascular burden have low values in RSFA. (b) The scatter plot in the middle panel represents the relationship between subjects scores of RSFA-latent variable and COVID-19 Severity-latent variable identified by partial least squares analysis.
Fig. 5
Fig. 5
Data reduction of inpatient, clinical and research visit non-neuroimaging data using principal component analysis (separately on each dataset). (a) COVID-19 Severity component explaining 40% of the total variance loading most strongly on WHO COVID-19 11-point Progression scale (WHO-scale), C-reactive protein (CRP), d-dimer, ferritin, followed by bilirubin and activated partial thromboplastin time (APTT). Other biomarkers [interleukin-6, prothrombin time (PT), platelets (iPlatelets, counts so that higher scores represent lower counts)] loaded in the expected direction, but to a lesser extent. Scatter plots of subject scores for the corresponding components versus chronological age, where each circle is one patient. (b) Reduction of spirometry measures to a single variable to balance the representativeness of each data type for cardiorespiratory dysfunction dimensionality reduction (Hastie et al., 2009). Of the 12 spirometry measures the first principal component expressed FEV1 and FVC values explaining 45% of the spirometry data. FEV1 – forced expiratory volume in 1 s; PEF – peak expiratory flow; FVC – forced vital capacity. (c) First cardiorespiratory dysfunction component (CRD1) constructed from chronic cardiorespiratory data, explaining 37% and loading highly on lung function, oxygen saturation and pulse pressure. (d) The second component, explaining 22%, loaded on oxygen saturation and orthostatic hypotension. SpiroLogPCA1 – first principal component across 12 log-transformed spirometry variables (see panel b); DiffSpO2 and DiffHR – difference in arterial oxygen saturation and heart rate before and after a 6-minute walk test; BPdiaOrth and BPsysOrth – orthostatic intolerance in diastolic and systolic blood pressure, respectively; BPppStandLog and BPppLyingLog – pulse pressure while standing and lying, respectively. (e) The first component of physical, cognitive and mental dysfunction (PCM1) explaining 33% and loading highly on mental health variables. (f) PCM2 explaining 14% and loading positively on cognitive function and functional independence. SF36-PF – physical functioning; SF36-RLP – role limitation physical, SF36-RLE – role limitation emotional, SF36-ED – energy dimension, SF36-EW – emotional wellbeing, SF36-SF – social functioning, SF-P – pain; SF36-GH – general health; iGAD7 – Generalised Anxiety Disorder-7; PCL5 – Posttraumatic Stress Disorder Checklist-5; PHQ15 – Patient Health Questionnaire-15; PHQ9 – Patient Health Questionnaire-9; BARTHEL – Barthel Index; MOCA – Montreal Cognitive Assesment; iMRS – inverted Modified Ranking Scale;
Fig. 6
Fig. 6
Spatial correspondence between COVID-19-related cerebrovascular burden map with neurotransmitter and brain distributions. Spatial correlation between Covid19 severity-induced cerebrovascular burden map and spatial patterns associated with a range of neurotransmitter receptor/transporters (Hansen et al., 2021b), selected genes relevant to SARS-CoV-2 brain entry (Iadecola et al., 2020) and brain metabolism parameters (Vaishnavi et al., 2010). Neurotransmitter receptors and transporters were selective to serotonin (5-HT1a, 5-HT1b, 5-HT2a, 5-HT4, 5-HT6, 5-HTT), norepinephrine (NET), histamine (H3), acetylcholine (ACh, A4B2, M1, VAChT), cannabinoid (CB1), opioid (MOR), glutamate (mGluR5), GABA (GABAa/bz) and dopamine (D1, D2, DAT). Metabolic maps were based on cerebal blood flow (CBF), cerebral blood volume (CBV), cerebral metabolic rate of glucose and oxygen (CMRGlu, CMRO2) and glycemic index (GI). Selective genes relevant to SARS-CoV-2 brain entry included angiotensin converting enzyme-2, ACE2; neuropilin-1, NRP1; neuropilin-2, NRP2, cathepsin-B, CTSB; cathepsin-L, CTSL, interferon type 2 receptors, IFNAR2; lymphocyte antigen 6-family member E, LY6E. The spatial maps of 5-HT1b, CMRGlu and Glycemic Index (GI) were significantly correlated with Covid19 severity-induced cerebrovascular burden map (* p-spin < 0.05 (one-sided), *** p-spin < 0.001). See text for more information.
Fig. 7
Fig. 7
Spatial correspondence between COVID-19-related cerebrovascular burden and cell-type decomposition. (a) Spatial map of the weighted whole genome expression profile correlated with the COVID-19-induced cerebrovascular burden map (CVB). (b) Cell-type decomposition was used to identify cell-type enrichment based on extent to which genes expressed the transcriptome map in a. Gene sets for each cell-type was constructed by thresholding the top 70 % of genes with greatest loadings. Note that results were consistent across a range of thresholds, ranging from 10 % to no threshold. The ratio of genes in each gene set preferentially expressed in eleven distinct cell-types (circles) is shown against their null distribution of a model with random selection of all genes (10,000 permutations, *p-value < 0.05). For example, pericyte’s ratio is calculated from the number of genes preferentially expressed in pericytes divided by the total number of genes. Cell type-specificity of genes is described elsewhere (Yang et al., 2021) Astro – astrocytes, BEC – brain endothelial cells, Epend – ependymal, MacMic – macrophage/microglia, Mfibro – meningeal fibroblast, Neuron – neuron, OPC – oligodendrocyte precursor cells, Oligo – oligodendrocytes, Peri – pericytes, Pfibro – perivascular fibroblast, SMC – smooth muscle cells.

References

    1. Agarwal S., Sair H., Gujar S., Hua J., Lu H., Pillai J. Functional Magnetic Resonance Imaging Activation Optimization in the Setting of Brain Tumor-Induced Neurovascular Uncoupling Using Resting-State Blood Oxygen Level-Dependent Amplitude of Low Frequency Fluctuations. Brain Connect. 2019;9:241–250. doi: 10.1089/BRAIN.2017.0562. - DOI - PMC - PubMed
    1. Ahamed J., Laurence J. Long COVID endotheliopathy: hypothesized mechanisms and potential therapeutic approaches. J Clin Invest. 2022;132 doi: 10.1172/JCI161167. - DOI - PMC - PubMed
    1. Ainslie P.N., Ashmead J.C., Ide K., Morgan B.J., Poulin M.J. Differential responses to CO2 and sympathetic stimulation in the cerebral and femoral circulations in humans. J Physiol. 2005;566:613–624. doi: 10.1113/jphysiol.2005.087320. - DOI - PMC - PubMed
    1. Alexander-Bloch A.F., Shou H., Liu S., Satterthwaite T.D., Glahn D.C., Shinohara R.T., Vandekar S.N., Raznahan A. On testing for spatial correspondence between maps of human brain structure and function. Neuroimage. 2018;178:540. doi: 10.1016/J.NEUROIMAGE.2018.05.070. - DOI - PMC - PubMed
    1. Arnatkevic̆iūtė A., Fulcher B.D., Fornito A. A practical guide to linking brain-wide gene expression and neuroimaging data. Neuroimage. 2019;189:353–367. - PubMed

Publication types