. 2022:36:103275.
doi: 10.1016/j.nicl.2022.103275. Epub 2022 Nov 24.

Non-REM sleep in major depressive disorder

Affiliations

Non-REM sleep in major depressive disorder

Leonore Bovy et al. Neuroimage Clin. 2022.

Abstract

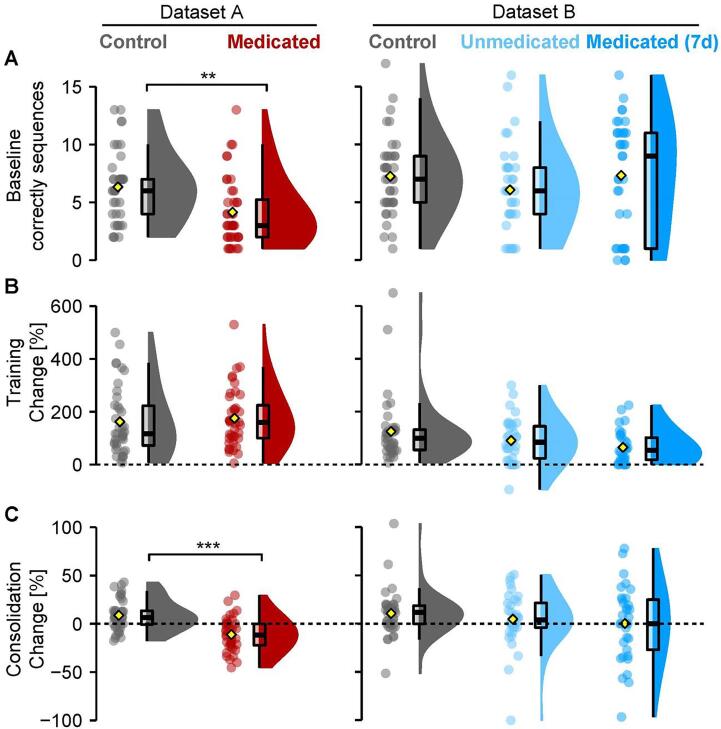
Disturbed sleep is a key symptom in major depressive disorder (MDD). REM sleep alterations are well described in the current literature, but little is known about non-REM sleep alterations. Additionally, sleep disturbances relate to a variety of cognitive symptoms in MDD, but which features of non-REM sleep EEG contribute to this, remains unknown. We comprehensively analyzed non-REM sleep EEG features in two central channels in three independently collected datasets (N = 284 recordings of 216 participants). This exploratory and descriptive study included MDD patients with a broad age range, varying duration and severity of depression, unmedicated or medicated, age- and gender-matched to healthy controls. We explored changes in sleep architecture including sleep stages and cycles, spectral power, sleep spindles, slow waves (SW), and SW-spindle coupling. Next, we analyzed the association of these sleep features with acute measures of depression severity and overnight consolidation of procedural memory. Overall, no major systematic alterations in non-REM sleep architecture were found in patients compared to controls. For the microstructure of non-REM sleep, we observed a higher spindle amplitude in unmedicated patients compared to controls, and after the start of antidepressant medication longer SWs with lower amplitude and a more dispersed SW-spindle coupling. In addition, long-term, but not short-term medication seemed to lower spindle density. Overnight procedural memory consolidation was impaired in medicated patients and associated with lower sleep spindle density. Our results suggest that alterations of non-REM sleep EEG in MDD might be more subtle than previously reported. We discuss these findings in the context of antidepressant medication intake and age.

Keywords: Antidepressant; Coupling; Depression; EEG; Medication; Non-REM sleep; Procedural memory consolidation; Sleep cycle; Sleep spindles; Slow waves.


Conflict of interest statement

Declaration of Competing Interest The authors declare that they have no known competing financial interests or personal relationships that could have appeared to influence the work reported in this paper.

Figures

Fig. 1
Fig. 1
Finger tapping task design. Participants were instructed to tap a sequence (e.g. 4-1-3-2-4) as accurate and fast as possible on a computer keyboard with their non-dominant hand. The number of correct sequences was the main behavioral outcome measure. During a training session, participants had to tap the sequence for 12 runs of 30 s each, with a 20-second break between runs. The difference between the first run and the mean of the last three runs was considered the “training effect”. After 24 h, which included a full night of EEG recorded sleep, three additional runs were tested. The difference between the mean of these three test runs and the mean of the last three training runs was considered the “consolidation effect”.
Fig. 2
Fig. 2
EEG non-REM sleep power spectra group comparisons. (A) In Dataset A, Medicated MDD patients (red) show reduced power in 1–4.6 Hz of non-REM sleep compared to controls (grey). (B) In Dataset B, Unmedicated MDD patients compared to controls (grey) show increased power in the fast spindle band range (13.6–14.4 Hz). Unmedicated MDD patients compared to themselves in the medicated state (dark blue) show increased power in the lower frequencies (2.6–3.4 Hz). Medicated patients, compared to controls show reduced power in lower frequencies but increased power in the fast spindle band as well as in the higher frequencies (>18 Hz). (C) In Dataset C, both 7-day (light green) and 28-day (dark green) medicated MDD patients show reduced power in the lower frequencies (1.2–3.4 Hz and 1.6 –3.6 Hz resp.) and increased power in the higher frequencies (>18.6 Hz and >17.4 Hz resp.) compared to controls (grey). In addition, 7-day medicated MDD patients show reduced power in the 5.5–10.4 Hz range compared to the same patients after 28 days. (For interpretation of the references to colour in this figure legend, the reader is referred to the web version of this article.)
Fig. 3
Fig. 3
Non-REM event features. (A) In Dataset A, Medicated MDD patients had a lower sleep spindle density than Controls (outlier depicted, significance based after outlier removal), as do 28-day Medicated patients compared to Controls in Dataset C. (B) In Dataset B, Unmedicated MDD patients show higher sleep spindle amplitudes than Controls. (C) In Dataset A, Medicated MDD patients show lower slow waves (SW) amplitudes than Controls, as did 7-day and 28-day medicated patients compared to controls in Dataset C. (D) In Dataset A, Medicated MDD patients had SW of longer duration than Controls, as did Medicated compared to Unmedicated patients in Dataset B. (E). No differences in each dataset on SW-spindle counts (F) nor delay between spindle and SW (downstate) trough (G) but an overall increase in delay dispersion (spread of the delay, in standard deviation [SD]) of spindles within SW in Medicated compared to Controls can be seen across datasets. Data is depicted in clouds of dots per individual, group mean (yellow diamond), and a 25%–75% quarter-quartile boxplots with minimum and maximum the 1.5 times the inter-quartile difference and smoothed density plots within the full group range. Significances for two-group comparisons in asterisks (*, p <.05; **, p <.01, ***, p <.001). (For interpretation of the references to colour in this figure legend, the reader is referred to the web version of this article.)
Fig. 4
Fig. 4
Finger tapping task performance for baseline, training, and consolidation over 24 h. (A). Amount of correctly tapped sequences of the first 30-second run. Medicated patients in Dataset A taped fewer sequences correct than Controls. (B) Percentage change score between the first run and the mean of the last three runs. (C) Percentage change score between the mean of three test runs after sleep in the morning and the mean of the last three training runs before sleep. Medicated patients in Dataset A performed worse after sleep than Controls. Data depicted like in Fig. 3. Significances for two-group comparisons in asterisks (**, p <.01; ***, p <.001).

References

    1. Albouy G., King B.R., Maquet P., Doyon J. Hippocampus and striatum: Dynamics and interaction during acquisition and sleep-related motor sequence memory consolidation. Hippocampus. 2013;23:985–1004. - PubMed
    1. Allen, M., Poggiali, D., Whitaker, K., Marshall, T.R., Kievit, R., 2018. Raincloud Plots: A Multi-Platform Tool for Robust Data Visualization. PeerJ Inc; 2018. doi.org/10.7287/peerj.preprints.27137v1. - PMC - PubMed
    1. Armitage R., Hoffmann R., Trivedi M., Rush A.J. Slow-wave activity in NREM sleep: sex and age effects in depressed outpatients and healthy controls. Psychiatry Res. 1992;95:201–213. - PubMed
    1. Aust, F., Barth, M., 2018. Papaja: Prepare Reproducible APA Journal Articles with R Markdown. 2018; Retrieved from https://github.com/crsh/papaja.
    1. Benca R.M., Obermeyer W.H., Thisted R.A., Gillin J.C. Sleep and psychiatric disorders: a meta-Analysis. Arch. Gen. Psychiatry. 1992;49:651–668. - PubMed