. 2023 Mar;237(5):1810-1825.
doi: 10.1111/nph.18651. Epub 2022 Dec 18.

Redirecting tropane alkaloid metabolism reveals pyrrolidine alkaloid diversity in Atropa belladonna

Affiliations

Redirecting tropane alkaloid metabolism reveals pyrrolidine alkaloid diversity in Atropa belladonna

Hannah M Parks et al. New Phytol. 2023 Mar.

Abstract

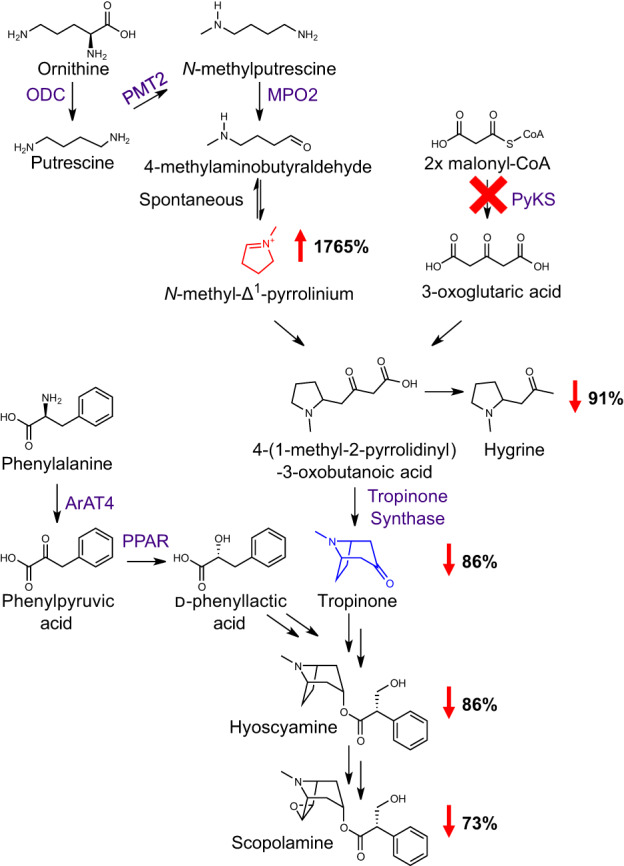
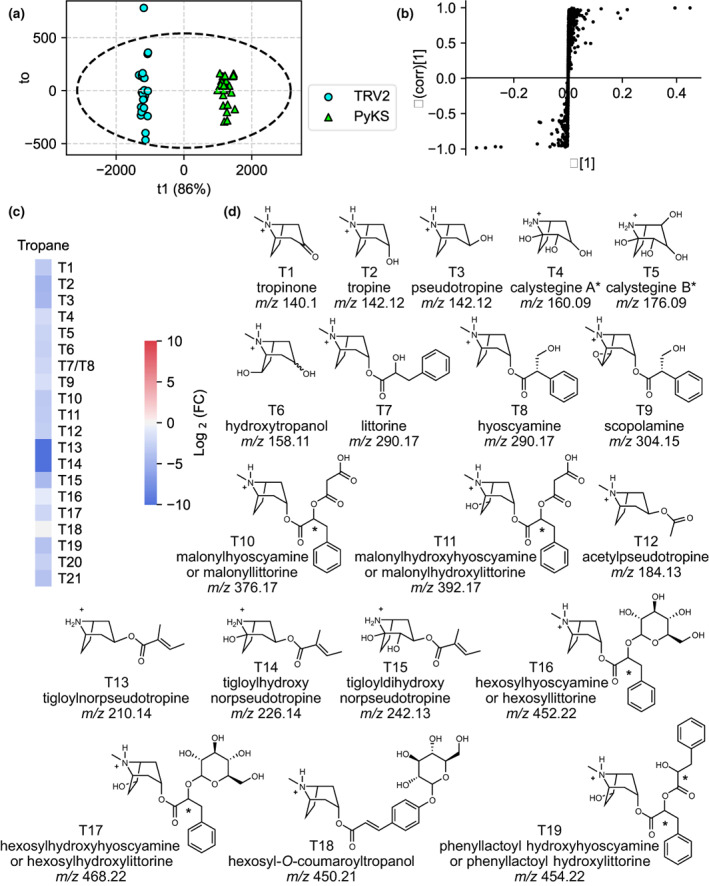
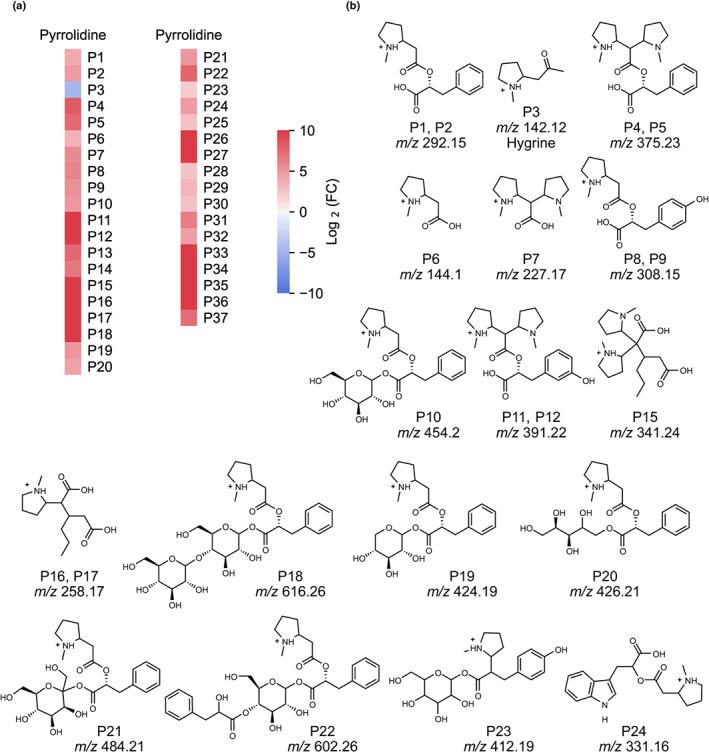
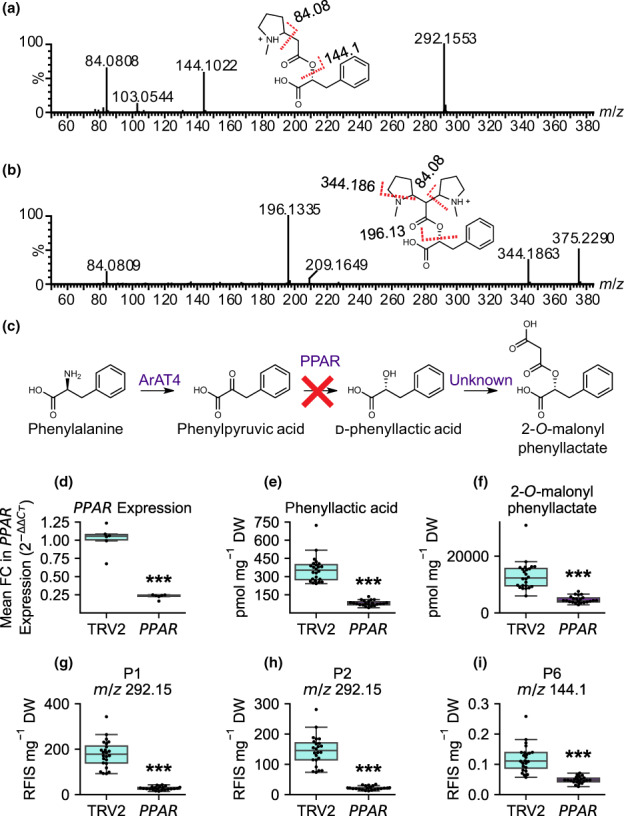
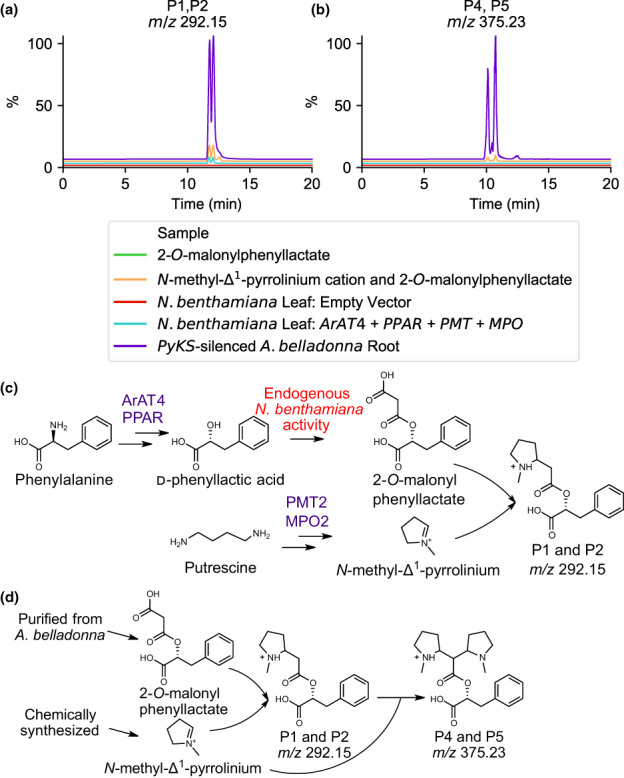
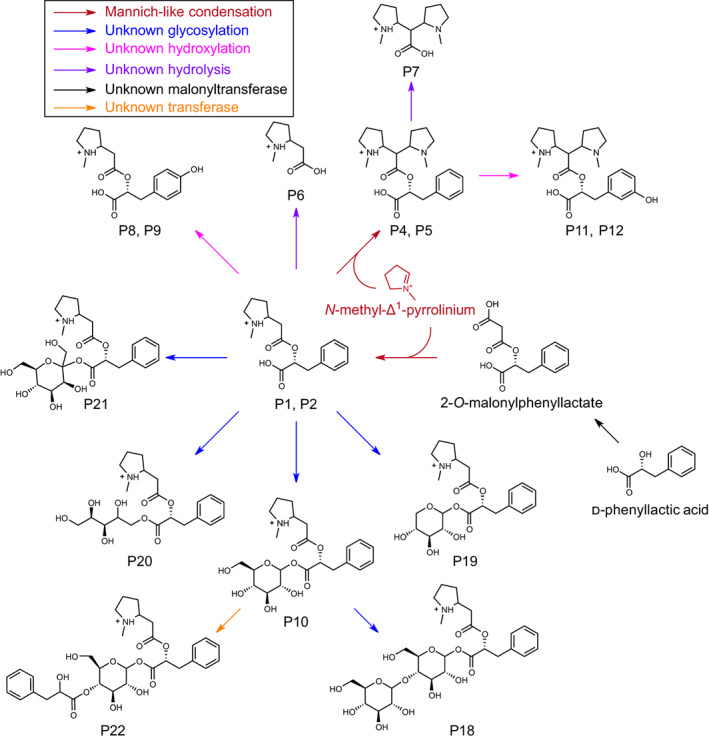
Plant-specialized metabolism is complex, with frequent examples of highly branched biosynthetic pathways, and shared chemical intermediates. As such, many plant-specialized metabolic networks are poorly characterized. The N-methyl Δ1 -pyrrolinium cation is a simple pyrrolidine alkaloid and precursor of pharmacologically important tropane alkaloids. Silencing of pyrrolidine ketide synthase (AbPyKS) in the roots of Atropa belladonna (Deadly Nightshade) reduces tropane alkaloid abundance and causes high N-methyl Δ1 -pyrrolinium cation accumulation. The consequences of this metabolic shift on alkaloid metabolism are unknown. In this study, we utilized discovery metabolomics coupled with AbPyKS silencing to reveal major changes in the root alkaloid metabolome of A. belladonna. We discovered and annotated almost 40 pyrrolidine alkaloids that increase when AbPyKS activity is reduced. Suppression of phenyllactate biosynthesis, combined with metabolic engineering in planta, and chemical synthesis indicates several of these pyrrolidines share a core structure formed through the nonenzymatic Mannich-like decarboxylative condensation of the N-methyl Δ1 -pyrrolinium cation with 2-O-malonylphenyllactate. Decoration of this core scaffold through hydroxylation and glycosylation leads to mono- and dipyrrolidine alkaloid diversity. This study reveals the previously unknown complexity of the A. belladonna root metabolome and creates a foundation for future investigation into the biosynthesis, function, and potential utility of these novel alkaloids.

Keywords: Atropa belladonna; Solanaceae; metabolomics; nonenzymatic catalysis; pyrrolidine alkaloids; specialized metabolism; tropane alkaloids.


Conflict of interest statement

None declared.

Figures

Fig. 1
Fig. 1
Examples of pyrrolidine and tropane alkaloid diversity formed through distinct biosynthetic routes. The pyrrolidine core is colored red. The first ring of the tropane core is a pyrrolidine highlighted in red, while the remaining portion of the tropane core is highlighted in blue.
Fig. 2
Fig. 2
Effect of silencing PyKS on tropane metabolism in Atropa belladonna roots. Virus‐induced gene silencing of a root‐expressed polyketide synthase (PyKS) in A. belladonna roots, indicated by the red ‘X’, disrupts tropane alkaloid biosynthesis and causes an accumulation of the N‐methyl‐Δ1‐pyrrolinium ion shown in red. The upward‐pointing red arrow reflects the percentage increase in the N‐methyl‐Δ1‐pyrrolinium ion in AbPyKS‐silenced lines compared with TRV2 empty vector controls. Downward red arrows represent the percentage decrease in the pyrrolidine alkaloid hygrine and tropane alkaloids in AbPyKS‐silenced lines compared with TRV2 empty vector controls. Data are adapted from Bedewitz et al. (2018). For simplicity, an abbreviated tropane pathway is shown and omitted steps are indicated by double arrows. Tropinone, the first tropane alkaloid in the pathway with the characteristic bicyclic ring structure of all tropanes, is shown in blue. Enzyme abbreviations are as follows; ArAT4, phenylalanine:4‐hydroxyphenylpyruvate aminotransferase; MPO2, methylputrescine oxidase; ODC, ornithine decarboxylase; PMT2, putrescine methyltransferase; PPAR, phenylpyruvic acid reductase.
Fig. 3
Fig. 3
Discovery metabolite profiling of PyKS‐silenced lines reveals a decrease in tropane alkaloids in Atropa belladonna roots. (a) The orthogonal projections to latent structures discriminant analysis (OPLS‐DA) scores plot showing the separation of TRV2 control and PyKS‐silenced plants. The first component (T1 or predictive component shown on the x‐axis), the genotypic component, explains 86% of the variation between the samples. Each point represents a single metabolite extraction taken from a TRV2 (blue) or PyKS (green) plant. Within‐group variance (to or the orthogonal component) is shown on the y‐axis, and Hotelling's T2 (95%) ellipse is shown with the dashed ellipse. (b) The OPLS‐DA S‐plot reveals the ions that contribute to the differences between TRV2 control and PyKS‐silenced lines. Each point represents a signal from the metabolite profiles of the TRV2‐ and PyKS‐silenced plants. Positive x‐ and y‐values indicate that these signals are more abundant in PyKS‐silenced plants compared with the TRV2 controls while negative values indicate that these signals are more abundant in TRV2 control plants compared with PyKS‐silenced plants. X‐values approaching axes extremes (−1 or 0.5) designate that those signals greatly contribute to the model differences, whereas y‐values approaching axes extremes (−1 or 1) are indicative of increased confidence. (c) Change in tropane alkaloid abundance in PyKS‐silenced plants compared with TRV2 controls (log2(FC) refers to log2(fold change)). Red indicates the corresponding metabolite is increased in abundance in PyKS‐silenced plants relative to TRV2 controls, while blue represents metabolites that are decreased. (d) Structural annotations of quantified tropane alkaloids. Compounds are numbered as they appear in the text and annotations are based on tandem mass spectrometry fragmentation (Supporting Information Table S8). Metabolite structures (T1–T19) are displayed in the [M+H]+ form. m/z corresponds to the mass‐to‐charge ratio. An asterisk indicates an ambiguous structural annotation due to unresolved stereochemistry or the presence of isomers.
Fig. 4
Fig. 4
Discovery metabolite profiling of PyKS‐silenced lines reveals an increase in pyrrolidine alkaloids in Atropa belladonna roots. (a) Change in pyrrolidine alkaloid abundance in PyKS‐silenced plants compared with TRV2 controls (log2(FC) refers to log2(fold change)). Red indicates the corresponding metabolite is increased in abundance in PyKS‐silenced plants relative to TRV2 controls, while blue represents metabolites that are decreased. (b) Structural annotations of quantified pyrrolidine alkaloids. Compounds are numbered as they appear in the text and annotations are based on tandem mass spectrometry fragmentation (Supporting Information Table S9). Metabolite structures (P1–P24) are displayed in the [M+H]+ form. The stereochemistries of the sugar moieties of P10 and P18 through P23 as well as the positions of the hydroxyl groups on the aromatic ring of P8, P9, P11, P12, and P23 are unresolved. m/z corresponds to the mass‐to‐charge ratio.
Fig. 5
Fig. 5
Phenyllactic acid (PLA) is incorporated into pyrrolidine alkaloid metabolites. Liquid chromatography with tandem mass spectrometry spectra obtained for the (a) P1 (m/z 292.15) and (b) P4 (m/z 375.23) metabolites collected in positive mode with electrospray ionization. The x‐axis indicates the mass‐to‐charge ratio (m/z) of the fragment ions, whereas the y‐axis indicates percent abundance. Red‐dashed lines indicate fragmentation of the molecule at that location with the numerical value of the fragment yielded indicated above the dashed line. A loss of 31 Da in (b) (producing the m/z 344 and m/z 196 fragments) indicates a neutral loss of methylamine. Fragmentation to m/z 144.1 and m/z 196.13 in panels (a) and (b) represents a neutral mass loss of PLA and a neutral mass loss of PLA and methylamine, respectively. (c) The pathway for 2‐O‐malonylphenyllactate formation in Atropa belladonna with the red ‘X’ indicating silencing of PPAR. (d) Mean fold change (FC) in PPAR expression in TRV2 control (n = 6) and PPAR‐silenced (n = 6) A. belladonna plants with the six median PLA levels for each genotype. Genotypes are shown on the x‐axis and the mean FC in PPAR expression is shown on the y‐axis calculated as mean 2ΔΔCt. (e–i) Metabolite abundances of PLA, 2‐O‐malonylphenyllactate, P1, P2, and P6 in TRV2 (n = 24; left, cyan) and PPAR (n = 22; right, purple). (d–i). Box and whisker plots are displayed with horizontal lines indicating upper extreme, upper quartile, median, lower quartile, and lower extreme in order from top to bottom. The dots on the box and whisker plots represent individual samples. Statistical significance is indicated as determined by Welch's t‐test: ***, P < 0.001.
Fig. 6
Fig. 6
In planta and nonenzymatic formation of pyrrolidine alkaloids. Extracted ion chromatogram of (a) P1 and P2 (m/z 292.15) and (b) P4 and P5 (m/z 375.23) showing nonenzymatic formation (orange) and in Nicotiana benthamiana (cyan) in comparison with an PyKS‐silenced Atropa belladonna root sample (purple). Assay experimental design for pyrrolidine alkaloid formation in (c) N. benthamiana leaf and (d) nonenzymatic synthesis. Metabolite structures are displayed in the [M+H]+ form for P1, P2, P4, and P5. Enzyme abbreviations are as follows; ArAT4, phenylalanine:4‐hydroxyphenylpyruvate aminotransferase; MPO2, methylputrescine oxidase; PMT2, putrescine methyltransferase; PPAR, phenylpyruvic acid reductase. m/z corresponds to the mass‐to‐charge ratio.
Fig. 7
Fig. 7
Proposed pyrrolidine alkaloid subnetwork in Atropa belladonna root. 2‐O‐malonylphenyllactate is formed from d‐phenyllactic acid through catalysis by an unknown acyltransferase. 2‐O‐malonyl phenyllactate undergoes Mannich‐like decarboxylative condensation with the N‐methyl‐Δ1‐pyrrolinium ion to form the m/z 292.15 metabolite (P1 and P2). The m/z 292.15 metabolite is subsequently modified through addition of a second N‐methyl‐Δ1‐pyrrolinium ion to yield the m/z 375.23 metabolite (P4 and P5). These scaffold molecules then undergo further modifications by unknown enzymes leading to increased pyrrolidine alkaloid diversity. For simplicity, only single isomers of each metabolite are shown. Structures inferred from MS/MS fragmentation (Supporting Information Table S9). Metabolite structures are displayed in the [M+H]+ form (P1, P2, P4–P12, and P18–P22). m/z corresponds to the mass‐to‐charge ratio.

References

    1. Basha NJ, Basavarajaiah SM, Shyamsunder K. 2022. Therapeutic potential of pyrrole and pyrrolidine analogs: an update. Molecular Diversity 26: 2915–2937. - PMC - PubMed
    1. Bedewitz MA, Gongora‐Castillo E, Uebler JB, Gonzales‐Vigil E, Wiegert‐Rininger KE, Childs KL, Hamilton JP, Vaillancourt B, Yeo YS, Chappell J et al. 2014. A root‐expressed l‐phenylalanine:4‐hydroxyphenylpyruvate aminotransferase is required for tropane alkaloid biosynthesis in Atropa belladonna . Plant Cell 26: 3745–3762. - PMC - PubMed
    1. Bedewitz MA, Jones AD, D'Auria JC, Barry CS. 2018. Tropinone synthesis via an atypical polyketide synthase and P450‐mediated cyclization. Nature Communications 9: 5281. - PMC - PubMed
    1. Blair LM, Calvert MB, Sperry J. 2017. Flavoalkaloids‐isolation, biological activity, and total synthesis. The Alkaloids: Chemistry and Biology 77: 85–115. - PubMed
    1. Dieuleveux V, Lemarinier S, Gueguen M. 1998. Antimicrobial spectrum and target site of D‐3‐phenyllactic acid. International Journal of Food Microbiology 40: 177–183. - PubMed

Publication types