. 2022 Nov 14:13:1050951.
doi: 10.3389/fimmu.2022.1050951. eCollection 2022.

Complex interaction and heterogeneity among cancer stem cells in head and neck squamous cell carcinoma revealed by single-cell sequencing

Affiliations

Complex interaction and heterogeneity among cancer stem cells in head and neck squamous cell carcinoma revealed by single-cell sequencing

Mintao Xiao et al. Front Immunol. .

Abstract

Background: Cancer stem cells (CSCs) have been characterized to be responsible for multidrug resistance, metastasis, recurrence, and immunosuppressive in head and neck squamous cell carcinoma (HNSCC). However, the diversity of CSCs remains to be investigated. In this study, we aimed to determine the heterogeneity of CSCs and its effect on the formation of tumor microenvironment (TME).

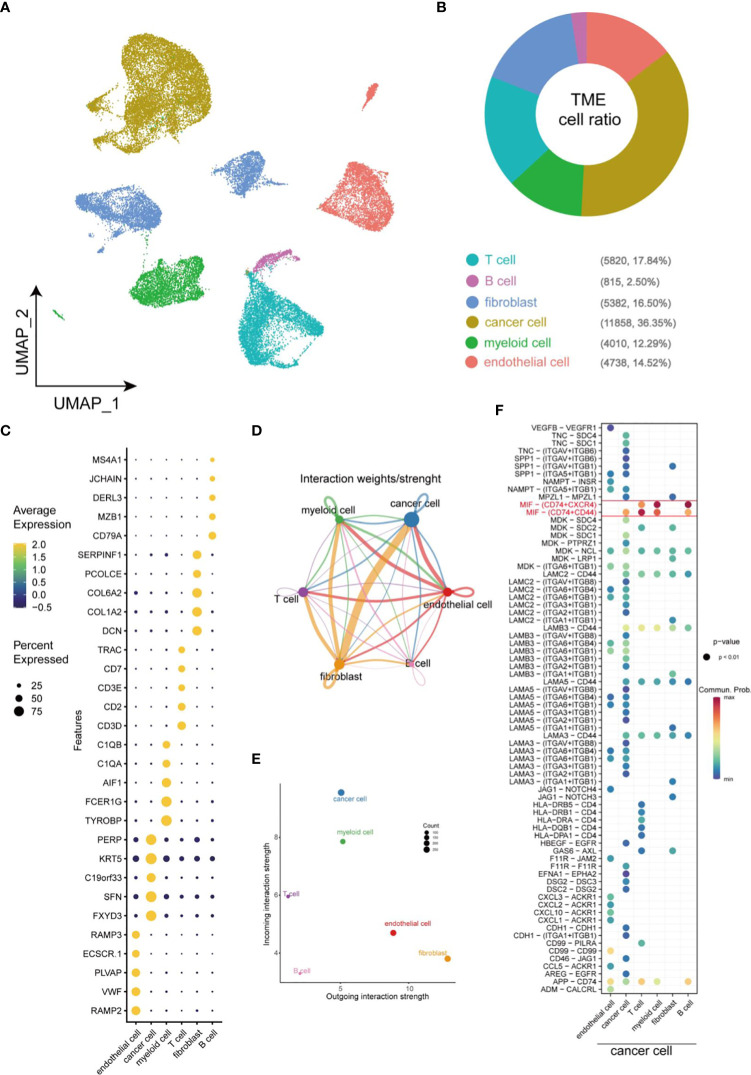
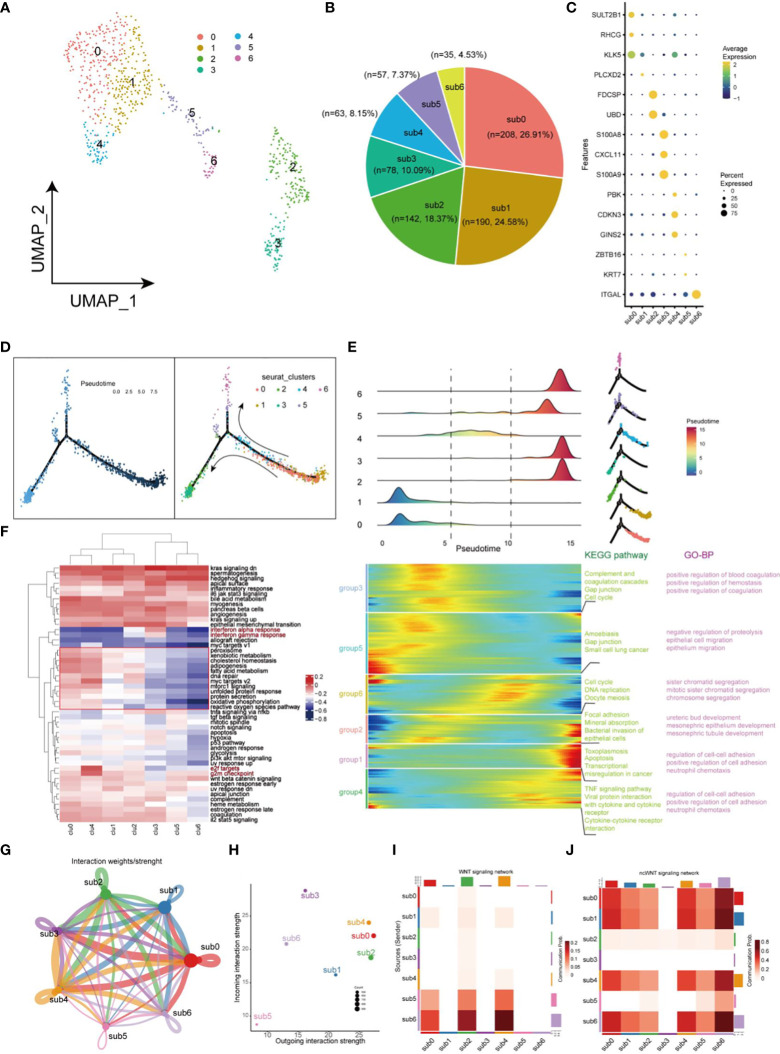
Methods: We depicted the landscape of HNSCC transcriptome profile by single-cell RNA-sequencing analysis of 20 HNSCC tissues from public databases, to reveal the Cell components, trajectory changes, signaling network, malignancy status and functional enrichment of CSCs within tumors.

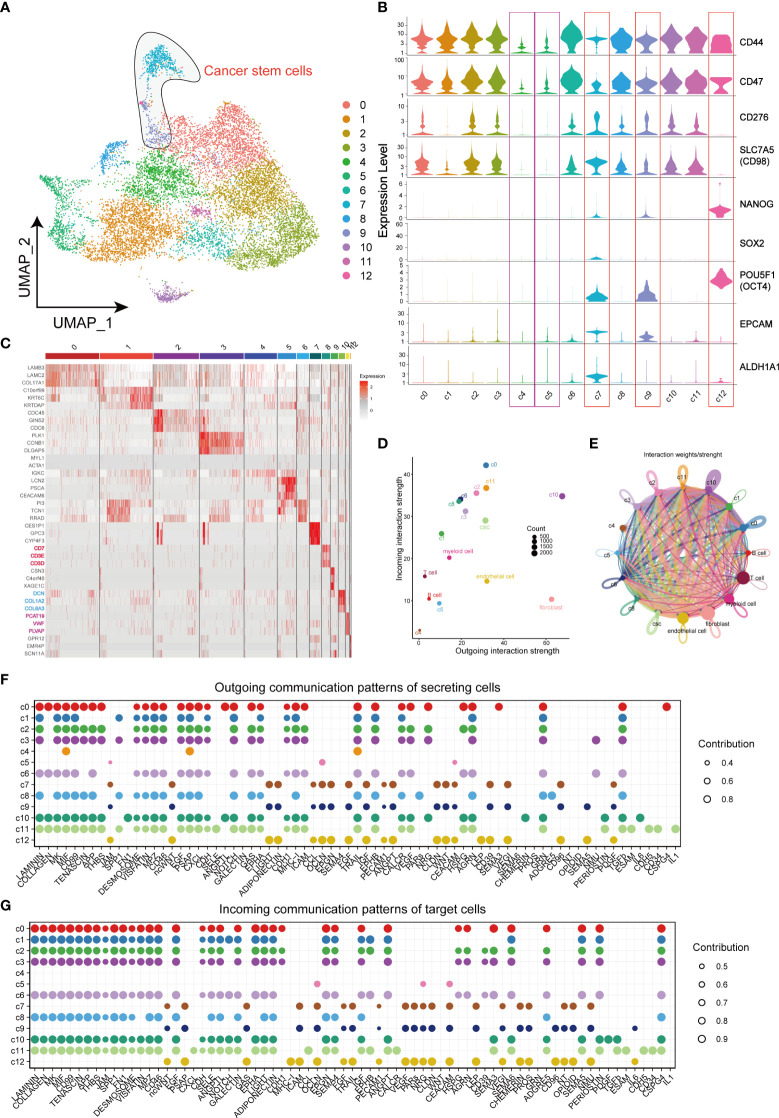
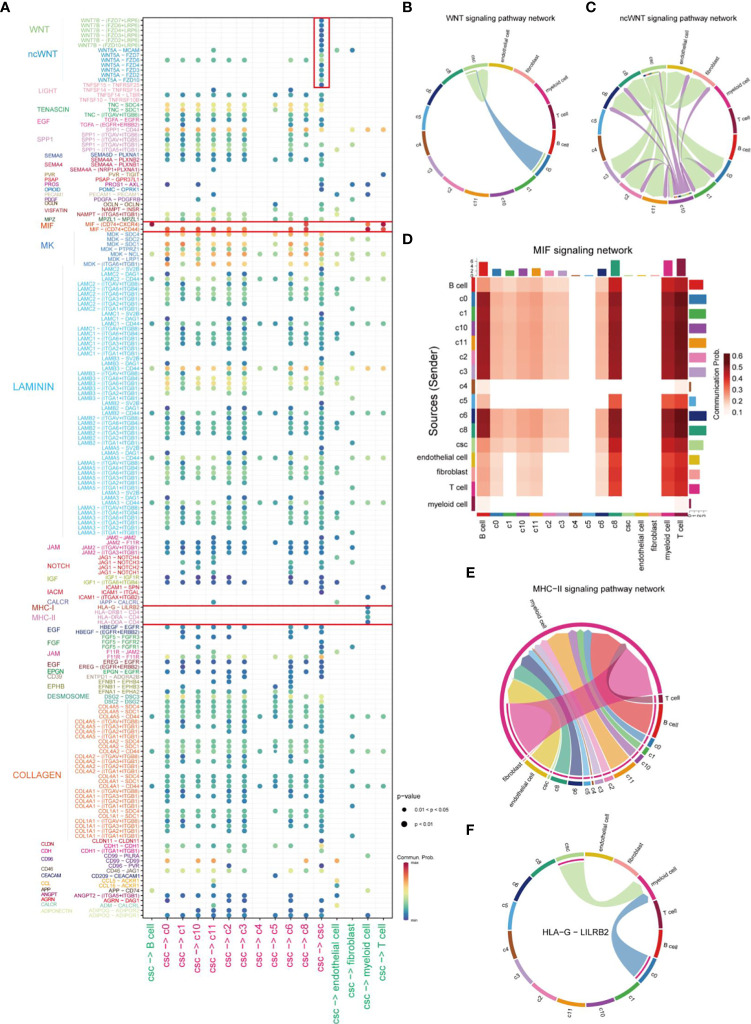
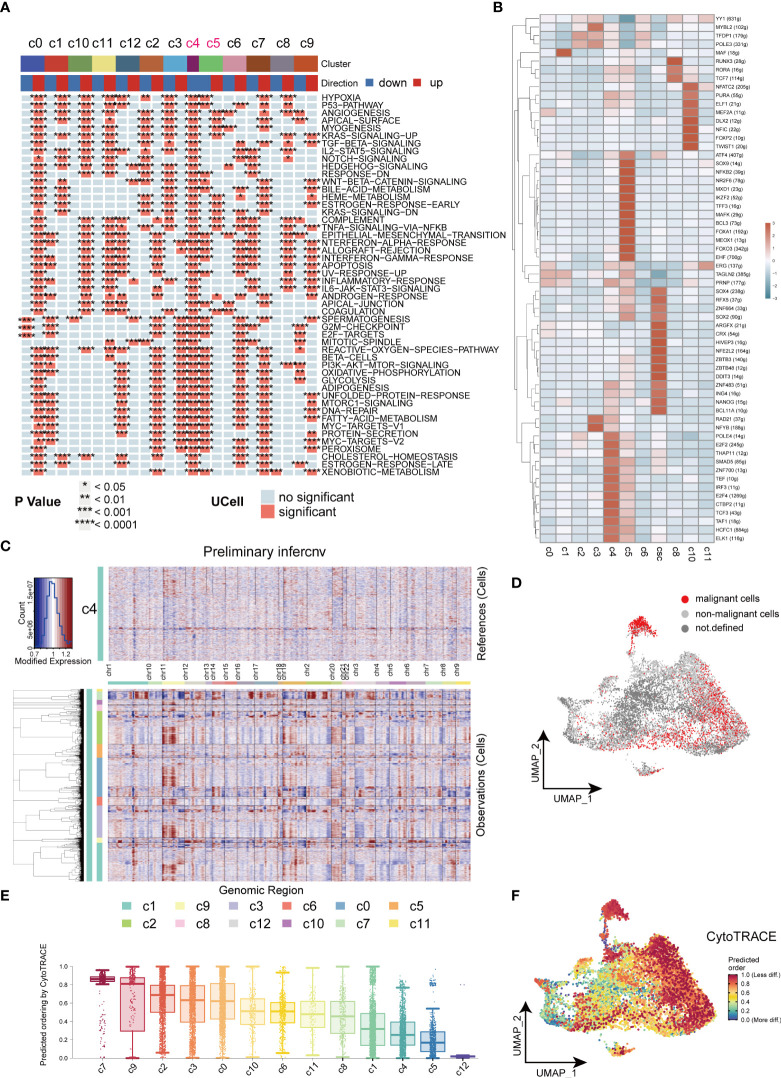
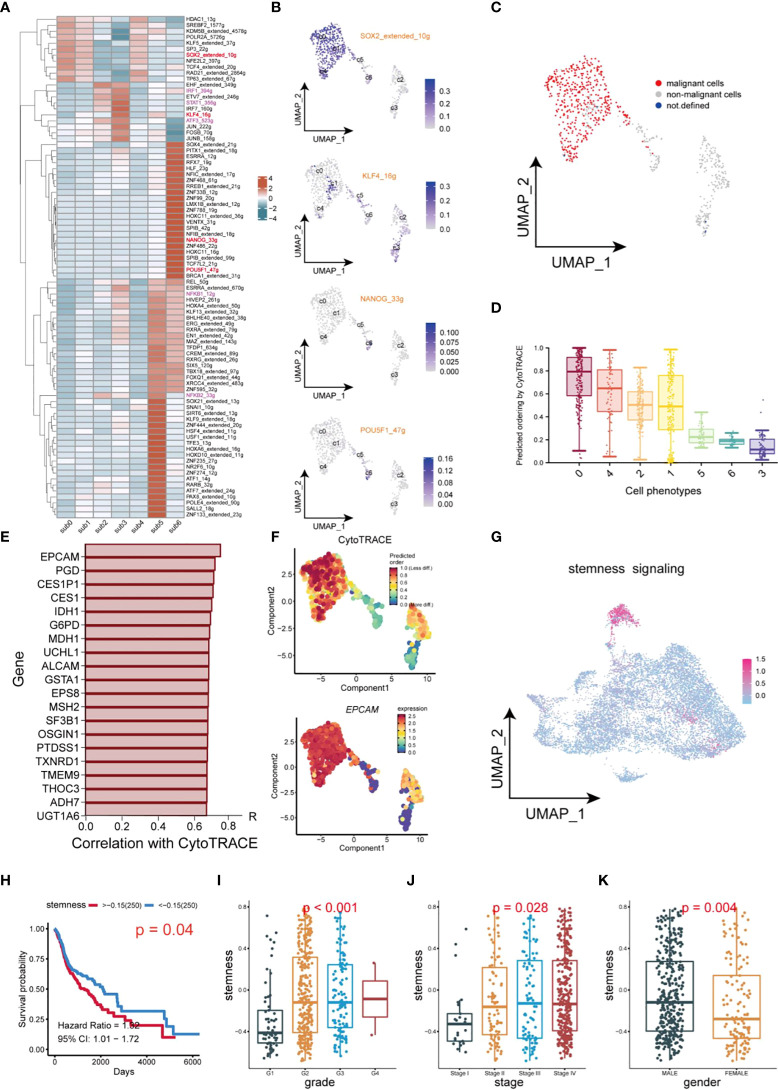
Results: Immune checkpoint molecules CD276, LILRB2, CD47 were significantly upregulated in CSCs, enabling host antitumor response to be weakened or damaged. Notably, naive CSCs were divided to 2 different types of cells with different functions, exhibiting functional diversity. In addition, CSCs underwent self-renewal and tumor metastasis activity through WNT and ncWNT signaling. Among them, Regulon regulators (IRF1_394g, IRF7_160g, NFKB1_12g, NFKB2_33g and STAT1_356g) were activated in subgroups 2 and 3, suggesting their pivotal roles in the inflammatory response process in tumors. Among all CSCs, naive CSCs appear to be the most malignant resulting in a worse prognosis.

Conclusions: Our study reveals the major signal transduction and biological function of CSCs during HNSCC progression, highlighting the heterogeneity of CSCs and their underlying mechanisms in the formation of an immunosuppressive TME. Therefore, our study about heterogeneity of CSCs in HNSCC can bring new insights for the treatment of HNSCC.

Keywords: WNT signaling pathway; cancer stem cell; head and neck squamous cell carcinoma; prognosis; single-cell sequencing.


Conflict of interest statement

The authors declare that the research was conducted in the absence of any commercial or financial relationships that could be construed as a potential conflict of interest.

Figures

Figure 1
Figure 1
Overview of cellular heterogeneity of integrated single-cell expression profiling in HNSCC. (A) UMAP plot of 33623 cells in HNSCC. (B) Pie chart of the proportion of 6 types of cells in HNSCC. (C) Bubble plot of the top five highest expressed genes within 6 types of cells in HNSCC. The size of bubble represents the percentage of gene expression in the relevant cell types. (D) Weights/Strength of cell-cell interaction between different types of cells within HNSCC. (E) Output/input interaction strength of different types of cells within HNSCC. (F) Ligand-Receptor pairs between cancer cells and other cells in TME.
Figure 2
Figure 2
Landscape of characteristics of different clusters in cancer cells characterized by single-cell transcriptomic sequencing. (A) UMAP plot of 11858 cells in subgroup of cancer cells. (B) Violin plots of gene expression patterns of 13 cluster of cells types in subgroup of cancer cells. (C) Heatmap of the top three highest genes within 13 clusters of cancer cells. (D) Output/input interaction strength of different clusters of cancer cells and other types of cells in TME. (E) Weights/Strength of cell-cell interaction between different cell clusters of cancer cells. (F) Outgoing communication patterns of secreting cells. (G) Incoming communication patterns of secreting cells. Bubble size represents the strength of the signal.
Figure 3
Figure 3
Comprehensive analysis of cell-cell interactions in HNSCC. (A) Ligand-receptor pair association analysis of cellular-cell interaction between CSC and other cells in HNSCC. (B) Plot of cells which interacted via WNT signaling pathways in HNSCC. (C) Plot of cells which interacted via ncWNT signaling pathways in HNSCC. (D) Cells involved in MIF signaling networks in HNSCC. (E) Plot of cells which interacted via MHC-II signaling networks in HNSCC. (F) Signal transduction of HLA-G-LILBR2 receptor-ligand pair of HLA signal in HNSCC.
Figure 4
Figure 4
Heterogeneity in HNSCC. (A) Heatmap of cancer related signaling pathways enriched in different types of cell clusters (Hallmark gene set). (B) Heatmap of expressions of different transcription factors in cells of HNSCC. (C) Heatmap of the visualized inferCNV analysis. (D) UMAP plot of distribution of non-malignant cells in cancer cells. (E) Box plots of stemness among all the clusters in cancer cells. (F) UMAP plots of intensity of stemness in cancer cells. *P < 0.05, **P < 0.01, ***P < 0.001, ****P < 0.0001.
Figure 5
Figure 5
Landscape of characteristics of CSCs characterized by single-cell transcriptomic sequencing. (A) UMAP plot of 773 cells in CSCs. (B) Pie chart of the proportion of 7 types of cells in CSCs. (C) Bubble plot of the highest expressed genes within 7 types of cells in CSCs. The size of the dot represents the percentage of gene expression in the cell. (D) Pseudotime ordering of CSCs. The graph on the left is labeled with developmental time, while the graph on the right is labeled with cell state. (E) Plot of clustering of DEGs identified by the pseudo-temporal progression in CSCs. (F) Heatmap of 50 cancer-related pathways in 7 CSCs subsets using GSVA. (G) Weights/Strength of cell-cell interaction within 7 CSCs subsets. (H) Strength of output/input interaction in different CSCs subsets. (I) Plot of cells which interacted via WNT signaling pathways in CSCs. (J) Plot of cells which interacted via ncWNT signaling pathways in CSCs.
Figure 6
Figure 6
Transcription factor identification and stemness assessment in CSCs. (A) Heatmap of expression of transcription factors in different subsets of CSCs. (B) UMAP plot of distribution of SOX2, KLF4, NANOG, OCT4 (POU5F) in different subsets of CSCs. (C) UMAP plot of distribution of malignant cells and non-malignant cells in CSCs. (D) Box plots of stemness. (E) Top 20 genes which are positive correlation with CytoTRACE. (F) UMAP plot of intensity of stemness in different subsets of CSCs. (G) UMAP plot of distribution of stemness signals in cancer cells. (H) Plot of Kaplan-Meier survival analysis. (I–K) Box plot of analysis of the differences in stemness levels between different clinical parameters.

Similar articles

Cited by

References

    1. Cai Z, Tang B, Chen L, Lei W. Mast cell marker gene signature in head and neck squamous cell carcinoma. BMC Cancer (2022) 22(1):577. doi: 10.1186/s12885-022-09673-3 - DOI - PMC - PubMed
    1. Zhao X, Chen H, Qiu Y, Cui L. FAM64A promotes HNSCC tumorigenesis by mediating transcriptional autoregulation of FOXM1. Int J Oral Sci (2022) 14(1):25. doi: 10.1038/s41368-022-00174-4 - DOI - PMC - PubMed
    1. Johnson DE, Burtness B, Leemans CR, Lui VWY, Bauman JE, Grandis JR. Head and neck squamous cell carcinoma. Nat Rev Dis Primers (2020) 6(1):92. doi: 10.1038/s41572-020-00224-3 - DOI - PMC - PubMed
    1. Zhang G, Zhao X, Liu W. NEDD4L inhibits glycolysis and proliferation of cancer cells in oral squamous cell carcinoma by inducing ENO1 ubiquitination and degradation. Cancer Biol Ther (2022) 23(1):243–53. doi: 10.1080/15384047.2022.2054244 - DOI - PMC - PubMed
    1. Porcheri C, Mitsiadis TA. New scenarios in pharmacological treatments of head and neck squamous cell carcinomas. Cancers (Basel) (2021) 13(21):5515. doi: 10.3390/cancers13215515 - DOI - PMC - PubMed

Publication types

MeSH terms