. 2022 Nov 14:13:1034420.
doi: 10.3389/fimmu.2022.1034420. eCollection 2022.

Burn-injured skin is marked by a prolonged local acute inflammatory response of innate immune cells and pro-inflammatory cytokines

Affiliations

Burn-injured skin is marked by a prolonged local acute inflammatory response of innate immune cells and pro-inflammatory cytokines

Patrick P G Mulder et al. Front Immunol. .

Abstract

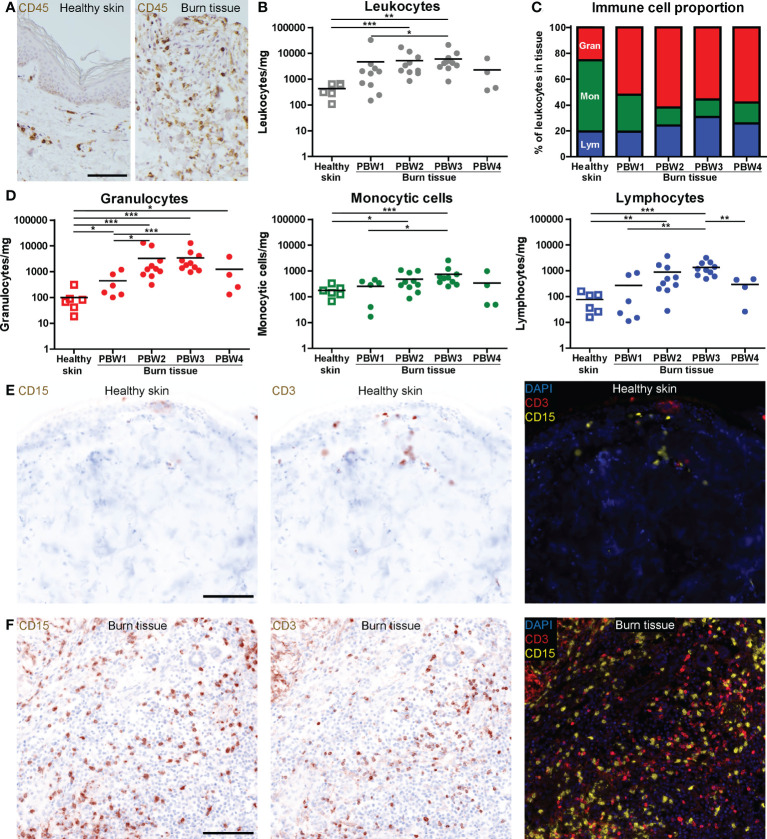
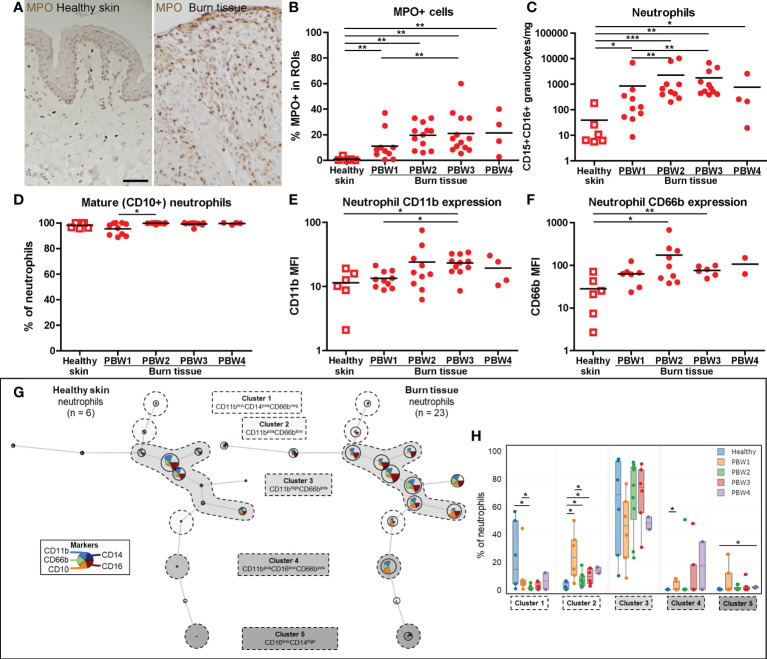
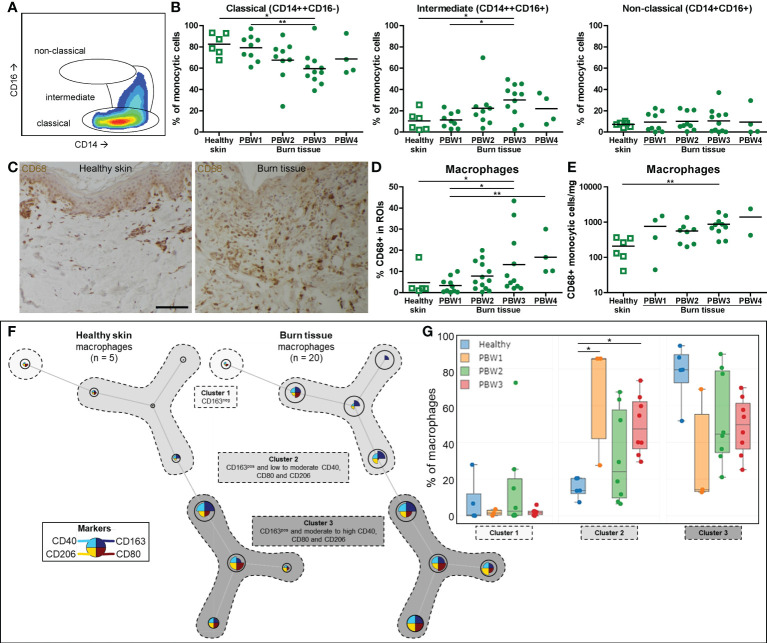
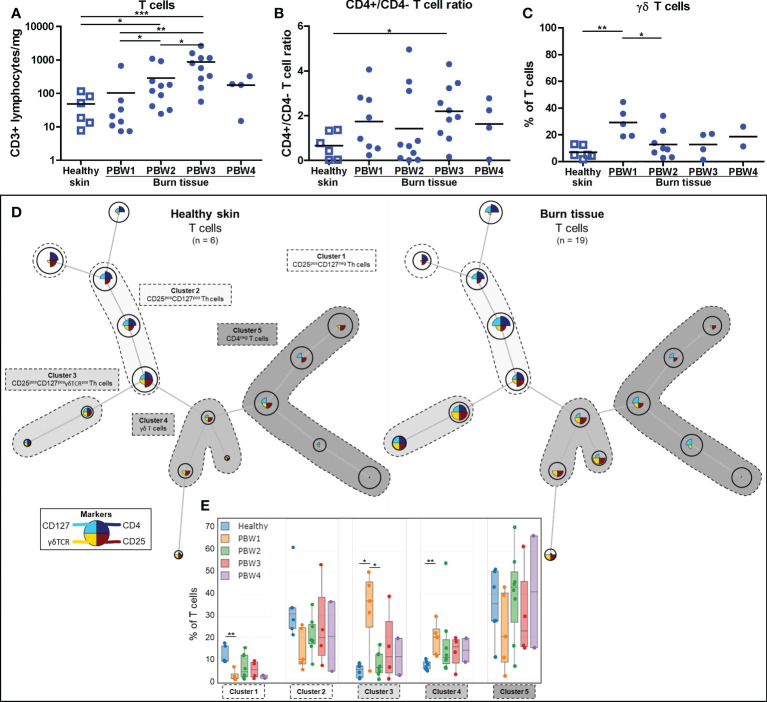
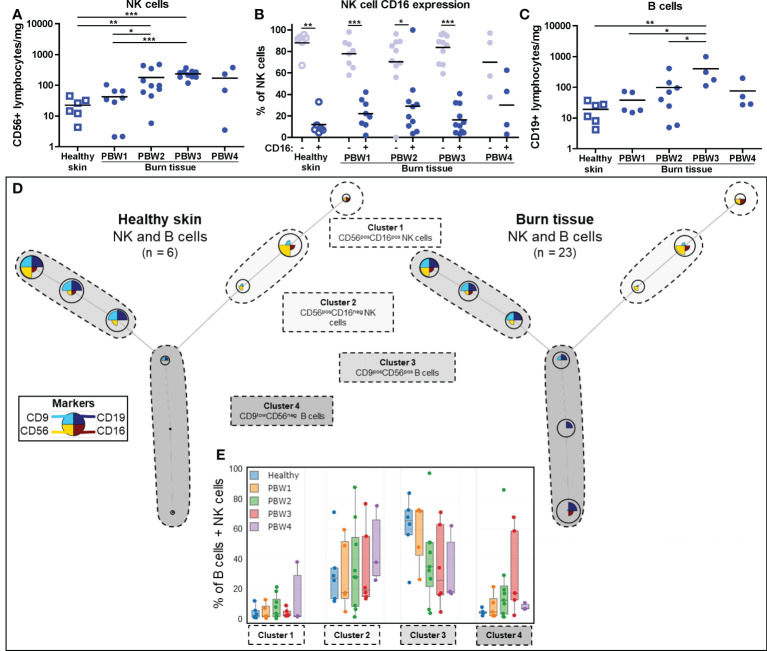
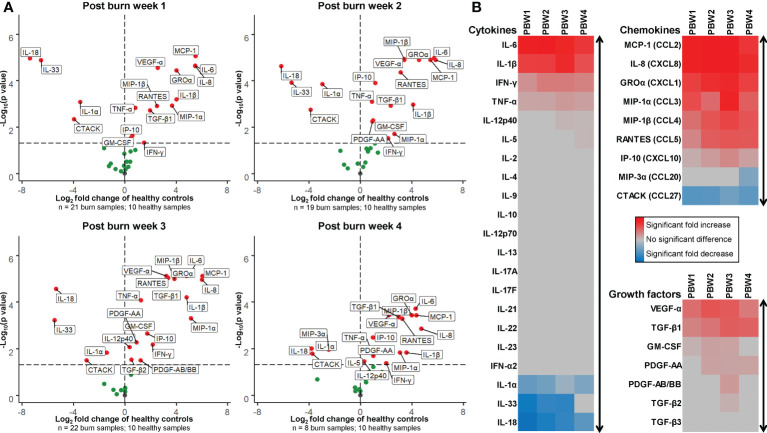
The systemic and local immune response in burn patients is often extreme and derailed. As excessive inflammation can damage healthy tissues and slow down the healing process, modulation of inflammatory responses could limit complications and improve recovery. Due to its complexity, more detailed information on the immune effects of thermal injury is needed to improve patient outcomes. We therefore characterized and quantified subsets of immune cells and mediators present in human burn wound tissue (eschar), sampled at various time points. This study shows that after burn injury, the number of immune cells were persistently increased, unlike the normal wound healing process. There was an immediate, strong increase in neutrophils and a moderate increase in monocytes/macrophages and lymphocytes, especially in the second and third week post burn. The percentage of classical (CD14highCD16-) monocytes/macrophages demonstrated a steady decrease over time, whereas the proportion of intermediate (CD14highCD16+) monocytes/macrophages slowly increased. The absolute numbers of T cells, NK cells and B cells increased up to week 3, while the fraction of γδ T cells was increased only in week 1. Secretome profiling revealed high levels of chemokines and an overall pro-inflammatory cytokine milieu in burn tissue. The local burn immune response shows similarities to the systemic immune reaction, but differs in neutrophil maturity and lymphocyte composition. Altogether, the neutrophil surges, high levels of pro-inflammatory cytokines and limited immunosuppression might be key factors that prolong the inflammation phase and delay the wound healing process in burns.

Keywords: burn wound tissue; cell isolation; flow cytometry; immune cells; inflammation; lymphocytes; macrophages; neutrophils.


Conflict of interest statement

The authors declare that the research was conducted in the absence of any commercial or financial relationships that could be construed as a potential conflict of interest.

Figures

Figure 1
Figure 1
High number of immune cells infiltrate the skin as response to burn injury. (A) CD45 immunohistochemical DAB staining of a representative section of healthy skin and burn tissue (from 15 days post burn) (black scale bar = 100 µm). Flow cytometry-based quantification of: (B) Absolute number of leukocytes per mg tissue (based on side scatter and CD45); (C) Proportion of granulocytes (Gran), monocytic cells (Mon) and lymphocytes (Lym) in tissue (based on side scatter and CD45); (D) Absolute numbers of granulocytes, monocytic cells and lymphocytes per mg tissue (based on side scatter and CD45). Microscopic image of multiplex DAPI, CD15 (granulocytes) and CD3 (T cells) staining of a representative: (E) Healthy skin sample; (F) Burn tissue sample (from 25 days post burn), shown separately and as composite (black scale bar = 100 µm). P values were calculated using Mann-Whitney U statistical tests, significant differences are indicated by black asterisks: *p < 0.05; **p < 0.01; ***p < 0.001.
Figure 2
Figure 2
Local neutrophil response to burn injury. (A) Myeloperoxidase (MPO) immunohistochemical DAB staining of a representative section of healthy skin and burn tissue (from 15 days post burn) (black scale bar = 100 µm). (B) MPO+ area of tissue sections. Flow cytometry-based quantification of: (C) Absolute number of neutrophils (CD15+CD16+ granulocytes) per mg tissue; (D) Percentage of CD10+ (mature) neutrophils (CD15+CD16+ granulocytes); (E) MFI of CD11b on neutrophils (CD15+CD16+ granulocytes) in tissue; (F) MFI of CD66b on neutrophils (CD15+CD16+ granulocytes) in tissue. (G) Unsupervised clustering of neutrophil (CD15+CD16+ granulocytes) flow data from healthy skin and burn tissue, 5 clusters are highlighted. Node size represents relative size of population and node diagram shows expression level of markers. (H) Percentage of neutrophils within each cluster. Error bars in H show boxplot, p values were calculated using Mann-Whitney U statistical tests, significant differences are indicated by black asterisks: *p < 0.05; **p < 0.01; ***p < 0.001.
Figure 3
Figure 3
Local macrophage response to burn injury. (A) Flow cytometry gating strategy for detection of differentiation stages of monocytic cells (classical, intermediate or non-classical, as based on CD14 and CD16). (B) Flow cytometry-based quantification of percentage of monocytic cells within classical, intermediate, non-classical gates. (C) CD68 immunohistochemical DAB staining of a representative section of healthy skin and burn tissue (from 15 days post burn) (black scale bar = 100 µm). (D) CD68+ area of tissue sections. (E) Flow cytometry-based quantification of absolute number of macrophages (CD68+ monocytic cells) per mg tissue. (F) Unsupervised clustering of macrophages (CD68+ monocytic cells) in healthy skin and burn tissue, 3 clusters are highlighted. Node size represents relative size of population and node diagram shows expression level of markers. (G) Percentage of macrophages (CD68+ monocytic cells) within each cluster. Error bars in G show boxplot, p values were calculated using Mann-Whitney U statistical tests, significant differences are indicated by black asterisks: *p < 0.05; **p < 0.01.
Figure 4
Figure 4
Local T cell response to burn injury. Flow cytometry-based quantification of: (A) Absolute number of T cells (CD3+ lymphocytes) per mg tissue; (B) CD4+/CD4- T cell (CD3+ lymphocytes) ratio in tissue; (C) Percentage of T cells (CD3+ lymphocytes) that are γδ T cells (γδTCR+CD4- T cells). (D) Unsupervised clustering of T cells (CD3+ lymphocytes) in healthy skin and burn tissue, 5 clusters are highlighted. Node size represents relative size of population and node diagram shows expression level of markers. (E) Percentage of T cells within each cluster. Error bars in E show boxplot, p values were calculated using Mann-Whitney U statistical tests, significant differences are indicated by black asterisks: *p < 0.05; **p < 0.01; ***p < 0.001.
Figure 5
Figure 5
Local NK and B cell response to burn injury. Flow cytometry-based quantification of: (A) Absolute number of NK cells (CD56+ lymphocytes) per mg tissue; (B) Percentage of NK cells that are CD16- and CD16+; (C) Absolute number of B cells (CD19+ lymphocytes) per mg tissue. (D) Unsupervised clustering of NK and B cells in healthy skin and burn tissue, 4 clusters are highlighted. Node size represents relative size of population and node diagram shows expression level of markers. (E) Percentage of NK or B cells within each cluster. Error bars in E show boxplot, p values were calculated using Mann-Whitney U statistical tests, significant differences are indicated by black asterisks: *p < 0.05; **p < 0.01; ***p < 0.001.
Figure 6
Figure 6
Expression of cytokines, chemokines and growth factors in burn tissue. (A) Volcano plot visualization of the expression of soluble factors in burn tissue from 1, 2, 3 and 4 weeks post burn injury. Dots represent soluble factors in burn tissue as Log2 fold change as found in healthy skin controls. Factors with a statistically significantly different expression (p < 0.05) are labeled (values above the black striped line). (B) Heatmap visualization of fold increase/decrease of soluble factors in burn tissue compared to healthy skin, categorized by cytokines, chemokines and growth factors. P values were calculated using Mann-Whitney U statistical tests.

References

    1. Witte MB, Barbul A. General principles of wound healing. Surg Clin North Am (1997) 77:509–28. doi: 10.1016/S0039-6109(05)70566-1 - DOI - PubMed
    1. Dahiya P. Burns as a model of SIRS. Front Biosci (2009) 14:4962–7. doi: 10.2741/3580 - DOI - PubMed
    1. Bergquist M, Hästbacka J, Glaumann C, Freden F, Huss F, Lipcsey M. The time-course of the inflammatory response to major burn injury and its relation to organ failure and outcome. Burns (2019) 45:354–63. doi: 10.1016/j.burns.2018.09.001 - DOI - PubMed
    1. Wu G, Zhuang M, Jiang Y, Fan J, Sun Y, Zhou Z, et al. Can systemic inflammatory response syndrome score at admission predict clinical outcome in patients with severe burns? Burns (2019) 45:860–8. doi: 10.1016/j.burns.2018.11.011 - DOI - PubMed
    1. Farina JA, Rosique MJ, Rosique RG. Curbing inflammation in burn patients. Int J Inflam (2013) 2013:1–9. doi: 10.1155/2013/715645 - DOI - PMC - PubMed

Publication types