. 2022 Nov 14;12(18):7775-7787.
doi: 10.7150/thno.76805. eCollection 2022.

Hydroxyurea ameliorates atherosclerosis in ApoE-/- mice by potentially modulating Niemann-Pick C1-like 1 protein through the gut microbiota

Affiliations

Hydroxyurea ameliorates atherosclerosis in ApoE-/- mice by potentially modulating Niemann-Pick C1-like 1 protein through the gut microbiota

Xin-Yu Yang et al. Theranostics. .

Abstract

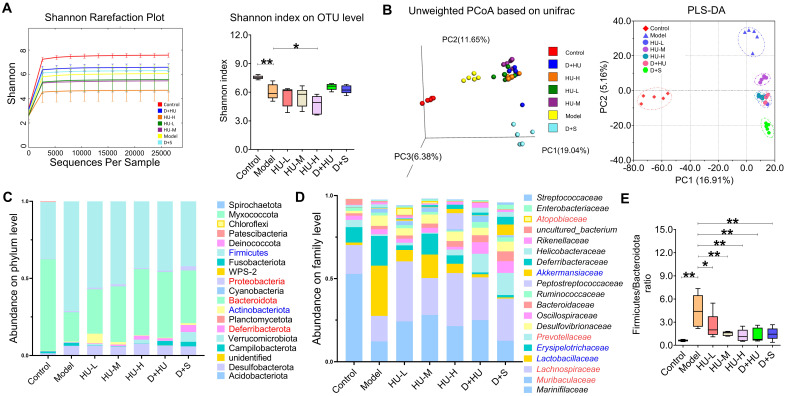
Rationale: The efficacy and mechanism of hydroxyurea in the treatment of atherosclerosis have rarely been reported. The goal of this study was to investigate the efficacy of hydroxyurea in high-fat diet-fed ApoE-/- mice against atherosclerosis and examine the possible mechanism underlying treatment outcomes. Methods: ApoE-/- mice were fed a high-fat diet for 1 month and then administered hydroxyurea by gavage continuously for 2 months. Aortic root hematoxylin-eosin (H&E) staining and oil red O staining were used to verify the efficacy of hydroxyurea; biochemical methods and ELISA were used to detect changes in relevant metabolites in serum. 16S rRNA was used to detect composition changes in the intestinal bacterial community of animals after treatment with hydroxyurea. Metabolomics methods were used to identify fecal metabolites and their changes. Immunohistochemical staining and ELISA were used for the localization and quantification of intestinal NPC1L1. Results: We showed that aortic root HE staining and oil red O staining determined the therapeutic efficacy of hydroxyurea in the treatment of atherosclerosis in high-fat diet-fed ApoE-/- mice. Serological tests verified the ability of hydroxyurea to lower total serum cholesterol and LDL cholesterol. The gut microbiota was significantly altered after HU treatment and was significantly different from that after antiplatelet and statin therapy. Meanwhile, a metabolomic study revealed that metabolites, including stearic acid, palmitic acid and cholesterol, were significantly enriched in mouse feces. Further histological and ELISAs verified that the protein responsible for intestinal absorption of cholesterol in mice, NPC1L1, was significantly reduced after hydroxyurea treatment. Conclusions: In high-fat diet-fed ApoE-/- mice, hydroxyurea effectively treated atherosclerosis, lowered serum cholesterol, modulated the gut microbiota at multiple levels and affected cholesterol absorption by reducing NPC1L1 in small intestinal epithelial cells.

Keywords: Atherosclerosis; Gut microbiota; Hydroxyurea; Lipid metabolism; NPC1L1.


Conflict of interest statement

Competing Interests: The authors have declared that no competing interest exists.

Figures

Figure 1
Figure 1
Experimental design and general condition monitoring during the experimental period (TG: triglycerides; LDL-C: low-density lipoprotein cholesterol; TC: total cholesterol; Glu: glucose; IL-1β: interleukin-1β; IL-6, interleukin-6; TNF-ɑ, tumor necrosis factor-ɑ; ox-LDL: oxidatively modified low-density lipoprotein; LDL-C: low-density lipoprotein cholesterol; LDLR: low density lipoprotein receptor; SREBP2, Sterol-regulatory element binding proteins 2; HFD: high fat diet; H&E: hematoxylin-eosin).
Figure 2
Figure 2
Histological changes in aortic atherosclerotic plaques and changes in serum glucose and lipid metabolism and inflammatory parameters in various groups of mice. (A) Aortic H&E staining and oil red O staining of each group (scale bars represent 100 um). The red arrow indicates atherosclerosis; (B) corrected plaque areas of atherosclerosis (%); (C) lipid, glucose and inflammatory factor levels after two months of drug administration. (n = 7, *: compared to the model group, ***P < 0.001, ** P < 0.01, * P < 0.05) (H&E: hematoxylin-eosin; Glu: glucose; IL-β: interleukin-β; TC: total cholesterol; LDL-C: low-density lipoprotein cholesterol; TG, total triglyceride).
Figure 3
Figure 3
Microbiota diversity analysis at different levels. (A) Multisample Shannon-Wiener curves and Shannon index of each group at the OTU level; (B) PCoA and PLS-DA model summarizing the distribution of samples; (C) community analysis based on the phylum level; (D) community analysis based on the family level; (E) Firmicutes/Bacteroidetes ratio. (n = 5, *: compared to the model group, **P < 0.01, *P < 0.05) (OTU: operational taxonomic unit; PCoA: principal co-ordinates analysis; PLS-DA: partial least-squares discrimination analysis).
Figure 4
Figure 4
Microbiota diversity analysis at the genus level. (A) Heatmap showing the top 50 genera; (B) analysis of bacterial strains at the genus level. (n = 5, *: compared to the model group, ***P < 0.001, **P < 0.01, *P < 0.05).
Figure 5
Figure 5
Metabolic profiling of fecal samples from each group. (A) 2D and 3D examples of PCA score plots summarizing the distribution of QCs and samples. (B) An OPLS-DA model showing the group separation between the control group and the model group. (C) Corresponding S-plot for feature selection. Each dot represents a feature, and the dots located in the upper right and lower left areas are the selected dots based on the criteria stated in the Methods section. (D) Heatmap showing metabolic features among each individual. (E) Box plot showing metabolic feature levels related to lipid metabolism and atherosclerosis among each group. Data represent the mean ± S.D. of 5 individuals in each group. (n = 5, *: compared to the model group, ***P < 0.001, **P < 0.01, *P < 0.05) (PCA: principal component analysis; QC: quality control; OPLS-DA: orthogonal partial least squares-discriminant analysis).
Figure 6
Figure 6
NPC1L1 alteration and correlation with intestinal bacteria between groups. (A) Representative H&E staining (scale bars represent 100 µm) and immunohistochemistry (scale bars represent 200 µm in the upper row and 50 µm in the lower row) of the small intestine of mice using an NPC1L1 antibody. (B) NPC1L1 levels in each group. (C-D) Correlation analysis between NPC1L1 and gut bacterial strains using Spearman's correlation (n = 5, *: compared to the model group, *P < 0.05) (NPC1L1: Niemann-Pick C1-like 1; H&E: hematoxylin-eosin; IHC: immunohistochemistry).

References

    1. Roth GA, Johnson C, Abajobir A, Abd-Allah F, Abera SF, Abyu G. et al. Global, Regional, and National Burden of Cardiovascular Diseases for 10 Causes, 1990 to 2015. Journal of the American College of Cardiology. 2017;70:1–25. - PMC - PubMed
    1. Herrington W, Lacey B, Sherliker P, Armitage J, Lewington S. Epidemiology of Atherosclerosis and the Potential to Reduce the Global Burden of Atherothrombotic Disease. Circ Res. 2016;118:535–46. - PubMed
    1. Falk E. Pathogenesis of Atherosclerosis. Journal of the American College of Cardiology. 2006;47:C7–12. - PubMed
    1. Jonsson AL, Bäckhed F. Role of gut microbiota in atherosclerosis. Nat Rev Cardiol. 2017;14:79–87. - PubMed
    1. Byrne RA, Colleran R. Aspirin for secondary prevention of cardiovascular disease. The Lancet. 2020;395:1462–3. - PubMed

Publication types