. 2022 Nov 7;12(18):7646-7667.
doi: 10.7150/thno.78454. eCollection 2022.

Janus USPION modular platform (JUMP) for theranostic ultrasound-mediated targeted intratumoral microvascular imaging and DNA/miRNA delivery

Affiliations

Janus USPION modular platform (JUMP) for theranostic ultrasound-mediated targeted intratumoral microvascular imaging and DNA/miRNA delivery

Ragnhild D Whitaker et al. Theranostics. .

Abstract

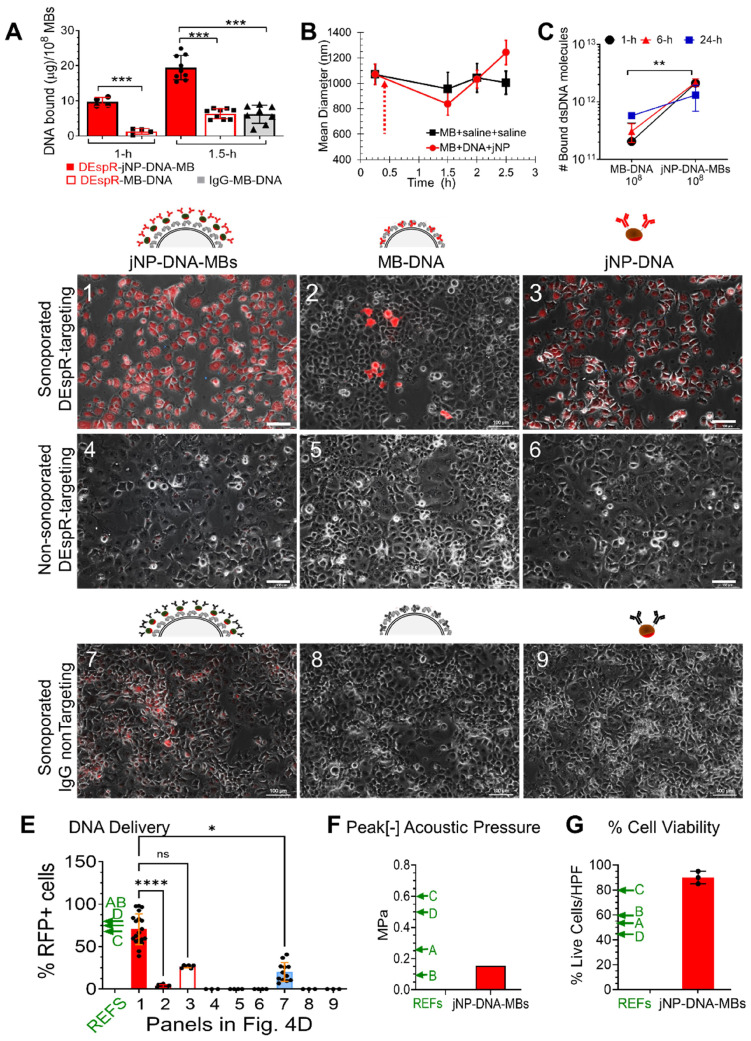
Rationale: High mortality in pancreatic cancer (PDAC) and triple negative breast cancer (TNBC) highlight the need to capitalize on nanoscale-design advantages for multifunctional diagnostics and therapies. DNA/RNA-therapies can provide potential breakthroughs, however, to date, there is no FDA-approved systemic delivery system to solid tumors. Methods: Here, we report a Janus-nanoparticle (jNP)-system with modular targeting, payload-delivery, and targeted-imaging capabilities. Our jNP-system consists of 10 nm ultrasmall superparamagnetic iron oxide nanoparticles (USPION) with opposing antibody-targeting and DNA/RNA payload-protecting faces, directionally self-assembled with commercially available zwitterionic microbubbles (MBs) and DNA/RNA payloads. Results: Sonoporation of targeted jNP-payload-MBs delivers functional reporter-DNA imparting tumor-fluorescence, and micro-RNA126 reducing non-druggable KRAS in PDAC-Panc1 and TNBC-MB231 xenografted tumors. The targeting jNP-system enhances ultrasound-imaging of intra-tumoral microvasculature using less MBs/body weight (BW). The jNP-design enhances USPION's T2*-magnetic resonance (MR) and MR-imaging of PDAC-peritoneal metastases using less Fe/BW. Conclusion: Altogether, data advance the asymmetric jNP-design as a potential theranostic Janus-USPION Modular Platform - a JUMP forward.

Keywords: Janus nanoparticle; Nanomedicine; USPION; modular nanotheranostics; nano-micro hybrid platform; nucleic acid delivery; pancreatic cancer.


Conflict of interest statement

Competing Interests: Awarded patents pertaining to the results presented in the paper: J.Y. Wong, R.D. Whitaker, N. Ruiz-Opazo, and V.L.M. Herrera, PCT Application No. PCT/US2016/018417, Theranostic compositions and uses thereof, International Filing Date: Feb 18, 2016 - Assigned U.S. Patent No. 10,568,970, ISSUED February 25, 2020. Boston University holds awarded and pending patents on DEspR (dual endothelin1/VEGFsp receptor). VLMH and NRO are co-inventors on DEspR patents filed by Boston University. All other authors declare they have no competing interests.

Figures

Figure 1
Figure 1
Conjugated layer-by-layer preparation and cryo-TEM/AFM imaging of Janus nanoparticles (jNPs). (A) Schematic diagram of directional layer-by-layer method to prepare jNPs. See Methods for detailed procedure. Layers are: 1: cationic polymer, PEI, adsorbed onto a mica sheet; 2: glutaraldehyde, conjugated to amines in the PEI layer; 3: Fe3O4 ~ 10 nm USPION with mixed partially amine-terminated PEG2K/3.4K brush (~ 5-8 nm) conjugated to glutaraldehyde layer; 4: maleimide layer from conversion of free amines on USPION core by N-hydroxy-succinimide maleimide (NHS-maleimide); 5: targeting antibodies (Ab) conjugated to layer-3 via NHS-maleimide linker (layer-4); 6: asymmetrically functionalized jNPs released from mica sheet with salt. (B) Differential zeta potential levels of partial jNP layered-composition stages with ultrasmall 10 nm SPION cores: uspion-peg, uspion-peg-nh2, uspion-peg-nh2-pei, and jNP; mean ± s.d., n = 7-11 replicates/group, each replicate = ~ 1010 NPs, three independent experiments, ANOVA * p < 0.05; ** p<0.01. (C) Fluorescence intensity levels, documenting conjugation of AF594-labeled antibodies (Ab) as final layer (jNP) and targeting-face of jNPs compared to uspion-peg-nh2-pei and water controls (mean ± s.d. of DLS readings from 1012 jNPs and USPION-PEG-NH2-PEI nanoparticles). ANOVA * p < 0.01. (D) Representative frequency plot of % of 1012 jNPs at specified hydrodynamic diameters (nm) obtained via dynamic light scattering (DLS) at time-0. (E) Representative cryo-TEM images of jNPs from two independent jNP preparations showing an asymmetric ~ 22-32 nm particle with an electro-dense USPION core closer to the PEI cationic carrier-face and targeting antibodies (~ 12 nm) comprising the opposing targeting-face. Scale bar = 20 nm. (F) Representative atomic force microscopy (AFM) multi-parameter images (amplitude, topography, and phase) of individual jNPs. Scale bar = 50 nm.
Figure 2
Figure 2
In vitro characterization of jNPs. (A) Representative serum-stability time-course plot of hydrodynamic diameters (nm) of jNPs from 0-120 h in 75% serum, one way ANOVA P > 0.63. (B) Representative AFM amplitude and topography images taken of jNPs at t-1 h and t-24 h in 85% serum. Scale bar = 50 nm. (C) Ethidium bromide (EtBr) dye exclusion assay for different amounts of DNA (300, 100, and 50 ng RFP-minigene plasmid DNA) exposed to increasing amounts of jNPs (# of jNPs x 1010) for 10 min incubation. Level of free DNA available for EtBr intercalation defines unbound or unprotected by jNPs, is indicated by level of EtBr fluorescence intensity (arbitrary units, AU) emitted from EtBr upon intercalation into free DNA. Fluorescence (Ex. 260/Em.590 nm) at 10 min done in duplicate; highest jNP point in triplicate. Agarose gel analysis of EtBr fluorescence after intercalation into 'free' RFP plasmid 4.7 kb DNA (black arrow). Lanes 1-4, increasing (0, 0.2, 0.6, 1.8 x 10¹⁰) jNPs added to 100 ng RFP-DNA for 10 min. MW, bands from 10, 8, 6, 5, 4, 3, and 2 kb DNA markers. (D) Graph of jNP dose-dependent displacement of fluorescent DNA-intercalated EtBr. Two amounts of DNA were tested: 100 ng, and 250 ng. jNPs from 0 - 1.75 x 10¹² nps were used to test dose-dependent displacement of EtBr by jNPs. (E) Graph of in vitro testing of jNPs triggering complement activation. Using amounts that span levels of jNPs used in vivo ~ 1011 jNPs/mL plasma, jNPs at 1010/mL up to 1013 jNPs/mL were tested for complement activation by measuring levels of terminal complex SC5b-9 compared to human plasma control with no jNPs. (F) Comparison of DNA-binding and protection from EtBr intercalation by jNP compared with pertinent controls: PEG-np (PEG-SPION core), PEI-np (PEG-np with conjugated PEI-face), IgG-np (isotype IgG antibody layer surrounds PEG-SPION core, no conjugated PEI-face) at 2 time points: 10 min (10'), 30 min (30'). Diagrams depict respective NP design. Data presented as mean ± s.d., Kruskal Wallis with Dunn's multiple comparison pairwise testing: (*, p < 0.05; **, p < 0.001), 300 ng DNA/1010 jNPs, n = 3 independent experiments. (G) Comparison of complement activation in vitro of jNPs compared with pertinent controls: human normal plasma with no NPs, PEG-np, PEI-np, and IgG-np identical to that used in Figure 2F. One-way ANOVA with Dunnett's multiple pair-wise comparison for jNP and IgG-np: *, p < 0.05, n = 8-9/group, 5 groups, each group with 1012 nanoparticles.
Figure 3
Figure 3
In vitro analysis of Janus nanoparticle (jNP) targeting and carrier functions. (A) Schematic diagram of stepwise self-assembly and directional orientation of jNPs on 1 µm diameter microbubbles (MB) with zeta potential average -3.2 ± 0.4, forming jNP-DNA-MBs with tunable amount of jNPs added per MB (e.g., 1 x 10⁴ or 5 x 10⁴ jNPs/MB). DEspR-jNP, targeting jNP via anti-DEspR antibody face; IgG-jNP, control non-targeting with isotype IgG targeting face. (B) Representative flow cytometry analysis of double-fluorescent jNP-DNA-MBs distinguished from single-fluorescent and non-fluorescent MBs, using 5 x 10² jNPs/MB. Y-axis: red-fluorescence intensity; X-axis, green-fluorescence; Control-1: non-fluorescent microbubbles (MBs) in quadrant 4 (Q4), red-fluorophore labeled jNPs (jNP), green-fluorophore labeled single strand 50-nt oligoDNA (DNA); 4-quadrants with differential fluorescence attained by MBs: ± bound DNA, ± bound jNPs: Q1-Q4. (C) Representative flow cytometry analysis of jNP-DNA-MB assembly: Y-axis, fluorescence intensity of jNPs with fluorescent antibody layer; X-axis, forward scatter representing size. Left-panel: non-fluorescent microbubbles (MB); Middle-panel: fluorescent jNP-DNA-MBs with 103 jNPs/MB; Right panel: fluorescent jNP-DNA-MBs with 5 x 10⁴ jNPs/MB. Fluorescence intensity > 103 above red horizontal line. (D) Contingency group analysis graph of jNP concentration-dependent self-assembly of jNP-DNA-MBs: fluorescent self-assembled jNP-DNA-MBs (solid red bars), non-fluorescent, non-assembled or free DNA-MBs (solid black bars); contingency chi square analysis, P < 0.0001. (E) Flow cytometry analysis of DEspR-targeting jNP-DNA-MBs binding to pancreatic tumor (Panc1) cells using different cell-to-[jNP-DNA-MB] ratios, X-axis: size indicator forward scatter area. Control-1, non-fluorescent MB only, Y-axis: side scatter granularity. Control-2, red-fluorescently labeled jNP-DNA-MBs only; Control-3: panc1 tumor cells only; cell-complex formation with 1:1 ratio of Panc1 cells to DEspR-targeting jNP-DNA-MBs; and with 1:5 cell-complex ratio using 1 x 10⁴ DEspR-targeting jNP-DNA-MBs (panels with Y-axis: fluorescence intensity of jNPs from labeled antibody layer). Free jNPs gated (dashed red triangle with corresponding % in dashed rectangle); free cells below the red horizontal line; jNP-DNA-MB bound cells: fluorescent = above red line. (F) Contingency group analysis graph of flow cytometry results comparing % bound vs % free cells exposed to jNP-DNA-MBs at 0, 1:1, and 1:5 ratio of cells-to-jNP-DNA-MBs: % bound cells (solid red bars jNP-MB[+]), and % free cells (solid black bars). Chi square analysis, n = 5000 cells, P < 0.0001. (G) Representative fluorescence microscopy images of a Panc1 tumor cell with multiple bound jNP-DNA-MBs (~ 1 µm diameter MBs). Red: fluorescently-labeled jNP-DNA-MBs, blue: Hoechst nuclear stain, bar = 5 µm. (H) Contingency group analysis graph of % bound cells[+] with bound DEspR-targeting jNP-DNA-MBs (solid red bar DEspR-jNP[+]), or with non-specific bound non-targeting isotype (IgG) jNP-DNA-MBs (open red bar: IgG-jNP[+]); compared with free cells (solid black bar: DEspR-jNP[-] cells); open black bar: IgG-jNP[-] cells); contingency chi-square analysis: P < 0.0001; n = 80 cells exposed to DEspR jNP-DNA-MBs); n= 30 cells exposed to IgG jNP-DNA-MBs. (I) Comparison of cell-targeting showing maximum number (max #) of fluorescently labeled jNP-DNA-MBs bound to Panc1 tumor cells comparing DEspR-targeting jNP-DNA-MBs (solid red bar) vs isotype IgG non-targeting jNP-DNA-MBs. Mann Whitney test: P = 0.0006; DEspR-targeting (solid red bar) n = 14 cells; non-targeting IgG-isotype (open red bar) n = 6 cells (cells with no jNP-DNA-MBs excluded here).
Figure 4
Figure 4
Analysis of jNP-MB payload-binding, stability, and delivery functions. (A) Payload capacity measured as bound DNA (mg DNA/108 MBs) of self-assembled complexes at different durations (1 and 1.5 h) of incubation for self-assembly, data presented mean ± s.d. Solid red bar: DEspR-targeting jNP-DNA-MBs (108 MBs per replicate: n = 4 replicates from 1 MB batch at 1 h, n = 9 replicates, 3 MB batches at 1.5 h); open bar: control DEspR-targeting (biotin-avidin) “Target-ready" MB-DNA (n = 4 replicates from 1 Target-ready MB batch at 1 h, n = 9 replicates from 3 Target-ready MB batches at 1.5 h); Solid grey bar, control non-targeting IgG-MB-DNA (n = 8). ***, P < 0.0001, 1-way ANOVA with Tukey's multiple pairwise comparisons. (B) Size-stability over time of self-assembled jNP-DNA-MBs compared with MBs. Hydrodynamic diameters (nm) measured by dynamic light scattering. Solid red circles, jNP-DNA-MB (n = 3 replicates, each with 108 MBs); solid black squares, control MB-DNA (n = 3 replicates, each with 108 MBs). Dashed arrow marks time of addition of jNPs after reconstitution of lyophilized MBs per manufacturer's specifications. (C) DNA-binding stability of jNP-DNA-MBs (n = 2 aliquots from 4 self-assembled mixtures comprised of 108 MBs, 1012 jNPs, 30 μg DNA), vs control MB-DNA (n = 2 aliquots from 3 self-assembled mixtures, each with 108 MBs, 30 μg DNA) x 3 time points: 1, 6, and 24 h measured as bound double strand DNA molecules (dsDNA). Two-way ANOVA (jNP-DNA-MB x time): row factor: MB-DNA vs jNP-DNA-MB ** p = 0.0002; column factor: time n.s. (D) Representative microscopy images with identical photo-exposures comparing in vitro fluorescence resulting from successful transfection of intact payload: reporter minigene-DNA construct for red fluorescent protein (RFP) to Panc1 cells 48 h after exposure. Three constructs represented in diagrams: jNP-DNA-MBs, control MB-DNA and control jNP-DNA are tested in 3 conditions: row-1: sonoporation of DEspR-targeting constructs, row-2: non-sonoporated but DEspR-targeting; row-3: sonoporated but non-DEspR targeting (non-specific IgG instead of anti-DEspR antibody). Panels 1-9 represent Panc1 cells subjected to 3 x 3 permutations: 3 constructs x 3 conditions. Cells exhibiting RFP-positive expression fluoresce red. Bar = 100 µm; identical experimental conditions: ~ 1:5 cell:MB ratio, DNA-MB ratio (30 mg DNA/108 MBs); 104 jNPs/MB used for DEspR-targeting and isotype IgG-non-targeting jNP-DNA-MB complexes. (E) Bar graph of % RFP-positive cells in peak RFP+ high power fields with > 50 cells/field (n = 3-19 fields) from three independent experiments (4 sonoporation sites, 1 control site per experiment) of study groups represented in panels 1-9. Kruskall Wallis non-parametric ANOVA P < 0.0001; panel 1: n=19 fields; panel 2: n=12 fields; panels 3, 4, 6: n=3 fields, panel 5: n=4 fields; panel 7: n=12 fields; panels 8, 9: n=3 fields. Post-hoc test: Dunn's multiple comparisons test, *, p < 0.05; ****, p < 0.0001. (F) Peak negative acoustic pressure (red bar) used in sonoporation of jNP-MB complexes compared with reported acoustic pressure levels in studies of CMBs by others (green ←) in References (REFs) A-D. (G) Bar graph of % cell viability before (100%) and after sonoporation of Panc1 tumor cells transfected using DEspR-targeting jNP-DNA-MBs delivering RFP-minigene DNA (n = 3 independent experiments). REFs, corresponding reference levels from published comparator CMBs: A, B, C, D, notated with green arrows in panels 4E, 4F, 4G are references -, respectively.
Figure 5
Figure 5
In vivo analysis of jNP-MB theranostic functionality: contrast-enhanced ultrasound molecular-imaging and delivery of reporter-RFP minigene. (A) Diagram of molecular imaging sequence, with key events marked #1-#5 in series. Arrows connect to corresponding representative contrast-enhanced ultrasound images: overlay of B-mode (grey-scale image) and contrast-enhanced images (pseudo-colored green image) of spontaneous rat mammary tumors showing baseline (#1), during bolus infusion (#2) comparing control DEspR-targeted MB-DNA (Targeted MB-DNA, yellow line) and DEspR-targeted jNP-DNA-MBs (red line) during adherence (#4) and after disruption (#5) of MBs. Free MBs, dotted blue line are typically cleared by 5 min. (B) Corresponding time intensity curve generated during infusion (#2), average (green line), individual signals (blue dots). (C) Diagram depicting regions of interest (ROI) for time-intensity analysis of molecular imaging done on mammary tumors: ROI of intratumoral microvessels (mv, red vessels, dashed red oval in A#4, A#5) and of tumor feeder vessels at base of tumor (boxed yellow here and in A). (D) Representative time-intensity curves of background-subtracted contrast intensity signals (CIS) in designated tumor-ROIs at pre-destruct (pre) and post-destruct (post) comparing DEspR-targeting jNP-DNA-MBs (Targeted jNP-DNA-MBs) and control DEspR-targeting (biotin-avidin) MBs (Targeted MB-DNA) in extra-tumoral feeder vessels (fv) and intratumoral microvessels (mv). Timepoint of high-power ultrasound MB-destruct sequence (dashed line) demarcating pre- and post-destruct CIS. Green line, average of background-subtracted contrast intensity signals (CIS, blue dots) representing contrast-enhanced signals from adherent targeted-MBs in pre-destruct phase, and confirmation of adherent MBs after MB-destruction in post-destruct phase, determined via VisualSonics Contrast software. (E) Quantitative analysis of average CIS in the 10 s pre-destruct sequence, comparing DEspR-targeting jNP-DNA-MBs (jNP, open red circles) vs control (C) non-jNP DEspR-targeting MB-DNA microbubbles (C, open black circles) in two ROIs: extratumoral feeder vessels (fv) and intratumoral microvessels (mv). At t-20 (and t-30 min), CIS-levels represent mostly if not only DEspR-bound adherent MBs, as shown at the end of post-destruct level. One-way ANOVA P < 0.0001; ****, Tukey's multiple pairwise comparison P < 0.0001, 8 groups, n = 10 average CIS-levels/group representing 3-4 per second averages during pre-destruct phase, from 3 independent experiments using spontaneous mammary tumor rat model. Average CIS values taken from both tumor-ROIs: extra-tumoral feeder vessels (fv) and intra-tumoral microvessels (vs) at two imaging sessions (t20- and t30 min). (F) Diagram of key events in sonoporation of targeting jNP-DNA-MBs in intratumoral microvessels: pre-sonoporation #1-#4: #1, sonoporator; #2, endothelial cells in microvessel; 3, adherent jNP-DNA-MBs after clearance of unbound MBs; 4: tumor cells in cancer-microvascular niche; ➔, after sonoporation #5-#8: #5, non-injured endothelial cells; #6, disassembled jNPs and MBs and disrupted insonated MBs; #7, jNP-DNA released from MBs and direct entry into cytosol through transient “sonopores” that seal subsequently in conditions with no acoustic injury; #8, heterogeneous tumor cells in perivascular cancer niche transfected with jNP-DNA functional RFP-minigene (red inverted triangles). (G) Graph of IVIS-generated peak reporter-function fluorescence in vivo comparing DEspR-targeting jNP-DNA-MBs (open red circles, n = 5 tumors, min 4.7 x 10⁷ to 1.4 x 10⁹ photons/s/area) and control DEspR-targeting MB-DNA (solid black squares, n = 3 tumors); *, p = 0.036 two-tailed Mann Whitney test. Peak fluorescence units from published reports of in vivo delivery using CMBs are noted as relative reference points (REFs) with arrows: E, F, G, H -, respectively. Reference F is ICAM-1 targeted; E, G, H utilize default liver-uptake. (H) Comparison of number of MBs used per gram body weight (#MBs: 4 x 10⁵/g BW for jNP-MBs and control MB-DNA) used for in vivo delivery of reporter function genes comparing jNP-MBs used in 200-250 g rat models, with published CMBs (REFs C, E, G, H are ,,,, respectively, used in 20-25 g mouse models.
Figure 6
Figure 6
In vivo analysis of jNP-mediated targeted delivery of miRNA and contrast-enhanced MR-imaging. (A) Plot of melting temperatures (Tm) derived from real-time qRT-PCR analyses of miRNA-126 corroborating miRNA-126-specific amplification to detect miRNA-126 in rat xenograft tumors 48-h after sonoporation with DEspR-targeted jNP[miRNA-126]MBs: using 108 MBs, 1012 jNPs, 27 µg of ds[miRNA-126]-mimic compared to negative control tumors (non-sonoporated, non-infused). Tm plots from different samples are identical and consistent with expected Tm for miRNA-126 ~ 75.4°C. (B) Real-time qRT-PCR cycle threshold (Ct) plots of miRNA-126 comparing sonoporated breast (red: MB-231-CSC) and pancreatic (blue: Panc1-CSC) xenograft tumors and negative control (grey: non-sonoporated, non-infused) tumors; low Ct indicate high miRNA-126 levels. (C) Bar graph of Ct values, means ± sd; **, P < 0.001 one-way ANOVA followed by Holms Sidak multiple pairwise comparison of control tumor (tmr) vs tumor tissues individually, *, P < 0.05. Control tumor (non-treated, solid black bar), control normal kidney and liver (n = 4/group) (open bars); sonoporated for miRNA-126 delivery: MB 231 TNBC-mammary xenograft tumor (n = 4) (solid red bar), Panc1 pancreatic cancer xenograft subcutaneous tumor (n = 6) (solid blue bar). (D) Representative Western blot analysis of miRNA-126's target KRAS protein shows decreased KRAS level 48 h after delivery of miRNA-126 by sonoporation; b-actin protein levels serve as internal control. (E) jNP-MB miR-126 in vivo testing in a xenograft tumor model of pancreatic peritoneal metastasis. Diagram of experimental timeline of tumor establishment and miR-126 delivery. Representative necropsy pictures at study endpoint comparing control mock-treated and jNP-MB miR-126 treated rat with xenograft Panc1-CSC derived peritoneal metastasis. Yellow arrows point to tumors. (F) Magnetic resonance studies of gradient-echo signal intensity versus echo time (TE), from 10-100 milliseconds (ms), for IgG-jNPs (solid red circles) and precursor PEG-uspion phantoms (solid black circles), both at 5 x 10¹⁰/mL in 1% agar, and control blank 1% agar phantom (solid blue circles). Data points show mean ± s.d. over 60 pixels in each phantom. Each curve was normalized so that peak signal at TE = 4 ms is equal to 1. jNPs exhibited shorter T2* values (mean ± sd: 35.2 ± 1.3 ms) compared with precursor PEG-USPIONs (57.6 ± 2.9 ms) and control blanks (82.2 ± 4.6 ms), *** P < 0.001, two-way ANOVA (subtype x time) repeated measures. (G) Representative ex vivo magnetic resonance (MR)-images (MRI) of pancreatic peritoneal tumors obtained using identical MRI settings and digital image settings 24-h after infusion of jNPs compared with control no jNPs infused. Regions containing high concentrations of jNPs showed hypointense (dark) signals at TE=6.5 ms, and this effect was amplified at TE=13 ms (compared area in dashed yellow and red circles, and area with red arrow). The control samples (no jNPs) did not show similar signal dropouts indicating presence of USPIONs in jNPs. In all images, t = tumor. (H) ELISA levels of key cytokines/chemokines (IL-1a, -6, -4, -10, -12, 13: interleukins; TNFa: tumor necrosis factor alpha, GM-CSF: granulocyte macrophage colony stimulating factor, IFN-g: interferon gamma, RANTES: Regulated on Activation, Normal T Cell Expressed and Secreted (or CCL5) produced by cells which are exposed to jNPs in the circulation such as ECs, endothelial cells, MNC, monocytes, T- and B-cell leukocytes, PMNs, neutrophils; Mast, complement-activating mast cells. Statistics performed: two-way (jNP-dose x cytokine levels across different cytokines) ANOVA (ns, not significant); n = 2 rats/group x 3 groups: 1012 jNP infusion (red hashed bars), 1013 jNPs infusion (solid red bars), and no jNP-infusion (solid black bars) negative control rats. RANTES and IL-13 show elevation but not significantly different between groups likely due to rat-specific wide-variations.

References

    1. McGuigan A, Kelly P, Turkington RC, Jones C, Coleman HG, McCain RS. Pancreatic cancer: A review of clinical diagnosis, epidemiology, treatment and outcomes. World J Gastroenterol. 2018;24:4846–61. - PMC - PubMed
    1. Li X, Yang J, Peng L, Sahin AA, Huo L, Ward KC. et al. Triple-negative breast cancer has worse overall survival and cause-specific survival than non-triple-negative breast cancer. Breast Cancer Res Treat. 2017;161:279–87. - PubMed
    1. Berrecoso G, Crecente-Campo J, Alonso MJ. Unveiling the pitfalls of the protein corona of polymeric drug nanocarriers. Drug Deliv Transl Res. 2020;10:730–50. - PubMed
    1. Gilleron J, Querbes W, Zeigerer A, Borodovsky A, Marsico G, Schubert U. et al. Image-based analysis of lipid nanoparticle-mediated siRNA delivery, intracellular trafficking and endosomal escape. Nat Biotechnol. 2013;31:638–46. - PubMed
    1. Ventola CL. Progress in nanomedicine: Approved and investigational nanodrugs. P T. 2017;42:742–55. - PMC - PubMed

Publication types