. 2022 Nov 7;12(18):7681-7698.
doi: 10.7150/thno.74974. eCollection 2022.

AKR1C3-dependent lipid droplet formation confers hepatocellular carcinoma cell adaptability to targeted therapy

Affiliations

AKR1C3-dependent lipid droplet formation confers hepatocellular carcinoma cell adaptability to targeted therapy

Changqing Wu et al. Theranostics. .

Abstract

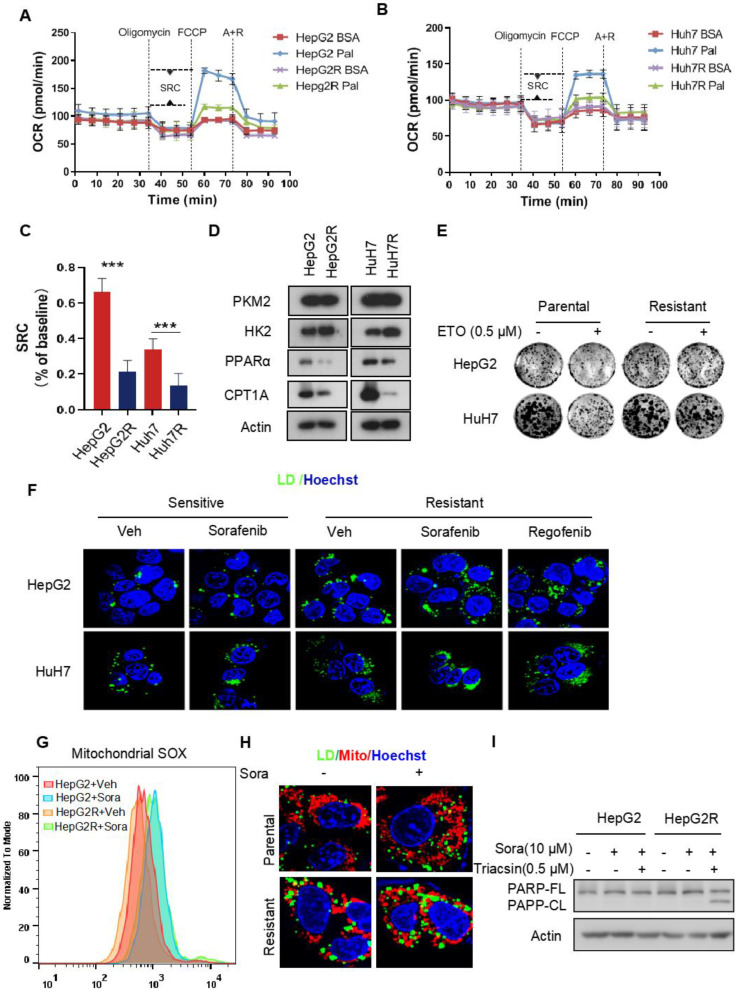
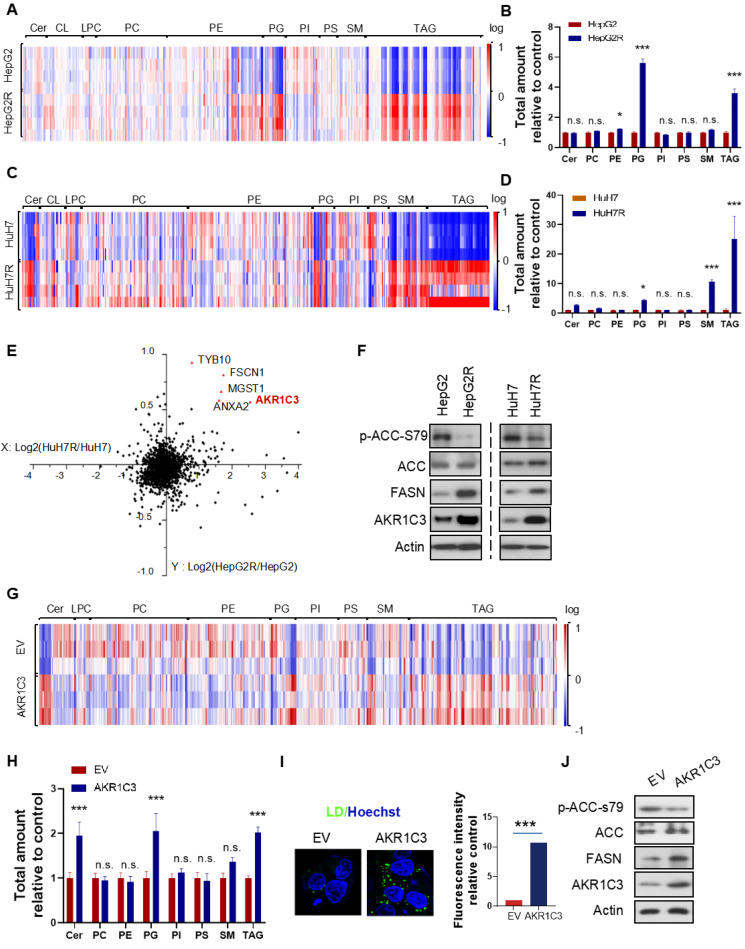
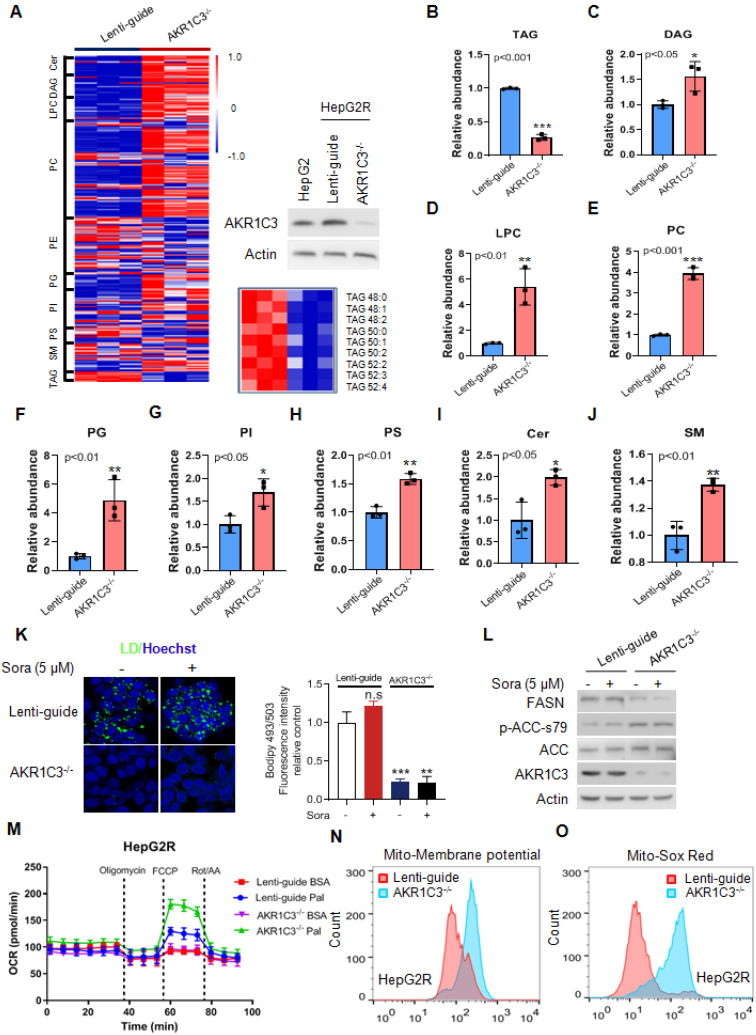
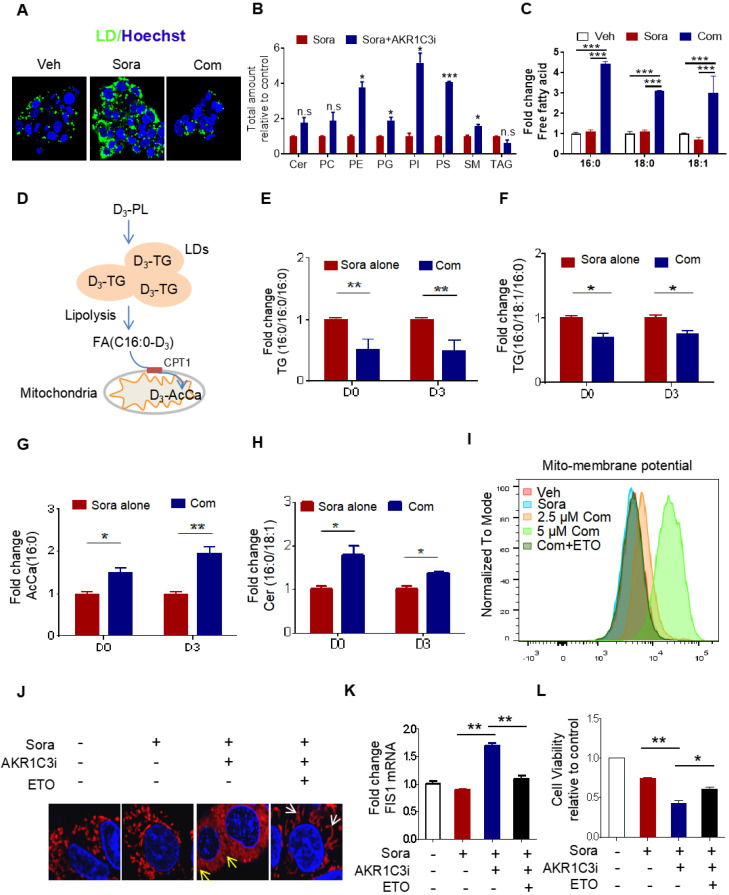
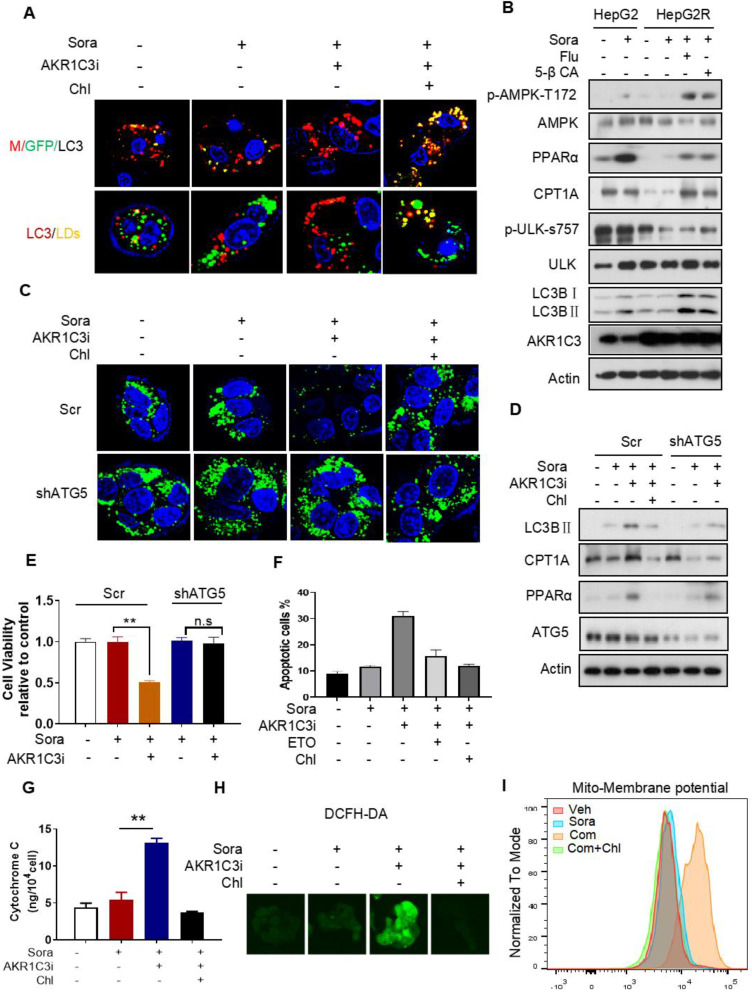
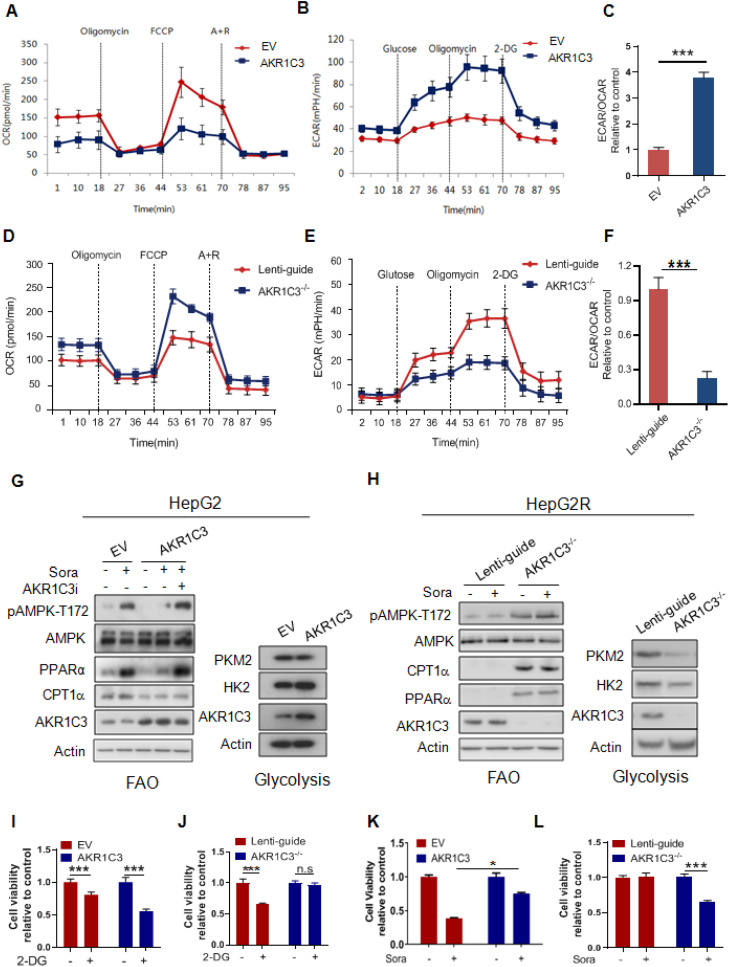
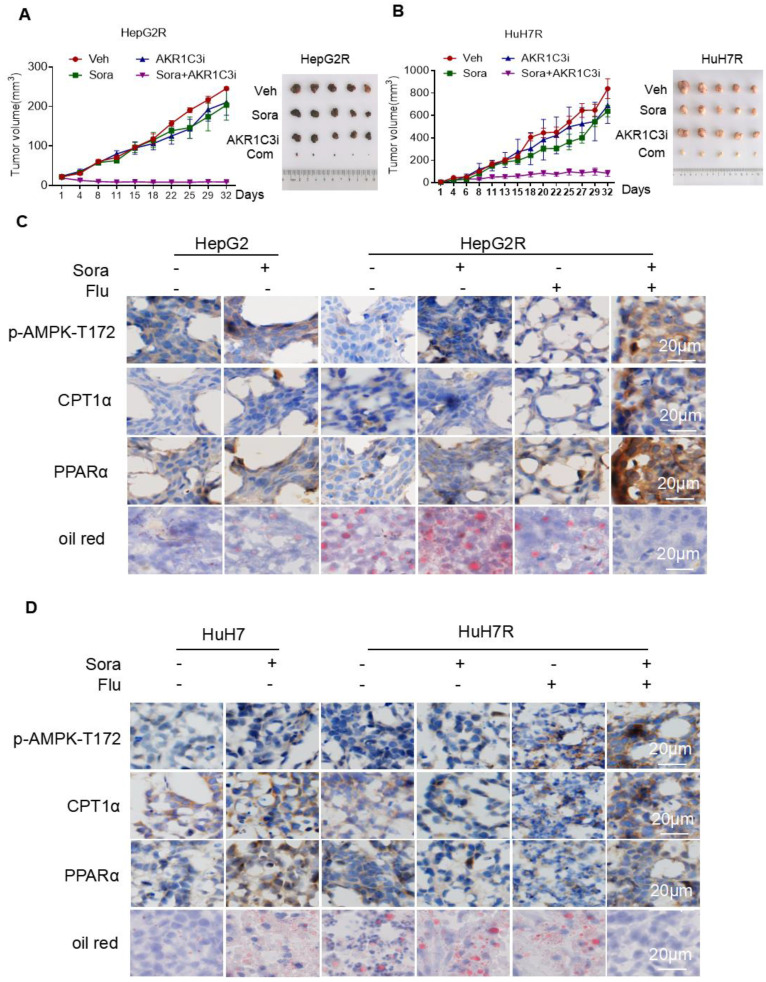
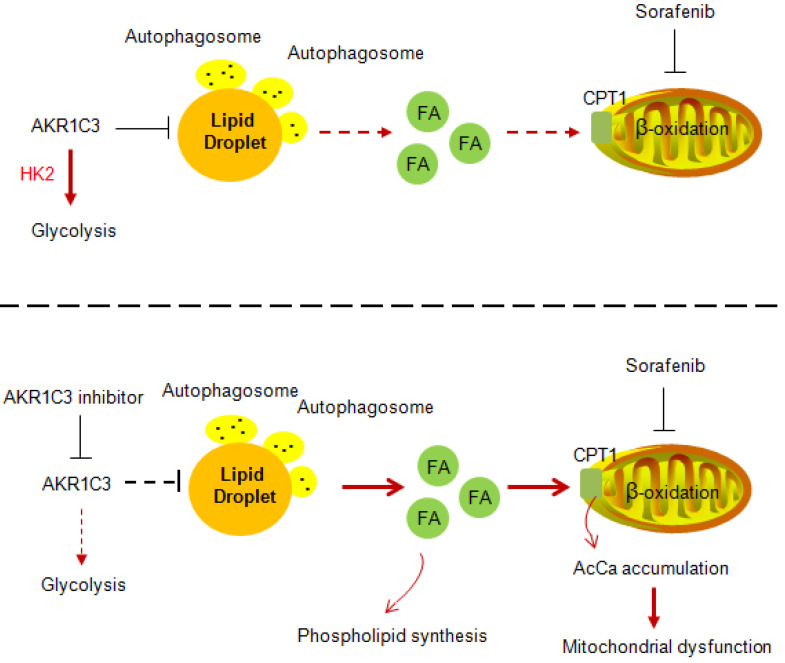
Rationale: Increased lipid droplet (LD) formation has been linked to tumor metastasis, stemness, and chemoresistance in various types of cancer. Here, we revealed that LD formation is critical for the adaptation to sorafenib in hepatocellular carcinoma (HCC) cells. We aim to investigate the LD function and its regulatory mechanisms in HCC. Methods: The key proteins responsible for LD formation were screened by both metabolomics and proteomics in sorafenib-resistant HCC cells and further validated by immunoblotting and immunofluorescence staining. Biological function of AKR1C3 was evaluated by CRISPR/Cas9-based gene editing. Isotopic tracing analysis with deuterium3-labeled palmitate or carbon13-labeled glucose was conducted to investigate fatty acid (FA) and glucose carbon flux. Seahorse analysis was performed to assess the glycolytic flux and mitochondrial function. Selective AKR1C3 inhibitors were used to evaluate the effect of AKR1C3 inhibition on HCC tumor growth and induction of autophagy. Results: We found that long-term sorafenib treatment impairs fatty acid oxidation (FAO), leading to LD accumulation in HCC cells. Using multi-omics analysis in cultured HCC cells, we identified that aldo-keto reductase AKR1C3 is responsible for LD accumulation in HCC. Genetic loss of AKR1C3 fully depletes LD contents, navigating FA flux to phospholipids, sphingolipids, and mitochondria. Furthermore, we found that AKR1C3-dependent LD accumulation is required for mitigating sorafenib-induced mitochondrial lipotoxicity and dysfunction. Pharmacologic inhibition of AKR1C3 activity instantly induces autophagy-dependent LD catabolism, resulting in mitochondrial fission and apoptosis in sorafenib-resistant HCC clones. Notably, manipulation of AKR1C3 expression is sufficient to drive the metabolic switch between FAO and glycolysis. Conclusions: Our findings revealed that AKR1C3-dependent LD formation is critical for the adaptation to sorafenib in HCC through regulating lipid and energy homeostasis. AKR1C3-dependent LD accumulation protects HCC cells from sorafenib-induced mitochondrial lipotoxicity by regulating lipophagy. Targeting AKR1C3 might be a promising therapeutic strategy for HCC tumors.

Keywords: Lipid droplets; Lipid homeostasis; Lipophagy; Metabolic reprogramming; Mitochondrial dysfunction..


Conflict of interest statement

Competing Interests: The authors have declared that no competing interest exists.

Figures

Figure 1
Figure 1
Impairment of FAO induces LD accumulation in HCC cells (A-B) FAO activity was measured under basal conditions by Seahorse XF-96 assays in the two paired HCC cell lines. Oligomycin, FCCP, antimycin, and rotenone were added at the indicated time points in the presence of either BSA or palmitate. (C) The percentage of maximum OCR after FCCP injection of baseline OCR (SRC) in these two paired cell lines. (D) Total cell lysates of HepG2, HepG2R, HuH7, and HuH7R lines were extracted and subjected to immunoblotting against the indicated antibodies. (E) The two paired HCC cell lines were treated with or without 25 μM Etomoxir for 2 weeks. Colony forming ability was determined by crystal violet assay. (F) HepG2 and HepG2R cells were treated with or without sorafenib or regorafenib (rego) for 24 h. Bodipy493/503 stained LDs were visualized and analyzed by immunofluorescence microscopy. Nucleus was stained by Hoechst (blue). (G) Flow cytometry histograms and the corresponding quantification of fluorescent intensity. (H) HepG2 and HepG2R cells were treated with or without 5 μM sorafenib for 24 h, respectively. Cells were stained by Bodipy493/503 and Mito-Tracker CMXROS and then subjected to microscopy. Representative images were shown: Cellular LDs (green); Mitochondria (red); and Nucleus (blue). (I) HepG2 and HepG2R cells were treated with 10 μM sorafenib and 0.5 μM Triacsin C for 12 h. The cell lysates were extracted and subjected to an immunoblotting assay.
Figure 2
Figure 2
Omics studies identified that increased AKR1C3 activity is critical for TAGs accumulation (A-D) Heatmap and quantitative analysis of altered metabolites (FDR < 0.05) in two paired sorafenib resistant HCC cell lines. Relative abundance of each metabolite was quantified in both lines. (E) Logarithmic fold change of protein expression in sorafenib resistant cells compared to their parental cells. (F) The HepG2/HepG2R and HuH7/HuH7R cells were lysed and subjected to immunoblotting with the indicated antibodies. (G-H) Heatmap and quantitative analysis of altered metabolites (FDR < 0.05) in AKR1C3-overexpression HepG2 cells (HepG2-AKR1C3), in comparison to the empty vector-transfected cells (HepG2-EV). Relative abundance of each metabolite was quantified. P-values of each metabolite are shown on the top of graph. (I) LDs were stained using Bodipy493/503 (green) in both HepG2-EV and HepG2-AKR1C3 cells and analyzed by fluorescent microscopy. Nucleus was stained using Hoechst (blue). (J) HepG2-EV and HepG2-AKR1C3 cells were lysed and subjected to immunoblotting against the indicated antibodies. All data are quantified as mean ± SEM. Asterisk indicates significant difference. “n.s” indicates no significance, * p < 0.05, *** p < 0.001.
Figure 3
Figure 3
Genetic deletion of AKR1C3 abrogates TAG accumulation in resistant HCC cells (A) Heatmap showing the hierarchical clustering of the lipid species in the Lenti-guide control and AKR1C3-/- groups, colored by abundance intensity. The efficacy of CRISPR/Cas9-based gene editing was evaluated by immunoblotting. Significant changes in TAGs species across those two groups were significant. (B-J) Relative abundance of significantly changed lipid species (Lenti-guide control and AKR1C3-/- groups). (K) Lenti-guide control and AKR1C3-/- HepG2R cells were treated with or without sorafenib for 24 h, then stained by Bodipy493/503. Cellular LD contents were visualized and evaluated by FACs and quantification of fluorescent intensity. Nucleus was stained using Hoechst (blue). (L) Lenti-guide control and AKR1C3-/- HepG2R cells were treated with or without 5 μM sorafenib for 24 h, respectively. The total cell lysates were extracted and subjected to immunoblotting with indicated antibodies. (M). Oxygen consumption rates were measured in both Lenti-guide control and AKR1C3-/- HepG2R cells incubated with BSA or palmitate, respectively. Oligomycin, FCCP, and rotenone/antimycin were added at the indicated time points. (N-O) Lenti-guide control and AKR1C3-/- HepG2R cells were stained by Mito-tracker red CMXROS (red) and MitoSox (red) under basal conditions, respectively. The mitochondrial membrane potential was assessed by FACs assay and quantification of fluorescent intensity. All data are quantified as mean ± SEM. Asterisk indicates a significant difference and “n.s” indicates no significance. * p < 0.05, ** p < 0.01, *** p < 0.001.
Figure 4
Figure 4
AKR1C3 navigates FA flux into TAGs (A) HepG2R cells were treated with vehicle or sorafenib, or combined with AKR1C3 inhibitor for 24 h, then stained using Bodipy493/503. Cellular LD contents were visualized by fluorescent microscopy. Nucleus was stained using Hoechst (blue). Com indicates the combination treatment of sorafenib with AKR1C3 inhibitor. (B) Quantitative analysis of altered metabolites (FDR < 0.05) in sorafenib-resistant HCC cell lines cultured with either sorafenib alone or sorafenib combined with AKR1C3 inhibitor. (C) Quantification showing the relative abundance of the intracellular free fatty acids (C16:0, C18:0, and C18:1). (D) Exogenous D3-PL transportation into LDs and fuel to mitochondria for β-oxidation. (E-H) HepG2 cells were incubated with either 0.5% BSA diluted d0-C16:0 or d3-C16:0 FFA. Cells were also treated with sorafenib or sorafenib combined with AKR1C3 inhibitor as indicated. Quantification showing the relative levels of lipids altered by AKR1C3 inhibitor. (I-J) HepG2R cells were treated with or without sorafenib or combined with AKR1C3 inhibitor and additional Etomoxir for 24 h. The cells were stained using MitoSox (red) followed by FACs assay. The cells were also stained by Mito-tracker red CMXROS (red) and visualized with fluorescence microscopy. Nucleus was stained using Hoechst (blue). Yellow arrow indicates the mitochondria undergoing fission, while the white arrow indicates fused or elongated mitochondria. (K-L) Relative mRNA level of FIS1 in HepG2R cells treated with or without sorafenib, sorafenib combined with AKR1C3 inhibitor, and additional Etomoxir for 24 h. Cell viability was assessed by Cell Titer-Glo assay. All data are quantified as mean ± SEM. Asterisk indicates significant difference. “n.s” indicates no significance,* p < 0.05, ** p < 0.01,*** p < 0.001.
Figure 5
Figure 5
AKR1C3 inhibits autophagy-dependent LD degradation (A) Empty vector and mCherry-GFP-LC3-transfected HepG2R cells were incubated with vehicle or 5 μM sorafenib or combined with AKR1C3 inhibitor and additional chloroquine for 24 h. Autophagy flux (above) and co-localization (below) of LDs (green) and LC3 (red) were evaluated by immunofluorescence staining. Representative images are shown. (B) HepG2 and HepG2R cells were treated with vehicle or sorafenib or combined with AKR1C3 inhibitors (FLU or 5β-CA) for 24 h. The cells were lysed and subjected to immunoblotting against the indicated antibodies. (C) HepG2R-Scr and HepG2R-shATG5 cells were treated with vehicle or sorafenib or combined with AKR1C3 inhibitor and additional Chloquine for 24 h. The LDs and nucleus were stained using Bodipy (green) and Hoechst (blue), respectively. Representative images were shown. (D) HepG2R-Scr and HepG2R-shATG5 were incubated with vehicle or sorafenib or sorafenib combined with AKR1C3 inhibitor and additional chloroquine for 24 h. The cells were lysed and subjected to immunoblotting against the indicated antibodies. (E) HepG2R-Scr and HepG2R-shATG5 cells were incubated with vehicle or sorafenib or sorafenib combined with AKR1C3 inhibitor for 24 h. Cell viability was assessed by Cell Titer-Glo assay. (F) HepG2R cells were incubated with vehicle or sorafenib or sorafenib combined with AKR1C3 inhibitor. These HepG2R cells were additionally treated with etomoxir or chloroquine. Cellular apoptosis was evaluated by crystal violet staining and Annexin V/PI double staining. The percentage of apoptotic cells was quantified by FACs and fluorescent intensity. (G) HepG2R cells were incubated with sorafenib or combined with AKR1C3 inhibitor and additional chloroquine for 8 h. Intracellular cytochrome C was measured. (H) HepG2R cells were treated with or without sorafenib or combined with FLU and additional chloroquine. Total cellular ROS were assessed by DCFH-DA staining and subjected to immunofluorescence microscopy. Representative images are shown. (I) HepG2R cells were treated with either vehicle or sorafenib or sorafenib combined with AKR1C3 inhibitor and additional chloroquine for 24 h. The cells were stained using Mito-tracker red CMXROS (red), then subjected to FACs assay. Com represents sorafenib combined with AKR1C3 inhibitor. All data are quantified as mean ± SEM. Asterisk indicates significant difference, “n.s” indicates no significance, ** p < 0.01.
Figure 6
Figure 6
AKR1C3 controls metabolic balancing between FAO and glycolysis (A) Oxygen consumption rate was measured by Seahorse XF-96 assay in HepG2-EV and HepG2-AKR1C3 cells. Oligomycin, FCCP, antimycin, and rotenone were added at the indicated time points. (B) Extracellular acidification rates were measured by Seahorse XF-96 assays in HepG2-EV and HepG2-AKR1C3 cells. Glucose, Oligomycin, and 2-DG were added at the indicated time points. (C) Ratios of ECAR to OCR in HepG2-EV and HepG2-AKR1C3 cells. (D) Oxygen consumption rates were measured by Seahorse XF-96 assays in Lenti-guide control and AKR1C3-/- HepG2R cells. Oligomycin, FCCP, antimycin, and rotenone were added at the indicated time points. (E) Extracellular acidification rate was measured by Seahorse XF-96 assays in Lenti-guide and AKR1C3-/- HepG2R cells. Glucose, oligomycin, and 2-DG were added at the indicated time points. (F) Ratios of ECAR to OCR in Lenti-guide control and AKR1C3-/- HepG2R cells. (G) HepG2-EV and HepG2-AKR1C3 cells were cultured with or without sorafenib or combined with AKR1C3 inhibitor for 24 h. The extracted proteins were analyzed by immunoblotting with the indicated antibodies. (H) Lenti-guide control and AKR1C3-/- cells HepG2R cells were incubated with or without sorafenib or combined with AKR1C3 inhibitor for 24 h. The extracted protein was analyzed by immunoblotting against the indicated antibodies. (I-J) HepG2-EV, HepG2-AKR1C3, Lenti-guide control, and AKR1C3-/- HepG2R cells were treated with or without 2-DG for 24 h. Cell viability was assessed by Cell Titer-Glo assay. (K-L) HepG2-EV, HepG2-AKR1C3, Lenti-guide control, and AKR1C3-/- HepG2R cells were treated sorafenib for 24 h. Cell viability was assessed by Cell Titer-Glo assay. All data are quantified as mean ± SEM. Asterisk indicates significant difference, “n.s” indicates no significance, * p < 0.05, *** p < 0.001.
Figure 7
Figure 7
Inhibition of AKR1C3 leads to sorafenib-resistant HCC tumor regression in xenograft mice (A-B) HepG2/HepG2R and HuH7/HuH7R cells were injected into BALB/c nude mice. Tumor volume was calculated using caliper measurements (π/6 × length × width2). n = 5 for each group. Once the subcutaneous tumors reached the volume of 300 mm3, the treatment began. Mice were randomly subjected to the vehicle, sorafenib (25 mg/kg), flufenamic acid (25 mg/kg), or a combination of sorafenib. Flufenamic acid was administered every 2-3 days at the same dose. Four weeks post-implantation, tumors were isolated from each group. Figures of isolated tumor are shown on the right. (C-D) Xenograft tumors from each group were sectioned and subjected to immunohistochemistry against the indicated antibodies. Oil red was used to stain lipid droplets in these tumors. Scale bar, 20 μm. The mice were randomly selected from each group. Representative images are shown.
Figure 8
Figure 8
Proposed model of AKR1C3-dependent LD metabolism in mitigating lipotoxicity in sorafenib-resistant HCC.

Similar articles

Cited by

References

    1. Harris PS, Hansen RM, Gray ME, Massoud OI, McGuire BM, Shoreibah MG. Hepatocellular carcinoma surveillance: An evidence-based approach. World J Gastroenterol. 2019;25:1550–1559. - PMC - PubMed
    1. Forner A, Llovet JM, Bruix J. Hepatocellular carcinoma. Lancet. 2012;379:1245–1255. - PubMed
    1. Bull VH, Rajalingam K, Thiede B. Sorafenib-induced mitochondrial complex I inactivation and cell death in human neuroblastoma cells. J Proteome Res. 2012;11:1609–1620. - PubMed
    1. Zhang C, Liu Z, Bunker E, Ramirez A, Lee S, Peng Y. et al. Sorafenib targets the mitochondrial electron transport chain complexes and ATP synthase to activate the PINK1-Parkin pathway and modulate cellular drug response. J Biol Chem. 2017;292:15105–15120. - PMC - PubMed
    1. Zhang M, Zhang H, Hong H, Zhang Z. MiR-374b re-sensitizes hepatocellular carcinoma cells to sorafenib therapy by antagonizing PKM2-mediated glycolysis pathway. Am J Cancer Res. 2019;9:765–778. - PMC - PubMed

Publication types