[Preprint]. 2022 Nov 23:2022.11.22.517574.
doi: 10.1101/2022.11.22.517574.

Direct Cryo-ET observation of platelet deformation induced by SARS-CoV-2 Spike protein

Affiliations

Direct Cryo-ET observation of platelet deformation induced by SARS-CoV-2 Spike protein

Christopher Cyrus Kuhn et al. bioRxiv. .

Update in

Abstract

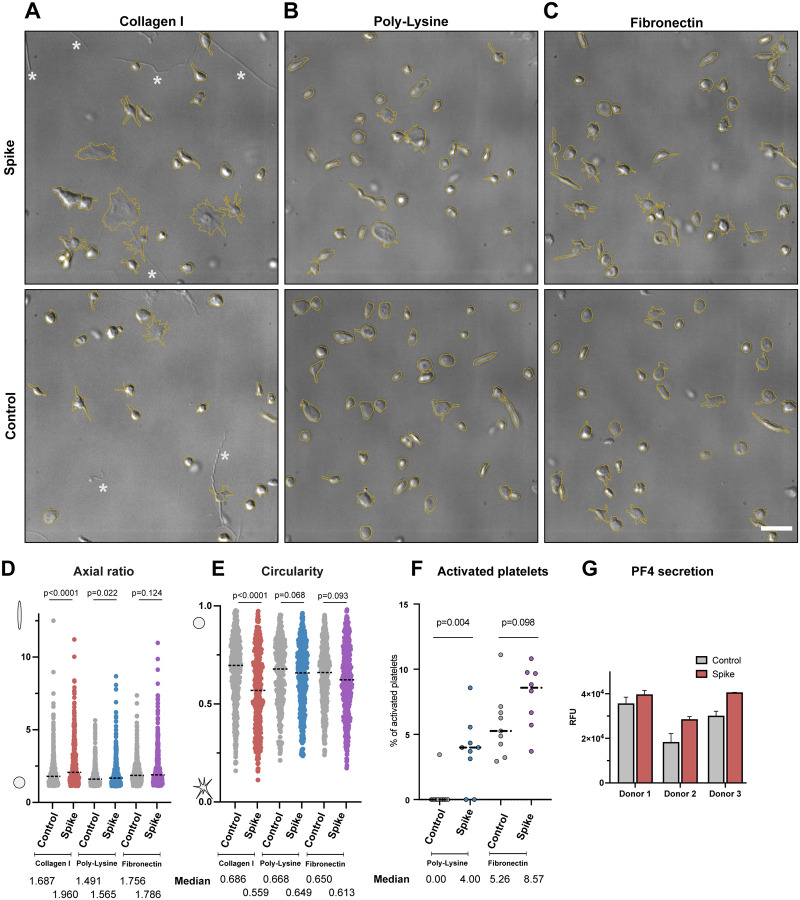
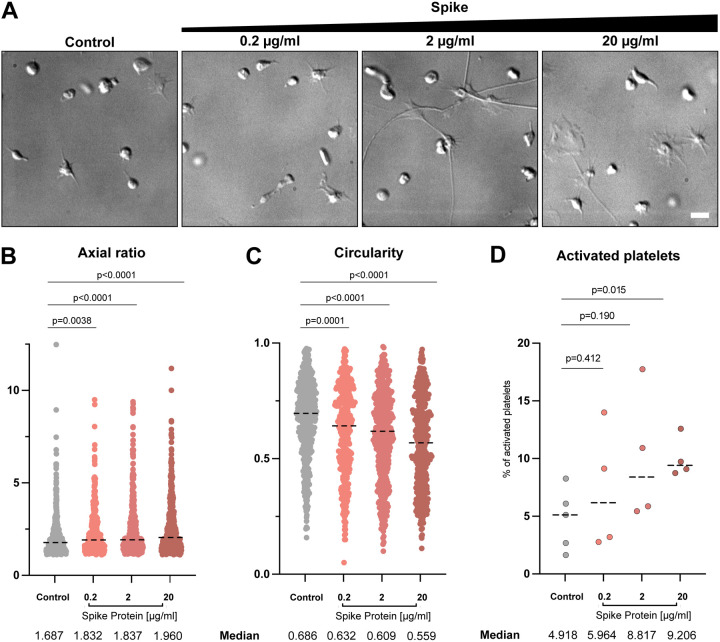
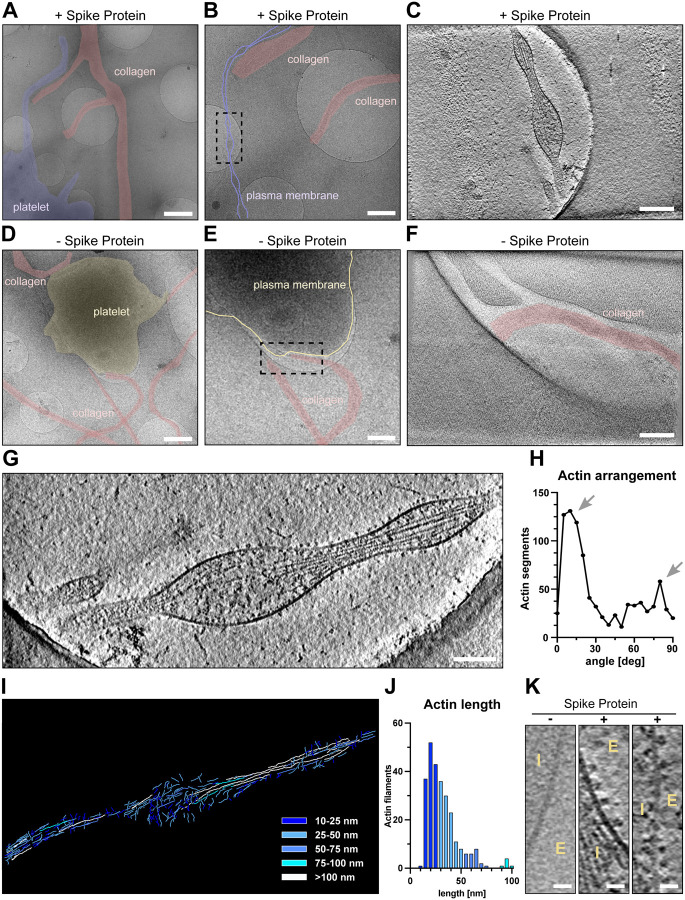
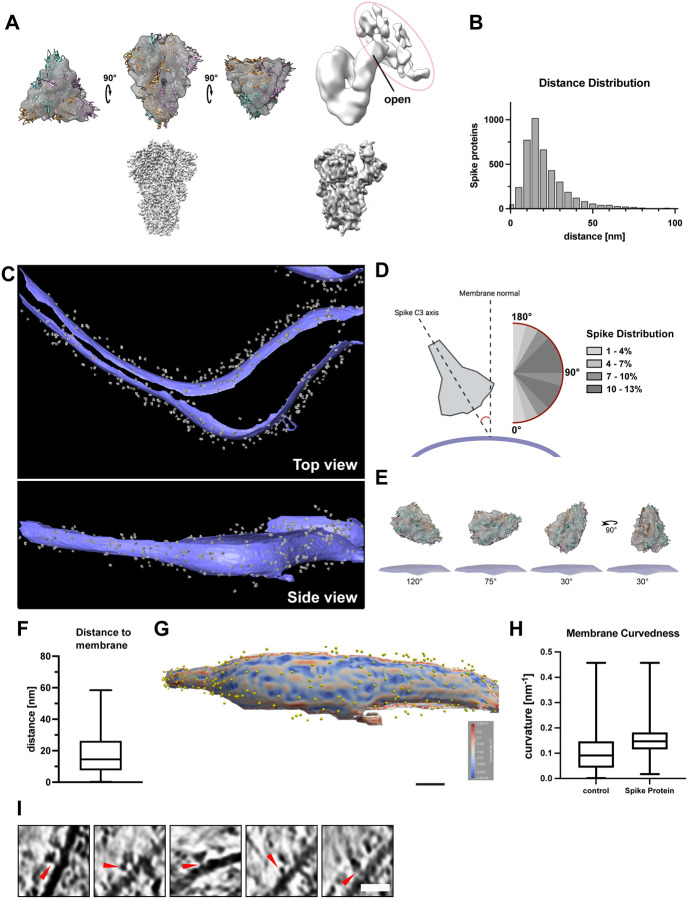
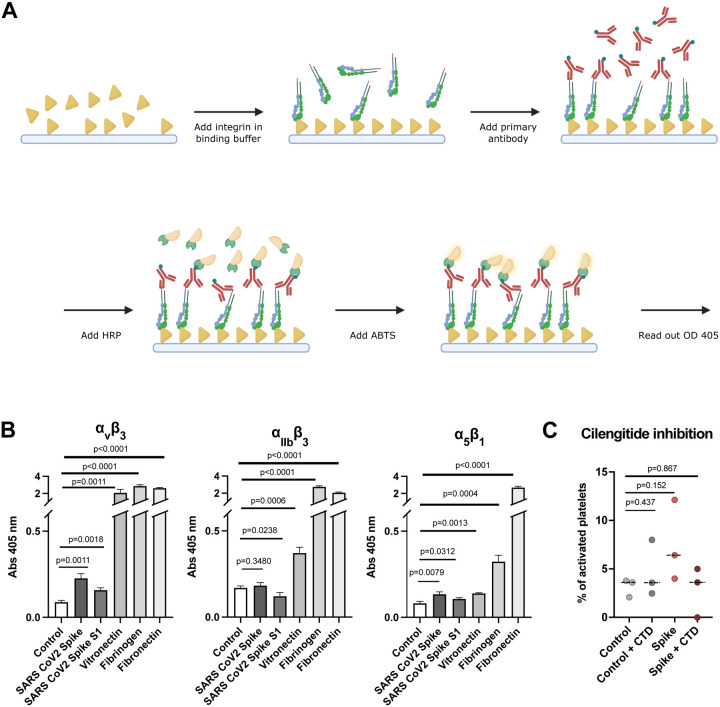
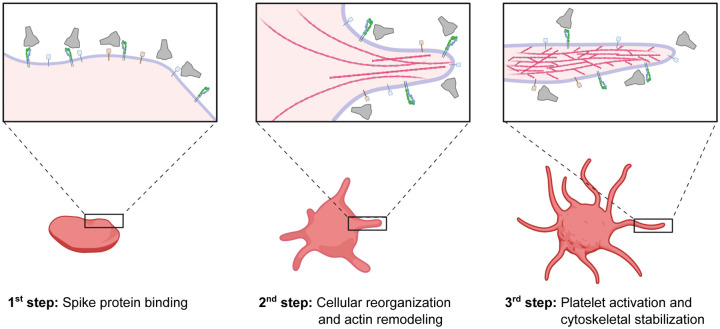
SARS-CoV-2 is a novel coronavirus responsible for the COVID-19 pandemic. Its high pathogenicity is due to SARS-CoV-2 spike protein (S protein) contacting host-cell receptors. A critical hallmark of COVID-19 is the occurrence of coagulopathies. Here, we report the direct observation of the interactions between S protein and platelets. Live imaging showed that the S protein triggers platelets to deform dynamically, in some cases, leading to their irreversible activation. Strikingly, cellular cryo-electron tomography revealed dense decorations of S protein on the platelet surface, inducing filopodia formation. Hypothesizing that S protein binds to filopodia-inducing integrin receptors, we tested the binding to RGD motif-recognizing platelet integrins and found that S protein recognizes integrin α v β 3 . Our results infer that the stochastic activation of platelets is due to weak interactions of S protein with integrin, which can attribute to the pathogenesis of COVID-19 and the occurrence of rare but severe coagulopathies.


Figures

Figure 1.
Figure 1.. Comparison of platelet morphology with and without SARS-CoV-2 S protein.
(A) DIC images of platelets without (Control) and pre-incubated with 20 μg/ml S protein (Spike) on a collagen I support. The platelet shape is outlined in dashed yellow. * indicates collagen I fibers. (B) DIC images of platelets without and pre-incubated with S on a poly-L-lysine support. (C) DIC images of platelets without and pre-incubated with S protein on a fibronectin support. Scale bar: 5 μm (A-C). (D) Quantification of the axial ratio of platelets (major axis/minor axis) on different coated surfaces, without and in the presence of S protein The median axial ratio is shown below the corresponding violin plot. The significance was determined by Mann-Whitney U test. (E) Quantification of the circularity of platelets on different coated surfaces, without and in the presence of S protein. The median circularity is shown below the corresponding violin plot. The significance was determined by Mann-Whitney U test. (F) Comparison of platelet activation, incubated with and without S protein, on Poly-L-Lysine (left), and on Fibronectin (right) Platelets with amoeba-like morphologies were defined as activated platelets. The significance was determined by Mann-Whitney U test. (G) Sandwich ELISA assay detecting PF4 release in the absence and presence of S protein.
Figure 2.
Figure 2.. Platelet morphology depending on SARS-CoV-2 S protein concentration.
(A) DIC images of platelets in the presence of different amounts of S protein plated onto collagen I-coated surfaces. Scale bar: 5 μm. (B) Quantification of the axial ratio of platelets on collagen I-coated surfaces, without and in the presence of different S protein concentrations. The median axial ratio is shown below the corresponding violin plot. The significance was determined by Mann-Whitney U test. (C) Quantification of the circularity of platelets on collagen I-coated surfaces, without and in the presence of different S protein concentrations. The median circularity is shown below the corresponding violin plot. The significance was determined by Mann-Whitney U test. The plots for control and in the presence of 20 μg/ml spike protein in (B) and (C) are same as those in Figure 1D and E, respectively. (D) Quantification of platelet activation on Collagen I depending on S protein concentration. The significance was determined by Mann-Whitney U test.
Figure 3.
Figure 3.. Cryo-electron tomograms of platelets alone and in the presence of SARS-CoV-2 S protein on a collagen I support.
(A) and (B) Low magnification views of a platelet in the presence of S protein on collagen I. The dashed box in B represents the area of tomographic data collection in C. (C) Tomographic slice of the platelet protrusion in the presence of S protein. The platelet is indicated in purple, collagen I fibers in red. (D) and (E) Low magnification views of a platelet on collagen I. The dashed box in E represents the area of tomographic data collection in F. (F) Representative slice of the reconstructed tomogram of platelet plasma membrane. The platelet is indicated in yellow, collagen I fibers in red. (G) Magnification of the filopodial structure from C with actin filaments running along the protrusion. (H) Angular arrangement of actin filaments along the platelet protrusion. (I) Traced actin filaments of the tomographic reconstruction in G. Actin filaments are colorcoded by length of blue to white. (J) Length distribution of traced actin filaments depicted in I. Actin filaments ≥100 nm (12 in total) are not represented in the graph. (K) Magnified views on the platelet plasma membrane without and in the presence of S protein (E - extracellular, I –intracellular). Scale bars: (A),(D) = 1 μm; (B),(E) = 0.5 μm; (C),(F),(G) = 200 nm; (K) = 20nm.
Figure 4.
Figure 4.. SARS-CoV-2 S protein reconstruction and membrane decoration analysis.
(A) Top-Left: Structure of S protein with closed conformation fitted in the subtomogram reconstruction. Top-Right: Structure of S protein calculated without C3 symmetry, revealing the uplifted RBD domain connected to additional densities from the host platelets. The additional densities connected to the open RBD domain is circled in magenta. Bottom-left: SPA-based structure of S protein in the closed conformation. Bottom-right: SPA-based structure of S protein in the open conformation. (B) Nearest neighbor distance distribution of S protein densities on the platelet surface membrane. The distances are calculated using the originally manually picked coordinates. The median distance between two S protein is 27.3 nm (C) Densities of the reconstructed S protein back-plotted to the segmented platelet plasma membrane (purple – platelet plasma membrane, gray – S protein). The tomogram lacks top and bottom due to the “missing wedge” effect of tomographic data collection. (D) Orientation of S protein (grey) on the membrane surface (purple). The scheme depicts the angle determination of S protein C3 axis and the normal of the platelet plasma membrane. The range from 45–120° was observed to be favorable for S protein interaction with the platelet surface. (E) Schematic depiction of S protein orientation in different angles towards platelet plasma membrane. (F) Distance of S protein from the membrane. The median distance from the center of S protein to the membrane is 16 nm. The box plot represents 25 and 75 percentiles (8.6 and 27 nm, whiskers). (G) Visualization of the platelet plasma membrane curvedness. The yellow spheres indicate the position of S protein on the platelet surface. The top and bottom edge of the segmented membrane was excluded from the estimation and is colored in grey. (H) Membrane Curvature comparison of S protein bound and surface protein free areas on the platelet plasma membrane. The box plots represent 25, median and 75 percentiles. Control: 25% 0.043, median 0.091 and 75% 0.15. + S protein: 25% 0.11, median 0.14 and 75% 0.17. (I) Additional densities (red allow-heads) between picked S protein and platelet plasma membrane. Scale bar: (I): 20nm.
Figure 5.
Figure 5.. Interaction of integrin receptors with SARS-CoV-2 S protein and various ECM proteins.
(A) Scheme of the experimental setup. Immunoplates were coated with either S protein or ECM proteins. The ligands were incubated with various integrin-velcro constructs. Biotinylated anti-velcro polyclonal antibody, subsequently coupled to Streptavidin-HRP, was used to label ligand-bound integrins. Detection of the binding was measured at 405 nm, 10 min after addition of ABTS. The scheme was created with Biorender.com. (B) Binding of integrins αvβ3, αIIbβ3, and α5β1 to S protein and their physiological ECM ligands: αvβ3 - vitronectin, αIIbβ3 - fibrinogen, α5β1 - fibronectin. Data are from a representative experiment out of three independent ones, and shown as mean ± SD. The significance was determined by an unpaired t test. (C) Quantification of platelet activation on Collagen I depending on S protein concentration and integrin inhibitor cilengitide. The significance was determined by Mann-Whitney U test.
Figure 6.
Figure 6.. Schematic representation of potential SARS-CoV-2 S platelet interaction.
First, S protein binds to receptors on the platelet surface, causing the deformation and priming the activation. Protrusions are forming as a consequence of actin remodeling. This leads to the activation of platelets by the formation of filopodia and the stabilization of the cytoskeleton network. The scheme was created with Biorender.com.

References

    1. Zhu N. et al. A Novel Coronavirus from Patients with Pneumonia in China, 2019. N Engl J Med 382, 727–733 (2020). - PMC - PubMed
    1. Wu F. et al. A new coronavirus associated with human respiratory disease in China. Nature 579, 265–269 (2020). - PMC - PubMed
    1. Coronaviridae Study Group of the International Committee on Taxonomy of, V. The species Severe acute respiratory syndrome-related coronavirus: classifying 2019-nCoV and naming it SARS-CoV-2. Nat Microbiol 5, 536–544 (2020). - PMC - PubMed
    1. Lu R. et al. Genomic characterisation and epidemiology of 2019 novel coronavirus: implications for virus origins and receptor binding. Lancet 395, 565–574 (2020). - PMC - PubMed
    1. Zhou P. et al. A pneumonia outbreak associated with a new coronavirus of probable bat origin. Nature 579, 270–273 (2020). - PMC - PubMed

Publication types