. 2022 Nov 14:13:1005906.
doi: 10.3389/fpls.2022.1005906. eCollection 2022.

Effects of trichothecene production by Trichoderma arundinaceum isolates from bean-field soils on the defense response, growth and development of bean plants (Phaseolus vulgaris)

Affiliations

Effects of trichothecene production by Trichoderma arundinaceum isolates from bean-field soils on the defense response, growth and development of bean plants (Phaseolus vulgaris)

Rosa E Cardoza et al. Front Plant Sci. .

Abstract

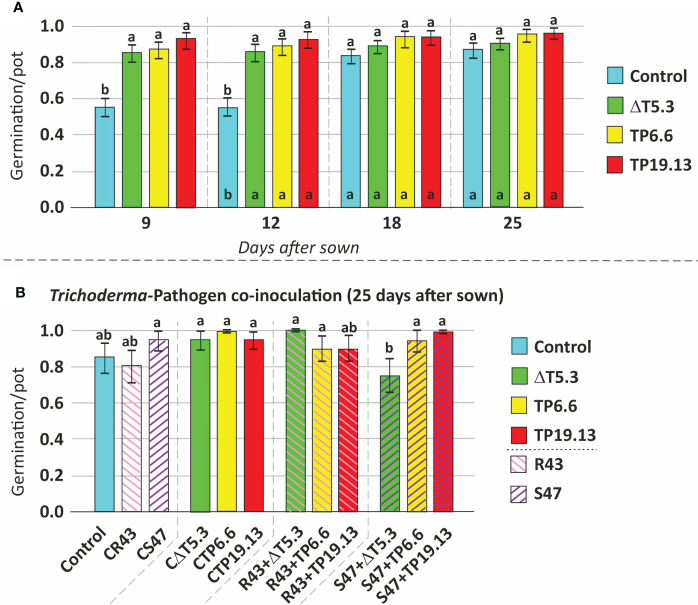
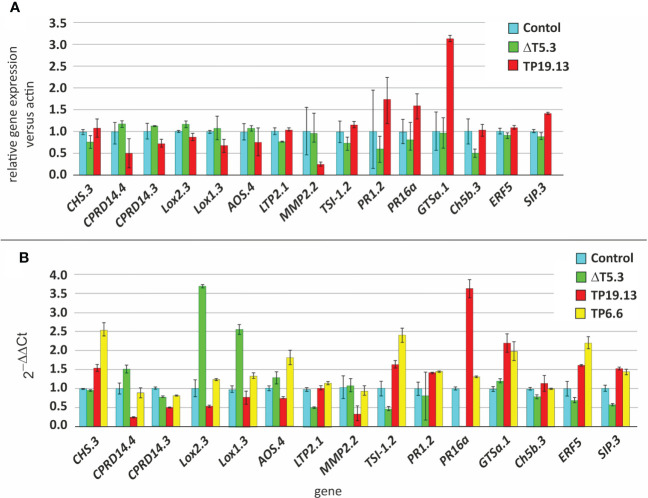
The trichothecene toxin-producing fungus Trichoderma arundinaceum has potential as a biological control agent. However, most biocontrol studies have focused only on one strain, IBT 40837. In the current study, three Trichoderma isolates recovered from bean-field soils produced the trichothecene harzianum A (HA) and trichodermol, the latter being an intermediate in the HA biosynthesis. Based on phylogenetic analysis, the three isolates were assigned to the species T. arundinaceum. Their genome sequences had a high degree of similarity to the reference IBT 40837 strain, in terms of total genome size, number of predicted genes, and diversity of putative secondary metabolite biosynthetic gene clusters. HA production by these bean-field isolates conferred significant in vitro antifungal activity against Rhizoctonia solani and Sclerotinia sclerotiorum, which are some of the most important bean pathogens. Furthermore, the bean-field isolates stimulated germination of bean seeds and subsequent growth of above ground parts of the bean plant. Transcriptomic analysis of bean plants inoculated with these T. arundinaceum bean-field soil isolates indicated that HA production significantly affected expression of plant defense-related genes; this effect was particularly significant in the expression of chitinase-encoding genes. Together, these results indicate that Trichoderma species producing non-phytotoxic trichothecenes can induce defenses in plants without negatively affecting germination and development.

Keywords: biological control; gene-clusters; metabolomics; plant-fungal interaction; secondary metabolites; sesquiterpenes; transcriptomics.


Conflict of interest statement

The authors declare that the research was conducted in the absence of any commercial or financial relationships that could be construed as a potential conflict of interest.

Figures

Figure 1
Figure 1
Isolation of Trichoderma strains from bean crop soils. (A) aspect of colonies isolated in Rose Bengal-Chloramphenicol medium used for fungal growth from dilutions 10-2 to 10-4 of the different bean crop soils analyzed in this work. (B) Two Trichoderma colonies are pointed to show the characteristic shape of most of the colonies from the species belonging to the genus Trichoderma that have been isolated in the current study.
Figure 2
Figure 2
Trichoderma species tree inferred by maximum likelihood (ML) analysis of full-length amino acid sequences deduced from the full-length coding regions of five housekeeping genes. Numbers on branches are bootstrap values (blue type) based on 1000 pseudoreplicates and gene concordance factors (GCF, red type). Lineage names, as described previously (Kubicek et al., 2019; Gutiérrez et al., 2021), are indicated in red type to the right of the tree. Yellow rectangle highlights the positions of the three isolates recovered during the current study.
Figure 3
Figure 3
(A) Chromatograms from HPLC-UV analysis for determination of harzianum A production by T. arundinaceum IBT 40837 (Ta37) (wild-type strain); Δtri5.3, a trichothecene non-producing mutant; and TP19.13 one of the three Trichoderma sp. strains recovered in the present work and selected for further studies. Red arrow indicates the peak corresponding to HA. Ta37 and Δtri5.3 strains have been included for comparative purposes. (B) Chromatograms from GC-MS analysis for production of trichothecene intermediates (trichodermol) and aspinolides A and B from 7 days old culture supernatants of TP6.6 strain. Chromatograms in blue correspond to metabolites detected in cultures incubated at 28°C, and those in orange correspond to those incubated at 20°C. Note that a different scale was used in the lower right panel.
Figure 4
Figure 4
Upper panels. Direct confrontation assays of Trichoderma strains, Δtri5.3 (= ΔT5.3), TP6.6 and TP19.13, versus the pathogens R. solani R43 (Rs) (first row), or S. sclerotiorum S47 (Ss) (second row). Plates were incubated for one (A), two (B), or three weeks (C). Control plates with the pathogens without Trichoderma are included in the left column. In all confrontations pathogen´s plugs are located at the right and Trichoderma plugs are located at the left of the plates. Lower panels. Cellophane membrane assays to analyze the antifungal activity of the same Trichoderma strains indicated above against Rs (third row) and Ss (forth row). Plates were incubated for one (A) or two (B) weeks after placement of the pathogen plug. Control plates with the pathogens grown without Trichoderma metabolites are included at the left column. Note that control plates were incubated in the same conditions as the plates where the direct confrontation or the cellophane membrane assays were performed.
Figure 5
Figure 5
Trichothecene biosynthetic genes (tri) in the genomes of the three Trichoderma strains isolated in the current study. Trichoderma arundinaceum IBT40837 was included for comparative purposes. Numbers inside arrows indicate the tri gene illustrated, e.g., 5 corresponds to tri5 gene. Different arrow colors indicate different gene functions as shown at the bottom of the figure. Ψ corresponds to a tri6-pseudogene.
Figure 6
Figure 6
Phylogenetic tree inferred by maximum likelihood analysis of full-length exon sequences of tri5 from TP6.6, TP15.11 and TP19.13 strains, and other 30 Trichoderma species. Numbers on each branch (blue type) are bootstrap values based on 1000 pseudoreplicates. Yellow rectangle points to the tri5 from the three isolates selected in the current study.
Figure 7
Figure 7
Phylogenetic tree inferred by maximum likelihood analysis of selected ITS1 sequence (193 bp) from amplicons retrieved from the microbiome analysis (black type, 6.6-01#) and Trichoderma species in the Brevicompactum clade (blue type sequences), The amplicon sequences selected for this analysis were those with the highest scores in BLASTn analysis in which the ITS1 sequence from the T. arundinaceum reference strain IBT 40837 was queried against all ITS1 amplicon sequences derived from four soil samples collected from Plot 6. Numbers near each branch (blue type) are bootstrap values based on 1,000 pseudoreplicates. Yellow rectangle denotes sequences of the three T. arundinaceum strains isolated in the current study and the reference strain IBT 40837. Green rectangles denote amplicon sequences that are identical to ITS1 from reference strain IBT 40837.
Figure 8
Figure 8
Mean comparison (Duncan’s multiple range test) for: (A) bean seed germination without any Trichoderma treatment (Control) and coated with the three Trichoderma strains used in this study (ΔT5.3, TP6.6, and TP19.13), incubated for 9 to 25 days after sowing, and (B) germination of bean seeds after 25 days from sown, using as source of variation the Pathogen [R. solani R43 (=R43) and S. sclerotiorum (=S47)], without any Trichoderma treatment (control) and coated with the three Trichoderma strains used in this study (ΔT5.3, TP6.6, and TP19.13). CR43 and CS47 correspond to seeds grown in substrate infected with R. solani R43 and S. sclerotiorum S47, respectively. CΔT5.3, CTP6.6, and CTP19.13= seeds inoculated with spores of ΔT5.3, TP6.6, and TP19.13, respectively, which were grown in substrate without previous pathogen inoculation. R43+# and S47+#= seeds coated with the Trichoderma strain indicated on each name (#=ΔT5.3, TP6.6, or TP19.13) and grown in a substrate previously infected with R. solani R43 and S. sclerotiorum S47, respectively. Different lowercase letters (a, b) above the bars indicate statistically significant differences between the analyzed treatments (p<0.05). ΔT5.3= Δtri5.3.
Figure 9
Figure 9
Mean comparison (Duncan’s multiple range test) of dry weight (DW) of 45 days old bean plants. (A) Evaluation of DW of aerial parts from plants grown from seeds without any Trichoderma treatment (Control) and coated with the three Trichoderma strains used in this study (ΔT5.3, TP6.6, and TP19.13). (B) Analysis of DW of root system using as source of variation the pathogen x Trichoderma interaction. Within (A, B), different letters above bars indicate significant differences (p<0.05). For the description of the different treatments (x-axis) see legend to Figure 8 . ΔT5.3= Δtri5.3.
Figure 10
Figure 10
(A) Relative expression level of 15 defense-related genes selected for the present study as deduced from the RNAseq analysis. Relative expression was inferred as the ratio of the normalized expression level (TMM) of each gene versus the actin. The values were calculated as the average and standard deviation of two biological replicates. (B) qPCR analysis to determine relative expression of the same 15 defense-related genes as above. Arithmetic average and standard deviation data from three technical replicates were represented. Analysis was performed by the 2-ΔΔCT method (Livak and Schmittgen, 2001), using the actin gene as a housekeeping internal control, and bean plants not inoculated with Trichoderma as the reference sample.
Figure 11
Figure 11
Representation of the number of genes up- or down-regulated within the different categories analyzed (upregulated: >=2, downregulated: <=-2). Comparisons represented are as follows: ΔT5/CC (plants inoculated with the strain ΔT5.3 versus non-inoculated plants), 19/CC (plants inoculated with the strain TP19.13 versus non-inoculated plants), 19/ΔT5 (plants inoculated with TP19.13 versus plants inoculated with ΔT5.3), 19R/CR (plants inoculated with T19.13 versus non-inoculated plants, both grown in the substrate infected with the pathogen R. solani R43), 19R/ΔT5R (plants inoculated with T19.13 versus plants inoculated with ΔT5.3, both grown in substrate infected with R. solani R43), ΔT5S/CS (plants inoculated with ΔT5.3 versus non-inoculated plants, both grown in substrate infected with S. sclerotiorum S47), 19S/CS (plants inoculated with TP19.13 versus non-inoculated plants, both grown in substrate infected with S. sclerotiorum S47), and 19S/ΔT5S (plants inoculated with TP19.13 versus plants inoculated with ΔT5.3, both grown in substrates amended with S. sclerotiorum S47). Sixty-four genes were selected for this analysis ( Table 3 ). The genes were grouped based on to their blast annotated function as indicated at the bottom part of the figure. ΔT5= ΔT5.3= Δtri5.3.

References

    1. APS (2010). Compendium of bean diseases. (Minnesota, USA: The American Phytopathological Society; ).
    1. Bankevich A., Nurk S., Antipov D., Gurevich A. A., Dvorkin M., Kulikov A. S., et al. . (2012). SPAdes: A new venome assembly algorithm and its applications to single-cell sequencing. J. Comput. Biol. 19, 455–477. doi: 10.1089/cmb.2012.0021 - DOI - PMC - PubMed
    1. Becares A., Fernández A. F. (2017). Microbiome based identification, monitoring and enhancement of fermentation processes and products. International Patent WO 2017/096385 A1.
    1. Benitez T., Rincón A. M., Limón M. C., Codón A. C. (2004). Biocontrol mechanisms of Trichoderma strains. Int. Microbiol. 7 (4), 249–260. - PubMed
    1. Bolger A. M., Lohse M., Usadel B. (2014). Trimmomatic: A flexible trimmer for illumina sequence data. Bioinformatics 30, 2114–2120. doi: 10.1093/bioinformatics/btu170 - DOI - PMC - PubMed

LinkOut - more resources