. 2019 Sep;100(3):10.1103/physreva.100.033419.
doi: 10.1103/physreva.100.033419.

Systematic uncertainty due to background-gas collisions in trapped-ion optical clocks

Affiliations

Systematic uncertainty due to background-gas collisions in trapped-ion optical clocks

A M Hankin et al. Phys Rev A (Coll Park). 2019 Sep.

Abstract

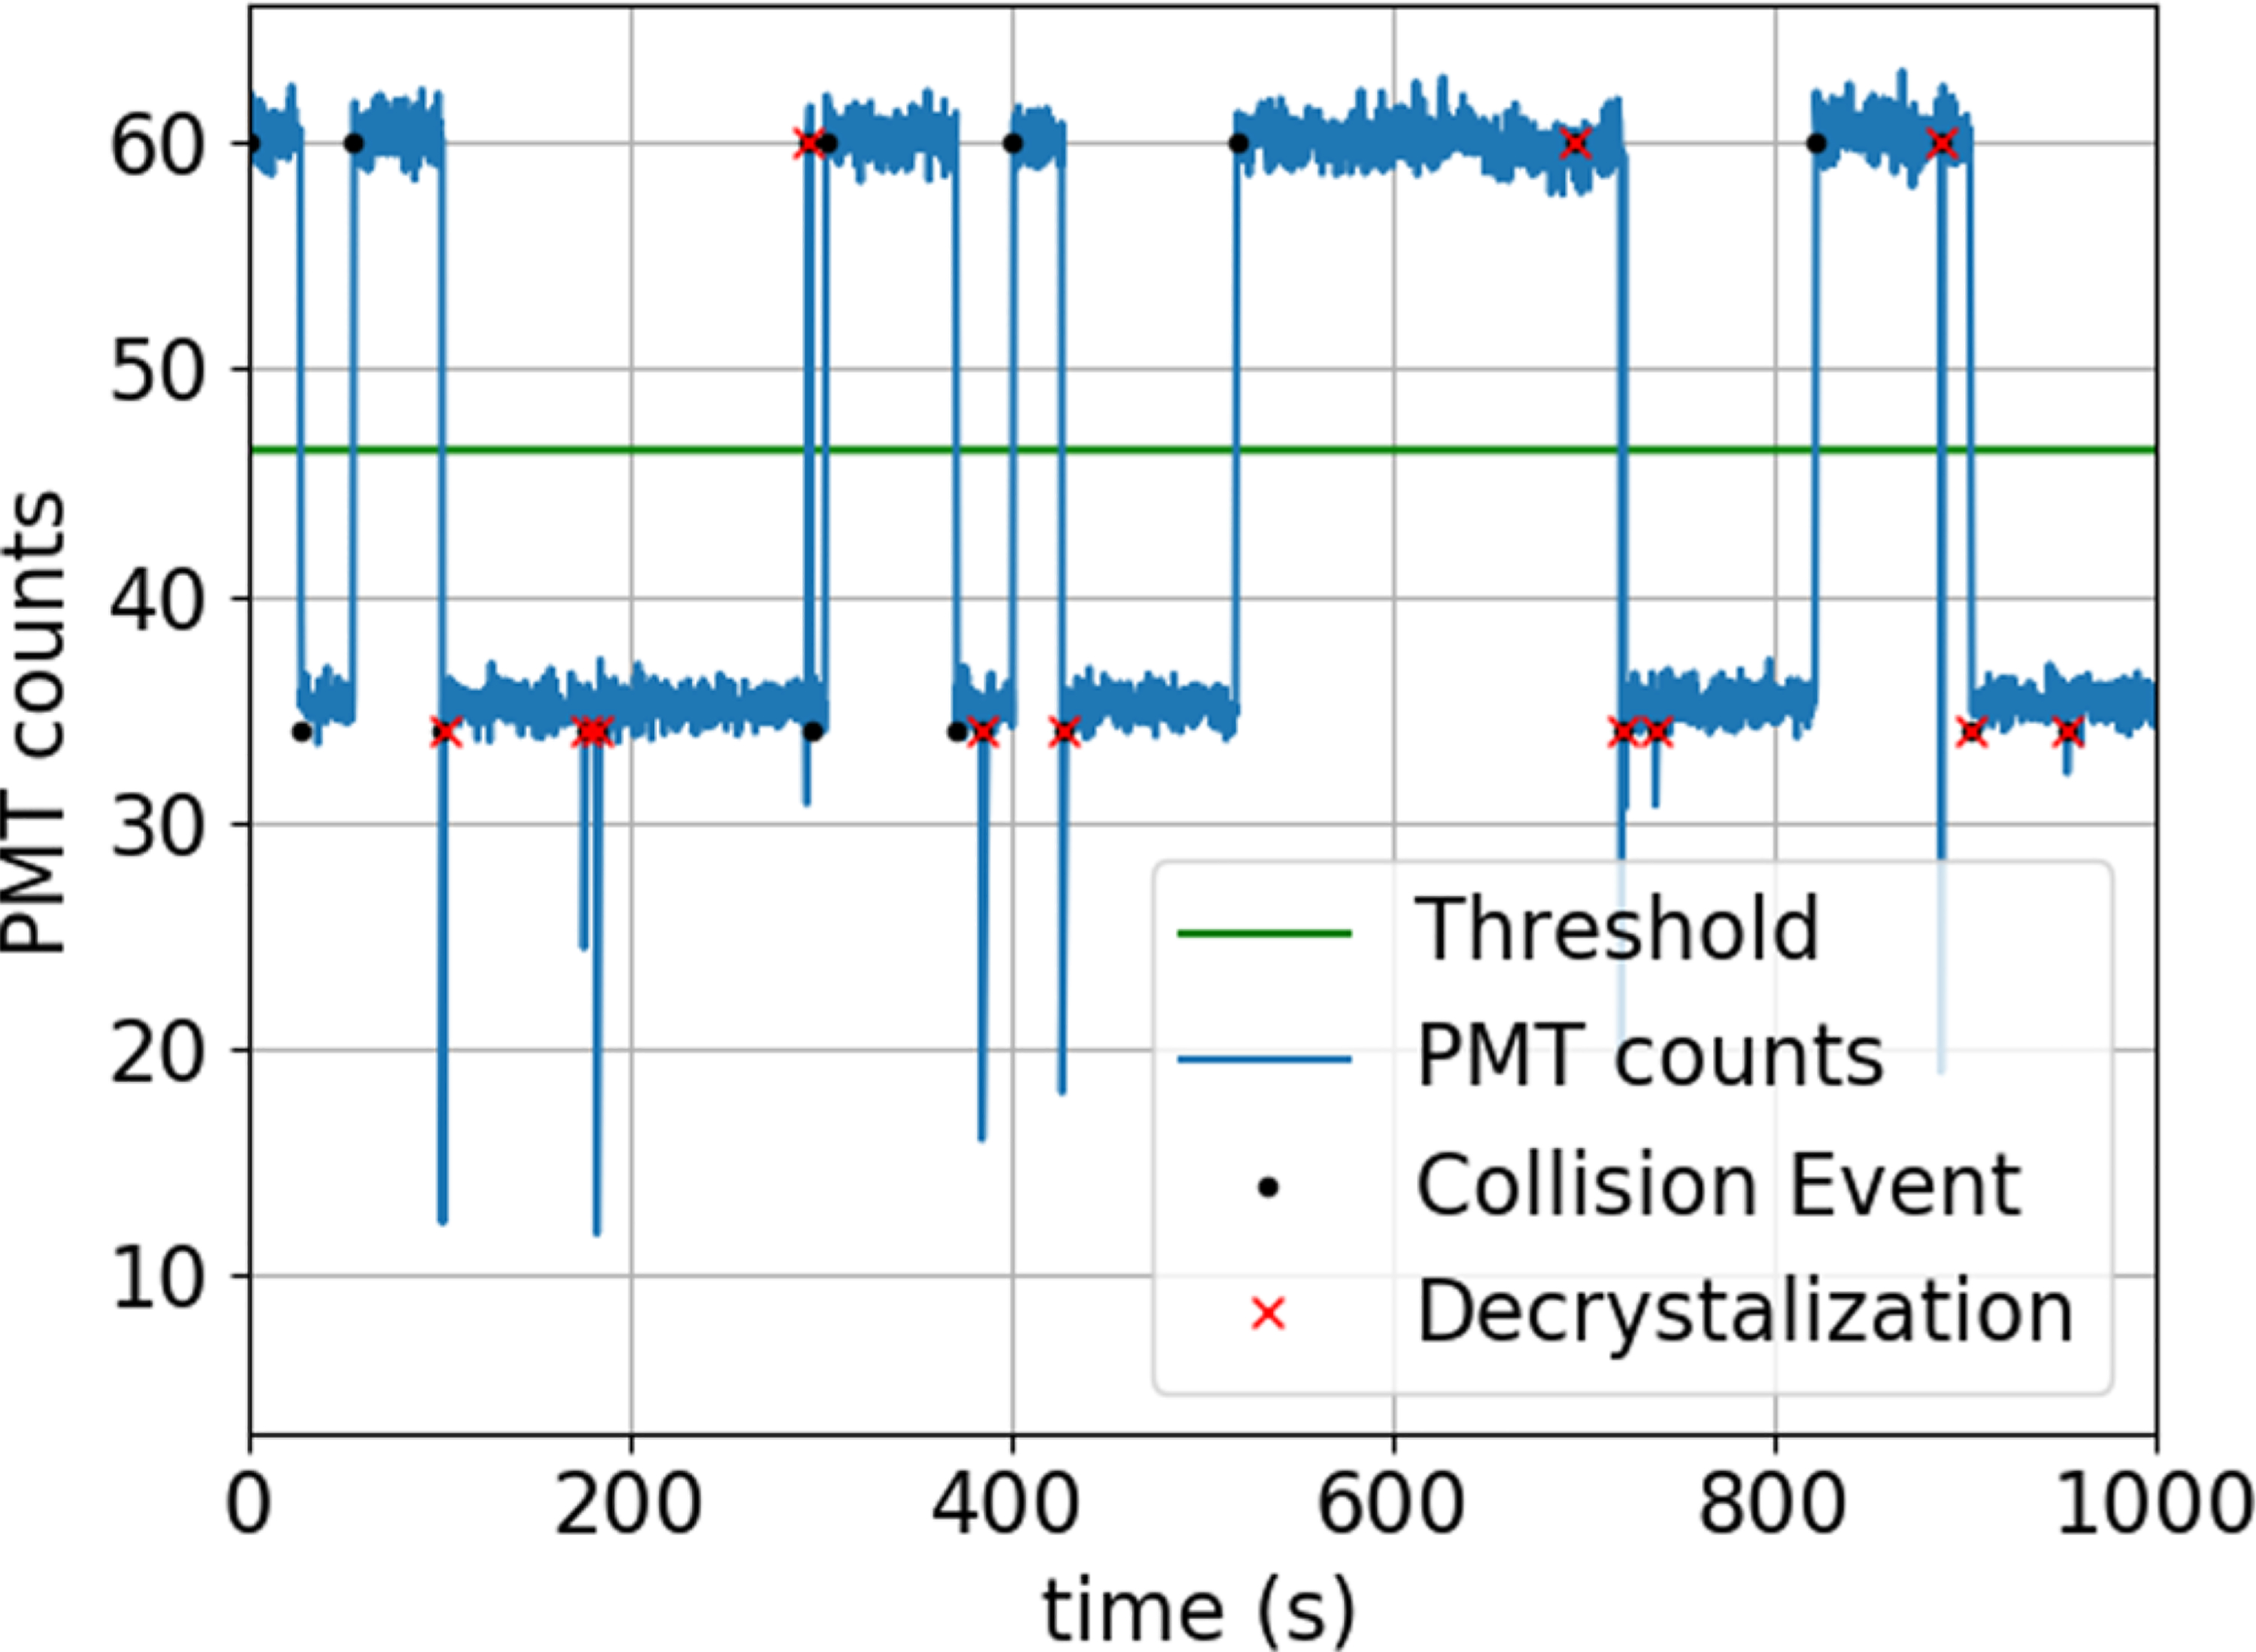
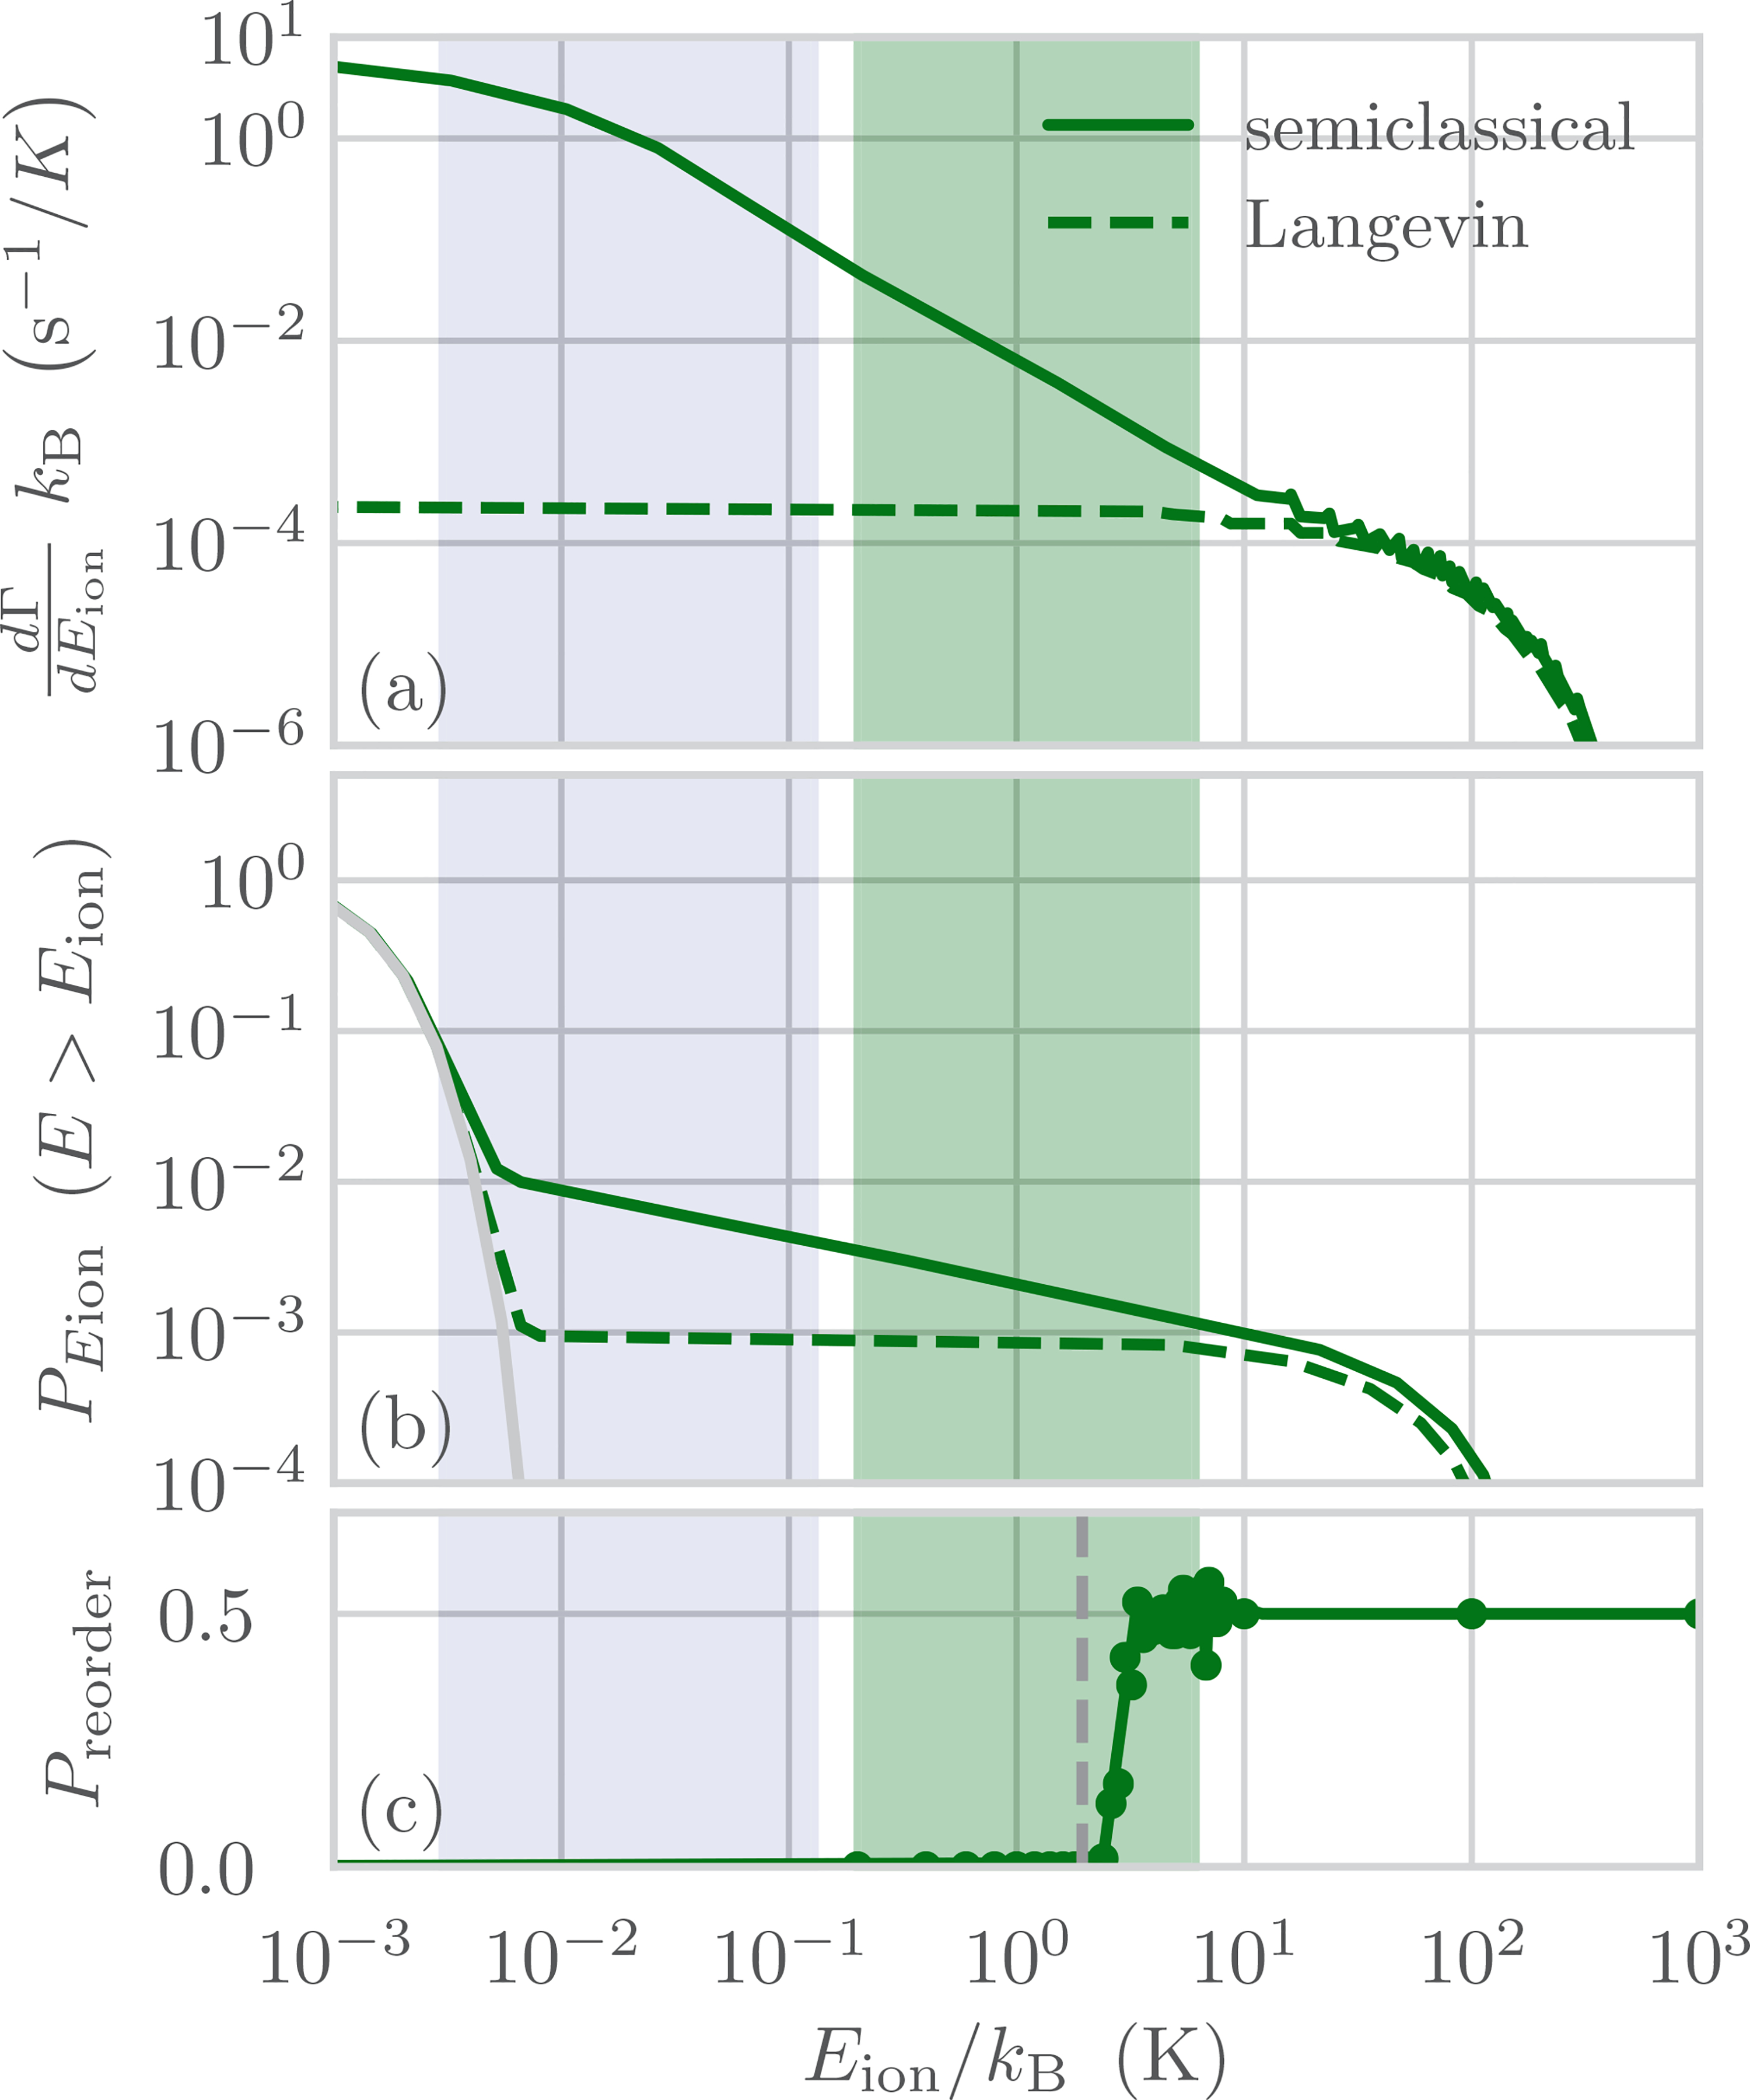
We describe a framework for calculating the frequency shift and uncertainty of trapped-ion optical atomic clocks caused by background-gas collisions, and apply this framework to an 27Al+ clock to enable a total fractional systematic uncertainty below 10-18. For this clock, with 38(19) nPa of room-temperature H2 background gas, we find that collisional heating generates a non-thermal distribution of motional states with a mean time-dilation shift of order 10-16 at the end of a 150 ms probe, which is not detected by sideband thermometry energy measurements. However, the contribution of collisional heating to the spectroscopy signal is highly suppressed and we calculate the BGC shift to be -0.6(2.4) × 10-19, where the shift is due to collisional heating time dilation and the uncertainty is dominated by the worst case ±π/2 bound used for collisional phase shift of the 27Al+ superposition state. We experimentally validate the framework and determine the background-gas pressure in situ using measurements of the rate of collisions that cause reordering of mixed-species ion pairs.


Figures

FIG. 4.
FIG. 4.
(Top panel) Lab-frame differential cross section for collisions between 27Al+ at rest and H2 with 300 K of kinetic energy as a function of scattering angle. Blue (dark gray): semiclassical differential cross section including both glancing and spiraling collisions. Red (medium gray): semiclassical differential cross section including only spiraling collisions, calculated by setting ηl = 0 for l > lcrit. Green (light gray): classical Langevin differential cross section assuming uniform scattering in the center-of-mass frame and that the total cross section is given by πbcrit2. (Bottom panel) Lab-frame kinetic energy of the 27Al+ ion after the collision as a function of scattering angle.
FIG. 5.
FIG. 5.
(Top panel) Differential collision rate for each ion of a 40Ca+27Al+ two-ion crystal in 51.9 nPa of H2 BG at 295 K. (Other panels) Reorder probability calculated using the Monte Carlo ion trajectory simulations. Each panel is for different trap parameters. The reorder barrier for each set of trap parameters is specified on the left side of the panel and is shown as a dashed vertical line. The laser cooling parameters used are a saturation parameter of s = 300 and a detuning of 80 MHz.
FIG. 6.
FIG. 6.
PMT counts observed during a typical reorder-rate measurement. A knife edge placed at the center of an optical image of the two-ion crystal causes a reduction in the measured count rate for the order in which Ca+ is partially blocked. For this example, two-ion crystal order changes (black dots) are observed as sudden changes between 60 and 35 counts measured during a 800 μs measurement window. Fluorescence dropouts below 35 PMT counts arise due to energetic collisions that cause the two-ion crystal to dissolve (red crosses).
FIG. 7.
FIG. 7.
Rabi spectroscopy line shape of a 25Mg+27Al+ optical atomic clock operated with a 150 ms probe time. Blue dotted line: spectroscopy line shape for 27Al+ at rest and without any BGCs. Blue dashed line: Monte Carlo spectroscopy line shape including the time-dilation shift and phase shift due to collisions with 1.5 μPa of H2 BG at 294.15 K, but not including the Debye-Waller factors that suppress participation of high energy population. This pressure is much higher than is achieved in experiments to exaggerate the asymmetry of the line shape. Blue solid line: Monte Carlo spectroscopy line shape including BGCs and Debye-Waller factors. Red circles: frequencies that are probed during normal clock operation. Green square: center frequency to which the optical clock output frequency is steered.
FIG. 1.
FIG. 1.
(a) Differential rate of collisions between 27Al+ at rest and 51.9 nPa of H2 BG at 295 K resulting in final ion kinetic energy Eion. The cross section for Langevin spiraling collisions underestimates the collision rate for low energies when compared with the semiclassical calculation, which includes both glancing and spiraling collisions. (b) Cumulative energy distribution (PEion) for all E > Eion. We compare the Maxwell-Boltzmann distribution for a three-dimensional harmonic oscillator at a typical Doppler cooling limit of 0.5 mK (light gray) with the distribution after 150 ms of collisions. (c) Example of a Monte Carlo calculation of the Ca+-Al+ reorder probability (Preorder) after 27Al+ receives Eion energy due to a BGC. The potential energy barrier for reordering, Ereorder, is shown as a vertical gray dashed line. The green (dark gray) shaded region marks the experimentally accessible range of Ereorder in this work. The blue (light gray) shaded region indicates the range of 87Rb-172Yb+ collision energies explored by Zipkes et al. [20], mapped onto the resulting ion energy for H2-27Al+ collisions.
FIG. 2.
FIG. 2.
Reorder rate as a function of reorder energy barrier for a 40Ca+27Al+ two-ion crystal in H2 background gas at 295 K. Blue points: experimental data. Solid blue line: single-parameter fit calculated using Eq. (2) together with trajectory simulations for Pi,reorder(Eion). The estimated background gas pressure is 51.9 nPa, with a 1σ statistical uncertainty of ±0.8 nPa and a χred2 of 2.4 (see Appendix D for a discussion of the systematic uncertainty). Dashed green line: predicted upper bound on the reorder rate [Eq. (3)] at a pressure of 51.9 nPa. Dotted green line: reorder rate for the same pressure when assuming 50% of Langevin collisions cause the crystal to reorder, as was used in previous clock evaluations.
FIG. 3.
FIG. 3.
Fractional BGC shift and uncertainty of the 27Al+ clock presented in Ref. [19] as a function of the spectroscopy probe time. (top panel) The red (dark gray) curves show the time-dilation component of the frequency shift and the green (light gray) curves show the uncertainty due to the phase shift component, with (solid lines) and without (dashed lines) including suppression due to the combined effect of Debye-Waller reduction of Rabi frequencies and the time-dilation shift of the transition center frequency outside of the Fourier-limited line shape in the Monte Carlo model. (bottom panels) The red, green, and blue lines and shaded regions show the shift and uncertainty of the time-dilation component, the phase shift component, and the total BGC shift.

References

    1. Li R, Gibble K, and Szymaniec K, Metrologia 48, 283 (2011).
    1. Guena J, Abgrall M, Rovera D, Laurent P, Chupin B, Lours M, Santarelli G, Rosenbusch P, Tobar ME, Li R, Gibble K, Clairon A, and Bize S, IEEE Trans. Ultrasonics Ferroelectrics Freq. Control 59, 391 (2012). - PubMed
    1. Gibble K, Phys. Rev. Lett. 110, 180802 (2013). - PubMed
    1. McGrew WF, Zhang X, Fasano RJ, Schäffer SA, Beloy K, Nicolodi D, Brown RC, Hinkley N, Milani G, Schioppo M, Yoon TH, and Ludlow AD, Nature (London) 564, 87 (2018). - PubMed
    1. Bothwell T, Kedar D, Oelker E, Robinson JM, Bromley SL, Tew WL, Ye J, and Kennedy CJ, arXiv:1906.06004.

LinkOut - more resources